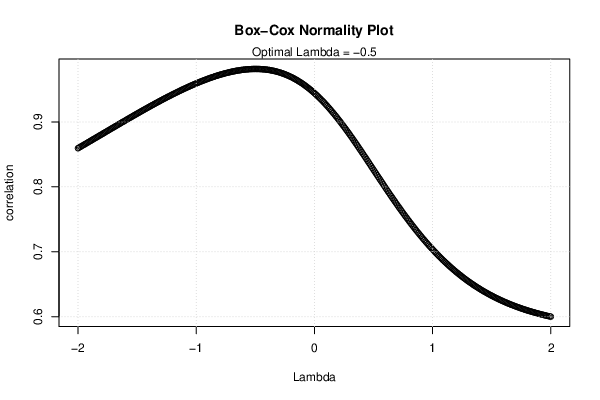
| Box-Cox Normality Plot | |
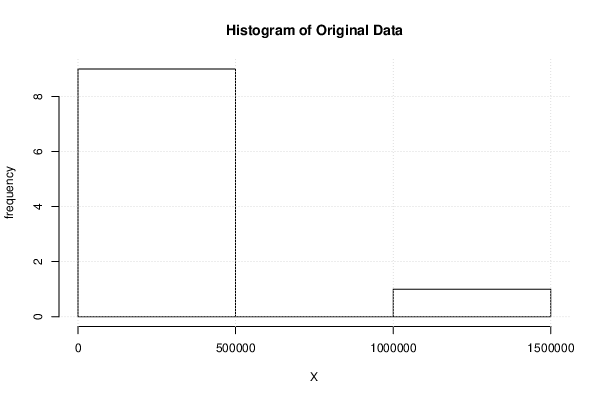
| # observations x | 10 |
| maximum correlation | 0.981668841261037 |
| optimal lambda | -0.5 |
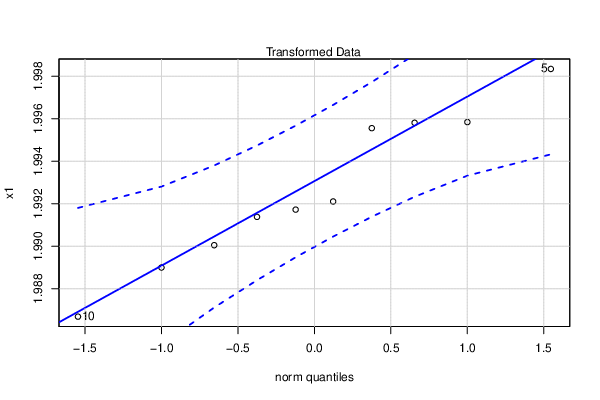
| transformation formula | for all lambda <> 0 : T(Y) = (Y^lambda - 1) / lambda |
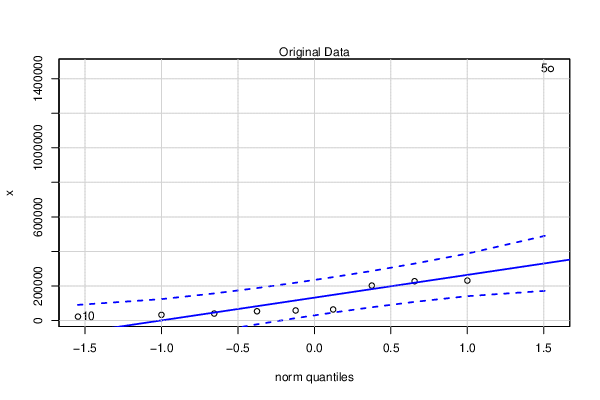
| Obs. | Original | Transformed |
| 1 | 202485 | 1.99555539093736 |
| 2 | 231302.13 | 1.9958414667372 |
| 3 | 227730.77 | 1.99580898574151 |
| 4 | 40384.62 | 1.99004773353814 |
| 5 | 1456659.16 | 1.99834289120019 |
| 6 | 33035.47 | 1.98899627442939 |
| 7 | 53823.15 | 1.99137924227414 |
| 8 | 58371.02 | 1.99172188692317 |
| 9 | 64177.03 | 1.99210521716409 |
| 10 | 22558.09 | 1.98668384526218 |
| Maximum Likelihood Estimation of Lambda |
> summary(mypT)
bcPower Transformation to Normality
  Est Power Rounded Pwr Wald Lwr Bnd Wald Upr Bnd
x    -0.382           0      -0.9516       0.1876
Likelihood ratio test that transformation parameter is equal to 0
 (log transformation)
                           LRT df    pval
LR test, lambda = (0) 1.935387  1 0.16417
Likelihood ratio test that no transformation is needed
                           LRT df       pval
LR test, lambda = (1) 26.94696  1 2.0912e-07
|