| Pearson Product Moment Correlation - Ungrouped Data | ||
| Statistic | Variable X | Variable Y |
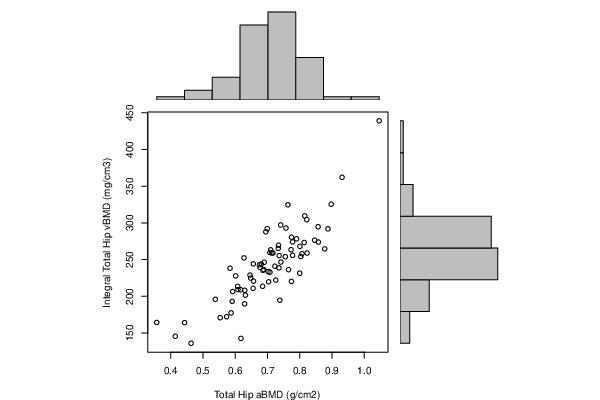
| Mean | 0.705851644736842 | 243.534171052632 |
| Biased Variance | 0.0133998066561501 | 2385.26479364179 |
| Biased Standard Deviation | 0.115757533906654 | 48.8391727370744 |
| Covariance | 4.84455688954158 | |
| Correlation | 0.845637368805561 | |
| Determination | 0.715102559520392 | |
| T-Test | 13.6287414403672 | |
| p-value (2 sided) | 7.24270407406683e-22 | |
| p-value (1 sided) | 3.62135203703341e-22 | |
| 95% CI of Correlation | [0.766274923169582, 0.899583961996621] | |
| Degrees of Freedom | 74 | |
| Number of Observations | 76 | |
| Normality Tests |
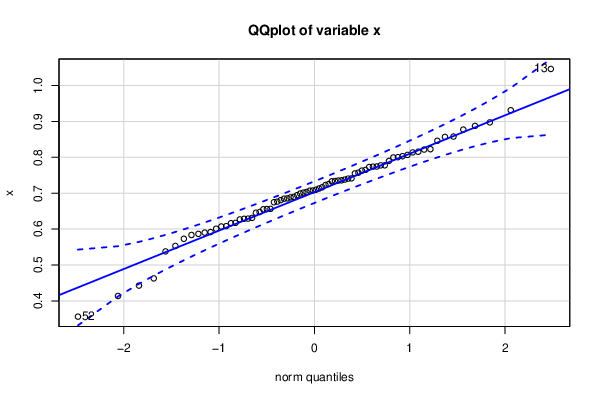
> jarque.x Jarque-Bera Normality Test data: x JB = 4.6222, p-value = 0.09915 alternative hypothesis: greater |
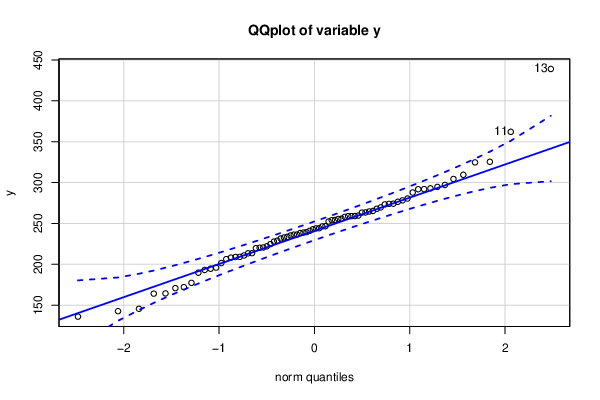
> jarque.y Jarque-Bera Normality Test data: y JB = 23.6, p-value = 7.506e-06 alternative hypothesis: greater |
> ad.x Anderson-Darling normality test data: x A = 0.43249, p-value = 0.2966 |
> ad.y Anderson-Darling normality test data: y A = 0.56092, p-value = 0.1422 |