| Multiple Linear Regression - Estimated Regression Equation |
| u[t] = -4.43878 + 0.895405a[t] -1.05312b[t] + 4.39522c[t] + 0.0331238d[t] + 0.193041e[t] + 1.01029f[t] + 1.03118g[t] + 0.595299h[t] + 1.41945i[t] + 1.73936j[t] + 0.435143k[t] + 1.43989l[t] + 0.945066m[t] + 1.73339n[t] + 1.69545o[t] + 0.563802p[t] + 0.65472q[t] + 0.913195r[t] + 0.35854s[t] + 0.718392t + e[t] |
| Multiple Linear Regression - Ordinary Least Squares | |||||
| Variable | Parameter | S.D. | T-STAT H0: parameter = 0 | 2-tail p-value | 1-tail p-value |
| (Intercept) | -4.439 | 0.3933 | -1.1280e+01 | 1.201e-24 | 6.004e-25 |
| a | +0.8954 | 0.13 | +6.8880e+00 | 3.64e-11 | 1.82e-11 |
| b | -1.053 | 0.4541 | -2.3190e+00 | 0.02109 | 0.01054 |
| c | +4.395 | 0.9015 | +4.8750e+00 | 1.811e-06 | 9.055e-07 |
| d | +0.03312 | 0.4066 | +8.1460e-02 | 0.9351 | 0.4676 |
| e | +0.193 | 0.3228 | +5.9800e-01 | 0.5503 | 0.2752 |
| f | +1.01 | 0.3319 | +3.0440e+00 | 0.002556 | 0.001278 |
| g | +1.031 | 0.2644 | +3.9000e+00 | 0.0001204 | 6.018e-05 |
| h | +0.5953 | 0.3734 | +1.5940e+00 | 0.112 | 0.05599 |
| i | +1.419 | 0.3524 | +4.0280e+00 | 7.24e-05 | 3.62e-05 |
| j | +1.739 | 0.6532 | +2.6630e+00 | 0.008194 | 0.004097 |
| k | +0.4351 | 0.289 | +1.5050e+00 | 0.1333 | 0.06666 |
| l | +1.44 | 0.467 | +3.0830e+00 | 0.002249 | 0.001125 |
| m | +0.9451 | 0.4704 | +2.0090e+00 | 0.04549 | 0.02275 |
| n | +1.733 | 0.4056 | +4.2740e+00 | 2.622e-05 | 1.311e-05 |
| o | +1.695 | 0.3854 | +4.3990e+00 | 1.538e-05 | 7.689e-06 |
| p | +0.5638 | 0.353 | +1.5970e+00 | 0.1114 | 0.05569 |
| q | +0.6547 | 0.3267 | +2.0040e+00 | 0.04604 | 0.02302 |
| r | +0.9132 | 0.8035 | +1.1360e+00 | 0.2567 | 0.1284 |
| s | +0.3585 | 0.4533 | +7.9090e-01 | 0.4297 | 0.2148 |
| t | +0.7184 | 0.4401 | +1.6320e+00 | 0.1037 | 0.05187 |
| Multiple Linear Regression - Regression Statistics | |
| Multiple R | 0.8737 |
| R-squared | 0.7634 |
| Adjusted R-squared | 0.7467 |
| F-TEST (value) | 45.81 |
| F-TEST (DF numerator) | 20 |
| F-TEST (DF denominator) | 284 |
| p-value | 0 |
| Multiple Linear Regression - Residual Statistics | |
| Residual Standard Deviation | 2.616 |
| Sum Squared Residuals | 1943 |
| Menu of Residual Diagnostics | |
| Description | Link |
| Histogram | Compute |
| Central Tendency | Compute |
| QQ Plot | Compute |
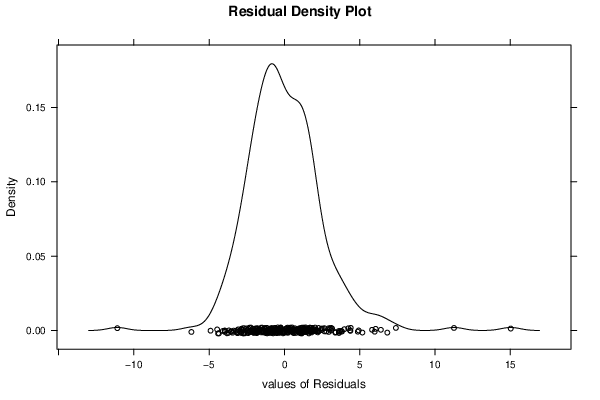
| Kernel Density Plot | Compute |
| Skewness/Kurtosis Test | Compute |
| Skewness-Kurtosis Plot | Compute |
| Harrell-Davis Plot | Compute |
| Bootstrap Plot -- Central Tendency | Compute |
| Blocked Bootstrap Plot -- Central Tendency | Compute |
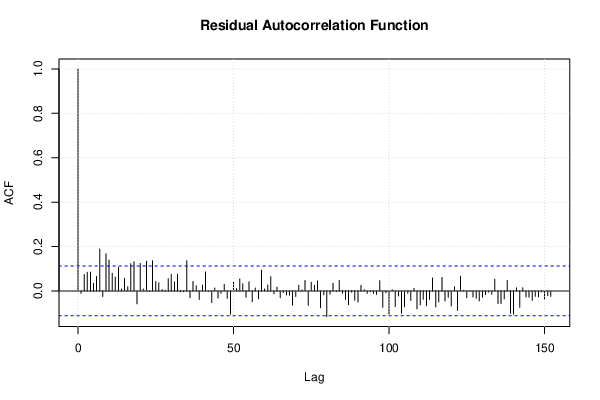
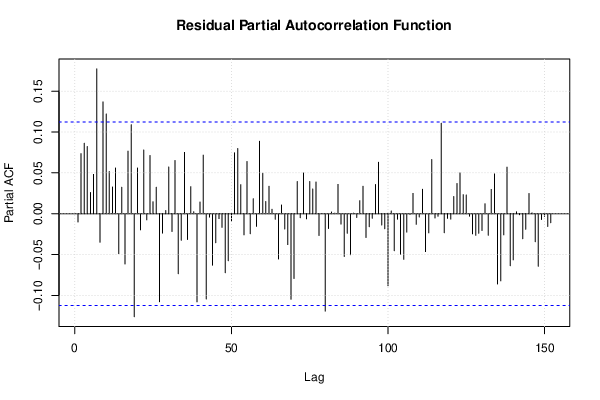
| (Partial) Autocorrelation Plot | Compute |
| Spectral Analysis | Compute |
| Tukey lambda PPCC Plot | Compute |
| Box-Cox Normality Plot | Compute |
| Summary Statistics | Compute |
| Ramsey RESET F-Test for powers (2 and 3) of fitted values |
> reset_test_fitted RESET test data: mylm RESET = 33.675, df1 = 2, df2 = 282, p-value = 7.677e-14 |
| Ramsey RESET F-Test for powers (2 and 3) of regressors |
> reset_test_regressors RESET test data: mylm RESET = 2.2217, df1 = 40, df2 = 244, p-value = 0.0001184 |
| Ramsey RESET F-Test for powers (2 and 3) of principal components |
> reset_test_principal_components RESET test data: mylm RESET = 25.66, df1 = 2, df2 = 282, p-value = 5.777e-11 |
| Variance Inflation Factors (Multicollinearity) |
> vif
       a        b        c        d        e        f        g        h
5.369180 1.177037 1.148947 1.542788 1.607982 1.352881 1.766587 1.193242
       i        j        k        l        m        n        o        p
1.395528 1.326248 1.683763 1.211688 1.347241 1.579727 1.283522 1.337040
       q        r        s        t
1.464835 1.112602 1.314406 1.295375
|