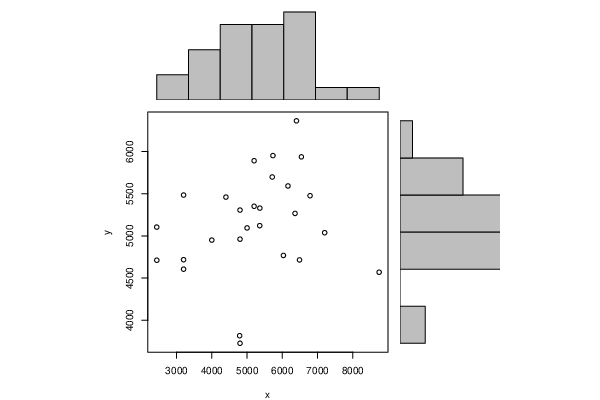
| Pearson Product Moment Correlation - Ungrouped Data | ||
| Statistic | Variable X | Variable Y |
| Mean | 5197.88888888889 | 5148.64074074074 |
| Biased Variance | 2131309.06172839 | 349805.315006859 |
| Biased Standard Deviation | 1459.90036020558 | 591.443416572421 |
| Covariance | 189079.366239316 | |
| Correlation | 0.210871216799279 | |
| Determination | 0.0444666700744084 | |
| T-Test | 1.07860986557911 | |
| p-value (2 sided) | 0.291059084973553 | |
| p-value (1 sided) | 0.145529542486776 | |
| 95% CI of Correlation | [-0.18387759783183, 0.547048031644156] | |
| Degrees of Freedom | 25 | |
| Number of Observations | 27 | |
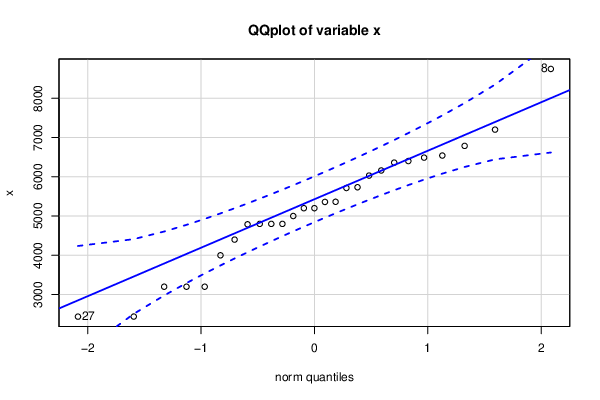
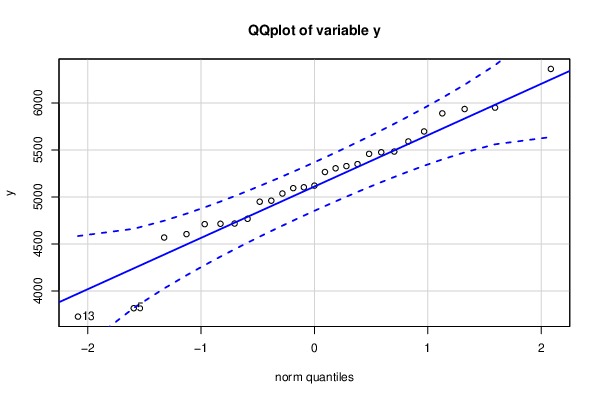
| Normality Tests |
> jarque.x Jarque-Bera Normality Test data: x JB = 0.0097065, p-value = 0.9952 alternative hypothesis: greater |
> jarque.y Jarque-Bera Normality Test data: y JB = 0.89443, p-value = 0.6394 alternative hypothesis: greater |
> ad.x Anderson-Darling normality test data: x A = 0.33717, p-value = 0.4789 |
> ad.y Anderson-Darling normality test data: y A = 0.30355, p-value = 0.5486 |