Free Statistics

of Irreproducible Research!

Author's title

Author*The author of this computation has been verified*
R Software Modulerwasp_autocorrelation.wasp
Title produced by software(Partial) Autocorrelation Function
Date of computationWed, 22 Jan 2020 11:49:13 +0100
Cite this page as followsStatistical Computations at FreeStatistics.org, Office for Research Development and Education, URL https://freestatistics.org/blog/index.php?v=date/2020/Jan/22/t1579690363qd955n3eujx88j7.htm/, Retrieved Thu, 25 Apr 2024 15:30:15 +0000
Statistical Computations at FreeStatistics.org, Office for Research Development and Education, URL https://freestatistics.org/blog/index.php?pk=319015, Retrieved Thu, 25 Apr 2024 15:30:15 +0000
QR Codes:

Original text written by user:
IsPrivate?No (this computation is public)
User-defined keywordsd=1 en D=1
Estimated Impact133
Family? (F = Feedback message, R = changed R code, M = changed R Module, P = changed Parameters, D = changed Data)
-       [(Partial) Autocorrelation Function] [Examen 22/01] [2020-01-22 10:49:13] [6318fcabf82ddcca686e14c1c17254d8] [Current]
Feedback Forum

Post a new message
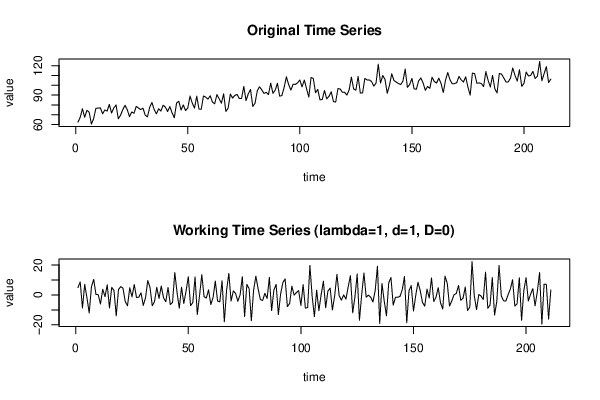
Dataseries X:
62.4
67.4
76.1
67.4
74.5
72.6
60.5
66.1
76.5
76.8
77
71
74.8
73.7
80.5
71.8
76.9
79.9
65.9
69.5
75.1
79.6
75.2
68
72.8
71.5
78.5
76.8
75.3
76.7
69.7
67.8
77.5
82.5
75.3
70.9
76
73.7
79.7
77.8
73.3
78.3
71.9
67
82
83.7
74.8
80
74.3
76.8
89
81.9
76.8
88.9
75.8
75.5
89.1
88
85.9
89.3
82.9
81.2
90.5
86.4
81.8
91.3
73.4
76.6
91
87
89.7
90.7
86.5
86.6
98.8
84.4
91.4
95.7
78.5
81.7
94.3
98.5
95.4
91.7
92.8
90.5
102.2
91.8
95
102
88.9
89.6
97.9
108.6
100.8
95.1
101
100.9
102.5
105.4
98.4
105.3
96.5
88.1
107.9
107
92.5
95.7
85.2
85.5
94.7
86.2
88.8
93.4
83.4
82.9
96.7
96.2
92.8
92.8
90
95.4
108.3
96.3
95
109
92
92.3
107
105.5
105.4
103.9
99.2
102.2
121.5
102.3
110
105.9
91.9
100
111.7
104.9
103.3
101.8
100.8
104.2
116.5
97.9
100.7
107
96.3
96
104.5
107.4
102.4
94.9
98.8
96.8
108.2
103.8
102.3
107.2
102
92.6
105.2
113
105.6
101.6
101.7
102.7
109
105.5
103.3
108.6
98.2
90
112.4
111.9
102.1
102.4
101.7
98.7
114
105.1
98.3
110
96.5
92.2
112
111.4
107.5
103.4
103.5
107.4
117.6
110.2
104.3
115.9
98.9
101.9
113.5
109.5
110
114.2
106.9
109.2
124.2
104.7
111.9
119
102.9
106.3


Summary of computational transaction
Raw Input view raw input (R code)
Raw Outputview raw output of R engine
Computing time0 seconds
R ServerBig Analytics Cloud Computing Center

\begin{tabular}{lllllllll}
\hline
Summary of computational transaction \tabularnewline
Raw Input view raw input (R code)  \tabularnewline
Raw Outputview raw output of R engine  \tabularnewline
Computing time0 seconds \tabularnewline
R ServerBig Analytics Cloud Computing Center \tabularnewline
\hline
\end{tabular}
%Source: https://freestatistics.org/blog/index.php?pk=319015&T=0

[TABLE]
[ROW]
Summary of computational transaction[/C][/ROW] [ROW]Raw Input[/C] view raw input (R code) [/C][/ROW] [ROW]Raw Output[/C]view raw output of R engine [/C][/ROW] [ROW]Computing time[/C]0 seconds[/C][/ROW] [ROW]R Server[/C]Big Analytics Cloud Computing Center[/C][/ROW] [/TABLE] Source: https://freestatistics.org/blog/index.php?pk=319015&T=0

Globally Unique Identifier (entire table): ba.freestatistics.org/blog/index.php?pk=319015&T=0

As an alternative you can also use a QR Code:  

The GUIDs for individual cells are displayed in the table below:

Summary of computational transaction
Raw Input view raw input (R code)
Raw Outputview raw output of R engine
Computing time0 seconds
R ServerBig Analytics Cloud Computing Center


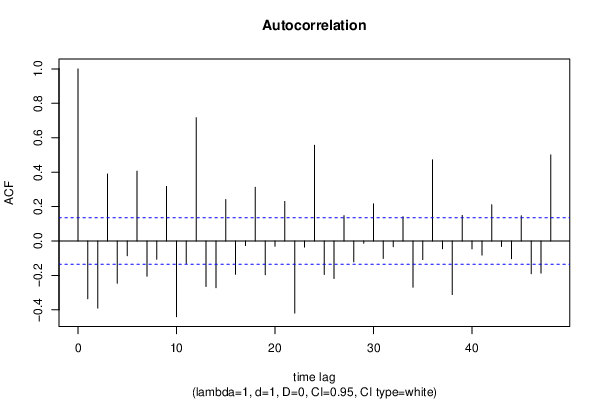
Autocorrelation Function
Time lag kACF(k)T-STATP-value
1-0.335261-4.86991e-06
2-0.389877-5.66330
30.3890725.65160
4-0.244632-3.55350.000235
5-0.084971-1.23430.109236
60.4059625.89690
7-0.204081-2.96440.00169
8-0.105498-1.53240.063455
90.3174824.61173e-06
10-0.439452-6.38340
11-0.130736-1.8990.029461
120.71688410.41330
13-0.263838-3.83258.4e-05
14-0.270911-3.93525.6e-05
150.2412723.50470.000279
16-0.193445-2.80990.00271
17-0.026268-0.38160.351587
180.312624.54115e-06
19-0.195763-2.84360.002449
20-0.030226-0.43910.330534
210.2302163.34410.000488
22-0.418936-6.08540
23-0.035042-0.5090.305636
240.5567758.08760
25-0.194421-2.82410.002598
26-0.217332-3.15690.000914
270.1475612.14340.016611
28-0.120877-1.75580.040283
29-0.012316-0.17890.429094
300.2167193.1480.000941
31-0.101019-1.46740.071879
32-0.03296-0.47880.316298
330.1409972.04810.020894
34-0.268171-3.89546.6e-05
35-0.108032-1.56930.059043
360.4721016.85770
37-0.044652-0.64860.258649
38-0.311126-4.51945e-06
390.1490712.16540.01574
40-0.045152-0.65590.256312
41-0.081549-1.18460.11876
420.2107453.06120.001245
43-0.031196-0.45320.325452
44-0.103094-1.49750.067875
450.1465082.12810.017242
46-0.189704-2.75560.003185
47-0.186246-2.70540.00369
480.5003237.26760

\begin{tabular}{lllllllll}
\hline
Autocorrelation Function \tabularnewline
Time lag k & ACF(k) & T-STAT & P-value \tabularnewline
1 & -0.335261 & -4.8699 & 1e-06 \tabularnewline
2 & -0.389877 & -5.6633 & 0 \tabularnewline
3 & 0.389072 & 5.6516 & 0 \tabularnewline
4 & -0.244632 & -3.5535 & 0.000235 \tabularnewline
5 & -0.084971 & -1.2343 & 0.109236 \tabularnewline
6 & 0.405962 & 5.8969 & 0 \tabularnewline
7 & -0.204081 & -2.9644 & 0.00169 \tabularnewline
8 & -0.105498 & -1.5324 & 0.063455 \tabularnewline
9 & 0.317482 & 4.6117 & 3e-06 \tabularnewline
10 & -0.439452 & -6.3834 & 0 \tabularnewline
11 & -0.130736 & -1.899 & 0.029461 \tabularnewline
12 & 0.716884 & 10.4133 & 0 \tabularnewline
13 & -0.263838 & -3.8325 & 8.4e-05 \tabularnewline
14 & -0.270911 & -3.9352 & 5.6e-05 \tabularnewline
15 & 0.241272 & 3.5047 & 0.000279 \tabularnewline
16 & -0.193445 & -2.8099 & 0.00271 \tabularnewline
17 & -0.026268 & -0.3816 & 0.351587 \tabularnewline
18 & 0.31262 & 4.5411 & 5e-06 \tabularnewline
19 & -0.195763 & -2.8436 & 0.002449 \tabularnewline
20 & -0.030226 & -0.4391 & 0.330534 \tabularnewline
21 & 0.230216 & 3.3441 & 0.000488 \tabularnewline
22 & -0.418936 & -6.0854 & 0 \tabularnewline
23 & -0.035042 & -0.509 & 0.305636 \tabularnewline
24 & 0.556775 & 8.0876 & 0 \tabularnewline
25 & -0.194421 & -2.8241 & 0.002598 \tabularnewline
26 & -0.217332 & -3.1569 & 0.000914 \tabularnewline
27 & 0.147561 & 2.1434 & 0.016611 \tabularnewline
28 & -0.120877 & -1.7558 & 0.040283 \tabularnewline
29 & -0.012316 & -0.1789 & 0.429094 \tabularnewline
30 & 0.216719 & 3.148 & 0.000941 \tabularnewline
31 & -0.101019 & -1.4674 & 0.071879 \tabularnewline
32 & -0.03296 & -0.4788 & 0.316298 \tabularnewline
33 & 0.140997 & 2.0481 & 0.020894 \tabularnewline
34 & -0.268171 & -3.8954 & 6.6e-05 \tabularnewline
35 & -0.108032 & -1.5693 & 0.059043 \tabularnewline
36 & 0.472101 & 6.8577 & 0 \tabularnewline
37 & -0.044652 & -0.6486 & 0.258649 \tabularnewline
38 & -0.311126 & -4.5194 & 5e-06 \tabularnewline
39 & 0.149071 & 2.1654 & 0.01574 \tabularnewline
40 & -0.045152 & -0.6559 & 0.256312 \tabularnewline
41 & -0.081549 & -1.1846 & 0.11876 \tabularnewline
42 & 0.210745 & 3.0612 & 0.001245 \tabularnewline
43 & -0.031196 & -0.4532 & 0.325452 \tabularnewline
44 & -0.103094 & -1.4975 & 0.067875 \tabularnewline
45 & 0.146508 & 2.1281 & 0.017242 \tabularnewline
46 & -0.189704 & -2.7556 & 0.003185 \tabularnewline
47 & -0.186246 & -2.7054 & 0.00369 \tabularnewline
48 & 0.500323 & 7.2676 & 0 \tabularnewline
\hline
\end{tabular}
%Source: https://freestatistics.org/blog/index.php?pk=319015&T=1

[TABLE]
[ROW][C]Autocorrelation Function[/C][/ROW]
[ROW][C]Time lag k[/C][C]ACF(k)[/C][C]T-STAT[/C][C]P-value[/C][/ROW]
[ROW][C]1[/C][C]-0.335261[/C][C]-4.8699[/C][C]1e-06[/C][/ROW]
[ROW][C]2[/C][C]-0.389877[/C][C]-5.6633[/C][C]0[/C][/ROW]
[ROW][C]3[/C][C]0.389072[/C][C]5.6516[/C][C]0[/C][/ROW]
[ROW][C]4[/C][C]-0.244632[/C][C]-3.5535[/C][C]0.000235[/C][/ROW]
[ROW][C]5[/C][C]-0.084971[/C][C]-1.2343[/C][C]0.109236[/C][/ROW]
[ROW][C]6[/C][C]0.405962[/C][C]5.8969[/C][C]0[/C][/ROW]
[ROW][C]7[/C][C]-0.204081[/C][C]-2.9644[/C][C]0.00169[/C][/ROW]
[ROW][C]8[/C][C]-0.105498[/C][C]-1.5324[/C][C]0.063455[/C][/ROW]
[ROW][C]9[/C][C]0.317482[/C][C]4.6117[/C][C]3e-06[/C][/ROW]
[ROW][C]10[/C][C]-0.439452[/C][C]-6.3834[/C][C]0[/C][/ROW]
[ROW][C]11[/C][C]-0.130736[/C][C]-1.899[/C][C]0.029461[/C][/ROW]
[ROW][C]12[/C][C]0.716884[/C][C]10.4133[/C][C]0[/C][/ROW]
[ROW][C]13[/C][C]-0.263838[/C][C]-3.8325[/C][C]8.4e-05[/C][/ROW]
[ROW][C]14[/C][C]-0.270911[/C][C]-3.9352[/C][C]5.6e-05[/C][/ROW]
[ROW][C]15[/C][C]0.241272[/C][C]3.5047[/C][C]0.000279[/C][/ROW]
[ROW][C]16[/C][C]-0.193445[/C][C]-2.8099[/C][C]0.00271[/C][/ROW]
[ROW][C]17[/C][C]-0.026268[/C][C]-0.3816[/C][C]0.351587[/C][/ROW]
[ROW][C]18[/C][C]0.31262[/C][C]4.5411[/C][C]5e-06[/C][/ROW]
[ROW][C]19[/C][C]-0.195763[/C][C]-2.8436[/C][C]0.002449[/C][/ROW]
[ROW][C]20[/C][C]-0.030226[/C][C]-0.4391[/C][C]0.330534[/C][/ROW]
[ROW][C]21[/C][C]0.230216[/C][C]3.3441[/C][C]0.000488[/C][/ROW]
[ROW][C]22[/C][C]-0.418936[/C][C]-6.0854[/C][C]0[/C][/ROW]
[ROW][C]23[/C][C]-0.035042[/C][C]-0.509[/C][C]0.305636[/C][/ROW]
[ROW][C]24[/C][C]0.556775[/C][C]8.0876[/C][C]0[/C][/ROW]
[ROW][C]25[/C][C]-0.194421[/C][C]-2.8241[/C][C]0.002598[/C][/ROW]
[ROW][C]26[/C][C]-0.217332[/C][C]-3.1569[/C][C]0.000914[/C][/ROW]
[ROW][C]27[/C][C]0.147561[/C][C]2.1434[/C][C]0.016611[/C][/ROW]
[ROW][C]28[/C][C]-0.120877[/C][C]-1.7558[/C][C]0.040283[/C][/ROW]
[ROW][C]29[/C][C]-0.012316[/C][C]-0.1789[/C][C]0.429094[/C][/ROW]
[ROW][C]30[/C][C]0.216719[/C][C]3.148[/C][C]0.000941[/C][/ROW]
[ROW][C]31[/C][C]-0.101019[/C][C]-1.4674[/C][C]0.071879[/C][/ROW]
[ROW][C]32[/C][C]-0.03296[/C][C]-0.4788[/C][C]0.316298[/C][/ROW]
[ROW][C]33[/C][C]0.140997[/C][C]2.0481[/C][C]0.020894[/C][/ROW]
[ROW][C]34[/C][C]-0.268171[/C][C]-3.8954[/C][C]6.6e-05[/C][/ROW]
[ROW][C]35[/C][C]-0.108032[/C][C]-1.5693[/C][C]0.059043[/C][/ROW]
[ROW][C]36[/C][C]0.472101[/C][C]6.8577[/C][C]0[/C][/ROW]
[ROW][C]37[/C][C]-0.044652[/C][C]-0.6486[/C][C]0.258649[/C][/ROW]
[ROW][C]38[/C][C]-0.311126[/C][C]-4.5194[/C][C]5e-06[/C][/ROW]
[ROW][C]39[/C][C]0.149071[/C][C]2.1654[/C][C]0.01574[/C][/ROW]
[ROW][C]40[/C][C]-0.045152[/C][C]-0.6559[/C][C]0.256312[/C][/ROW]
[ROW][C]41[/C][C]-0.081549[/C][C]-1.1846[/C][C]0.11876[/C][/ROW]
[ROW][C]42[/C][C]0.210745[/C][C]3.0612[/C][C]0.001245[/C][/ROW]
[ROW][C]43[/C][C]-0.031196[/C][C]-0.4532[/C][C]0.325452[/C][/ROW]
[ROW][C]44[/C][C]-0.103094[/C][C]-1.4975[/C][C]0.067875[/C][/ROW]
[ROW][C]45[/C][C]0.146508[/C][C]2.1281[/C][C]0.017242[/C][/ROW]
[ROW][C]46[/C][C]-0.189704[/C][C]-2.7556[/C][C]0.003185[/C][/ROW]
[ROW][C]47[/C][C]-0.186246[/C][C]-2.7054[/C][C]0.00369[/C][/ROW]
[ROW][C]48[/C][C]0.500323[/C][C]7.2676[/C][C]0[/C][/ROW]
[/TABLE]
Source: https://freestatistics.org/blog/index.php?pk=319015&T=1

Globally Unique Identifier (entire table): ba.freestatistics.org/blog/index.php?pk=319015&T=1

As an alternative you can also use a QR Code:  

The GUIDs for individual cells are displayed in the table below:

Autocorrelation Function
Time lag kACF(k)T-STATP-value
1-0.335261-4.86991e-06
2-0.389877-5.66330
30.3890725.65160
4-0.244632-3.55350.000235
5-0.084971-1.23430.109236
60.4059625.89690
7-0.204081-2.96440.00169
8-0.105498-1.53240.063455
90.3174824.61173e-06
10-0.439452-6.38340
11-0.130736-1.8990.029461
120.71688410.41330
13-0.263838-3.83258.4e-05
14-0.270911-3.93525.6e-05
150.2412723.50470.000279
16-0.193445-2.80990.00271
17-0.026268-0.38160.351587
180.312624.54115e-06
19-0.195763-2.84360.002449
20-0.030226-0.43910.330534
210.2302163.34410.000488
22-0.418936-6.08540
23-0.035042-0.5090.305636
240.5567758.08760
25-0.194421-2.82410.002598
26-0.217332-3.15690.000914
270.1475612.14340.016611
28-0.120877-1.75580.040283
29-0.012316-0.17890.429094
300.2167193.1480.000941
31-0.101019-1.46740.071879
32-0.03296-0.47880.316298
330.1409972.04810.020894
34-0.268171-3.89546.6e-05
35-0.108032-1.56930.059043
360.4721016.85770
37-0.044652-0.64860.258649
38-0.311126-4.51945e-06
390.1490712.16540.01574
40-0.045152-0.65590.256312
41-0.081549-1.18460.11876
420.2107453.06120.001245
43-0.031196-0.45320.325452
44-0.103094-1.49750.067875
450.1465082.12810.017242
46-0.189704-2.75560.003185
47-0.186246-2.70540.00369
480.5003237.26760


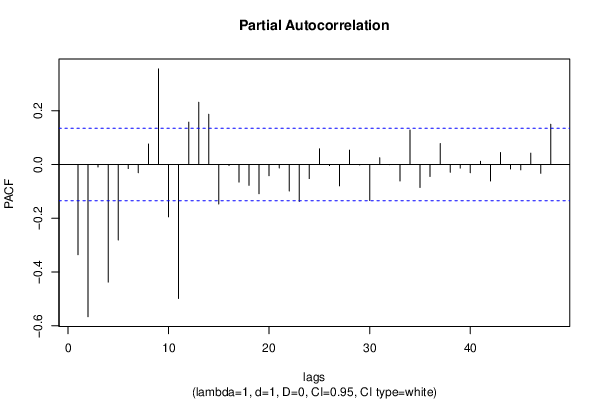
Partial Autocorrelation Function
Time lag kPACF(k)T-STATP-value
1-0.335261-4.86991e-06
2-0.565882-8.21990
3-0.008822-0.12810.449078
4-0.437283-6.35190
5-0.280606-4.0763.2e-05
6-0.015076-0.2190.413432
7-0.030192-0.43860.330713
80.0762181.10710.134749
90.3557035.16690
10-0.194411-2.8240.002599
11-0.497955-7.23320
120.1576572.29010.011502
130.2318773.36820.00045
140.1871212.71810.003556
15-0.146879-2.13350.017017
16-0.003064-0.04450.482272
17-0.065369-0.94950.171715
18-0.077358-1.12370.131211
19-0.108653-1.57830.058
20-0.041503-0.60290.273624
21-0.012739-0.1850.426687
22-0.098417-1.42960.077157
23-0.137493-1.99720.023544
24-0.052105-0.75690.224985
250.0584310.84880.198487
26-0.003882-0.05640.477542
27-0.079031-1.1480.126136
280.0533910.77550.219442
29-0.001725-0.02510.490015
30-0.133685-1.94190.026741
310.0249170.36190.35888
32-0.000532-0.00770.496919
33-0.061038-0.88660.188143
340.1282911.86350.031888
35-0.085374-1.24010.108152
36-0.044451-0.64570.25959
370.0784281.13920.127948
38-0.028267-0.41060.340892
39-0.013027-0.18920.425046
40-0.030379-0.44130.32973
410.0118660.17240.431659
42-0.061025-0.88640.188196
430.0443970.64490.259845
44-0.016225-0.23570.406957
45-0.019496-0.28320.38865
460.0424060.6160.269283
47-0.032512-0.47230.318611
480.1494982.17160.015501

\begin{tabular}{lllllllll}
\hline
Partial Autocorrelation Function \tabularnewline
Time lag k & PACF(k) & T-STAT & P-value \tabularnewline
1 & -0.335261 & -4.8699 & 1e-06 \tabularnewline
2 & -0.565882 & -8.2199 & 0 \tabularnewline
3 & -0.008822 & -0.1281 & 0.449078 \tabularnewline
4 & -0.437283 & -6.3519 & 0 \tabularnewline
5 & -0.280606 & -4.076 & 3.2e-05 \tabularnewline
6 & -0.015076 & -0.219 & 0.413432 \tabularnewline
7 & -0.030192 & -0.4386 & 0.330713 \tabularnewline
8 & 0.076218 & 1.1071 & 0.134749 \tabularnewline
9 & 0.355703 & 5.1669 & 0 \tabularnewline
10 & -0.194411 & -2.824 & 0.002599 \tabularnewline
11 & -0.497955 & -7.2332 & 0 \tabularnewline
12 & 0.157657 & 2.2901 & 0.011502 \tabularnewline
13 & 0.231877 & 3.3682 & 0.00045 \tabularnewline
14 & 0.187121 & 2.7181 & 0.003556 \tabularnewline
15 & -0.146879 & -2.1335 & 0.017017 \tabularnewline
16 & -0.003064 & -0.0445 & 0.482272 \tabularnewline
17 & -0.065369 & -0.9495 & 0.171715 \tabularnewline
18 & -0.077358 & -1.1237 & 0.131211 \tabularnewline
19 & -0.108653 & -1.5783 & 0.058 \tabularnewline
20 & -0.041503 & -0.6029 & 0.273624 \tabularnewline
21 & -0.012739 & -0.185 & 0.426687 \tabularnewline
22 & -0.098417 & -1.4296 & 0.077157 \tabularnewline
23 & -0.137493 & -1.9972 & 0.023544 \tabularnewline
24 & -0.052105 & -0.7569 & 0.224985 \tabularnewline
25 & 0.058431 & 0.8488 & 0.198487 \tabularnewline
26 & -0.003882 & -0.0564 & 0.477542 \tabularnewline
27 & -0.079031 & -1.148 & 0.126136 \tabularnewline
28 & 0.053391 & 0.7755 & 0.219442 \tabularnewline
29 & -0.001725 & -0.0251 & 0.490015 \tabularnewline
30 & -0.133685 & -1.9419 & 0.026741 \tabularnewline
31 & 0.024917 & 0.3619 & 0.35888 \tabularnewline
32 & -0.000532 & -0.0077 & 0.496919 \tabularnewline
33 & -0.061038 & -0.8866 & 0.188143 \tabularnewline
34 & 0.128291 & 1.8635 & 0.031888 \tabularnewline
35 & -0.085374 & -1.2401 & 0.108152 \tabularnewline
36 & -0.044451 & -0.6457 & 0.25959 \tabularnewline
37 & 0.078428 & 1.1392 & 0.127948 \tabularnewline
38 & -0.028267 & -0.4106 & 0.340892 \tabularnewline
39 & -0.013027 & -0.1892 & 0.425046 \tabularnewline
40 & -0.030379 & -0.4413 & 0.32973 \tabularnewline
41 & 0.011866 & 0.1724 & 0.431659 \tabularnewline
42 & -0.061025 & -0.8864 & 0.188196 \tabularnewline
43 & 0.044397 & 0.6449 & 0.259845 \tabularnewline
44 & -0.016225 & -0.2357 & 0.406957 \tabularnewline
45 & -0.019496 & -0.2832 & 0.38865 \tabularnewline
46 & 0.042406 & 0.616 & 0.269283 \tabularnewline
47 & -0.032512 & -0.4723 & 0.318611 \tabularnewline
48 & 0.149498 & 2.1716 & 0.015501 \tabularnewline
\hline
\end{tabular}
%Source: https://freestatistics.org/blog/index.php?pk=319015&T=2

[TABLE]
[ROW][C]Partial Autocorrelation Function[/C][/ROW]
[ROW][C]Time lag k[/C][C]PACF(k)[/C][C]T-STAT[/C][C]P-value[/C][/ROW]
[ROW][C]1[/C][C]-0.335261[/C][C]-4.8699[/C][C]1e-06[/C][/ROW]
[ROW][C]2[/C][C]-0.565882[/C][C]-8.2199[/C][C]0[/C][/ROW]
[ROW][C]3[/C][C]-0.008822[/C][C]-0.1281[/C][C]0.449078[/C][/ROW]
[ROW][C]4[/C][C]-0.437283[/C][C]-6.3519[/C][C]0[/C][/ROW]
[ROW][C]5[/C][C]-0.280606[/C][C]-4.076[/C][C]3.2e-05[/C][/ROW]
[ROW][C]6[/C][C]-0.015076[/C][C]-0.219[/C][C]0.413432[/C][/ROW]
[ROW][C]7[/C][C]-0.030192[/C][C]-0.4386[/C][C]0.330713[/C][/ROW]
[ROW][C]8[/C][C]0.076218[/C][C]1.1071[/C][C]0.134749[/C][/ROW]
[ROW][C]9[/C][C]0.355703[/C][C]5.1669[/C][C]0[/C][/ROW]
[ROW][C]10[/C][C]-0.194411[/C][C]-2.824[/C][C]0.002599[/C][/ROW]
[ROW][C]11[/C][C]-0.497955[/C][C]-7.2332[/C][C]0[/C][/ROW]
[ROW][C]12[/C][C]0.157657[/C][C]2.2901[/C][C]0.011502[/C][/ROW]
[ROW][C]13[/C][C]0.231877[/C][C]3.3682[/C][C]0.00045[/C][/ROW]
[ROW][C]14[/C][C]0.187121[/C][C]2.7181[/C][C]0.003556[/C][/ROW]
[ROW][C]15[/C][C]-0.146879[/C][C]-2.1335[/C][C]0.017017[/C][/ROW]
[ROW][C]16[/C][C]-0.003064[/C][C]-0.0445[/C][C]0.482272[/C][/ROW]
[ROW][C]17[/C][C]-0.065369[/C][C]-0.9495[/C][C]0.171715[/C][/ROW]
[ROW][C]18[/C][C]-0.077358[/C][C]-1.1237[/C][C]0.131211[/C][/ROW]
[ROW][C]19[/C][C]-0.108653[/C][C]-1.5783[/C][C]0.058[/C][/ROW]
[ROW][C]20[/C][C]-0.041503[/C][C]-0.6029[/C][C]0.273624[/C][/ROW]
[ROW][C]21[/C][C]-0.012739[/C][C]-0.185[/C][C]0.426687[/C][/ROW]
[ROW][C]22[/C][C]-0.098417[/C][C]-1.4296[/C][C]0.077157[/C][/ROW]
[ROW][C]23[/C][C]-0.137493[/C][C]-1.9972[/C][C]0.023544[/C][/ROW]
[ROW][C]24[/C][C]-0.052105[/C][C]-0.7569[/C][C]0.224985[/C][/ROW]
[ROW][C]25[/C][C]0.058431[/C][C]0.8488[/C][C]0.198487[/C][/ROW]
[ROW][C]26[/C][C]-0.003882[/C][C]-0.0564[/C][C]0.477542[/C][/ROW]
[ROW][C]27[/C][C]-0.079031[/C][C]-1.148[/C][C]0.126136[/C][/ROW]
[ROW][C]28[/C][C]0.053391[/C][C]0.7755[/C][C]0.219442[/C][/ROW]
[ROW][C]29[/C][C]-0.001725[/C][C]-0.0251[/C][C]0.490015[/C][/ROW]
[ROW][C]30[/C][C]-0.133685[/C][C]-1.9419[/C][C]0.026741[/C][/ROW]
[ROW][C]31[/C][C]0.024917[/C][C]0.3619[/C][C]0.35888[/C][/ROW]
[ROW][C]32[/C][C]-0.000532[/C][C]-0.0077[/C][C]0.496919[/C][/ROW]
[ROW][C]33[/C][C]-0.061038[/C][C]-0.8866[/C][C]0.188143[/C][/ROW]
[ROW][C]34[/C][C]0.128291[/C][C]1.8635[/C][C]0.031888[/C][/ROW]
[ROW][C]35[/C][C]-0.085374[/C][C]-1.2401[/C][C]0.108152[/C][/ROW]
[ROW][C]36[/C][C]-0.044451[/C][C]-0.6457[/C][C]0.25959[/C][/ROW]
[ROW][C]37[/C][C]0.078428[/C][C]1.1392[/C][C]0.127948[/C][/ROW]
[ROW][C]38[/C][C]-0.028267[/C][C]-0.4106[/C][C]0.340892[/C][/ROW]
[ROW][C]39[/C][C]-0.013027[/C][C]-0.1892[/C][C]0.425046[/C][/ROW]
[ROW][C]40[/C][C]-0.030379[/C][C]-0.4413[/C][C]0.32973[/C][/ROW]
[ROW][C]41[/C][C]0.011866[/C][C]0.1724[/C][C]0.431659[/C][/ROW]
[ROW][C]42[/C][C]-0.061025[/C][C]-0.8864[/C][C]0.188196[/C][/ROW]
[ROW][C]43[/C][C]0.044397[/C][C]0.6449[/C][C]0.259845[/C][/ROW]
[ROW][C]44[/C][C]-0.016225[/C][C]-0.2357[/C][C]0.406957[/C][/ROW]
[ROW][C]45[/C][C]-0.019496[/C][C]-0.2832[/C][C]0.38865[/C][/ROW]
[ROW][C]46[/C][C]0.042406[/C][C]0.616[/C][C]0.269283[/C][/ROW]
[ROW][C]47[/C][C]-0.032512[/C][C]-0.4723[/C][C]0.318611[/C][/ROW]
[ROW][C]48[/C][C]0.149498[/C][C]2.1716[/C][C]0.015501[/C][/ROW]
[/TABLE]
Source: https://freestatistics.org/blog/index.php?pk=319015&T=2

Globally Unique Identifier (entire table): ba.freestatistics.org/blog/index.php?pk=319015&T=2

As an alternative you can also use a QR Code:  

The GUIDs for individual cells are displayed in the table below:

Partial Autocorrelation Function
Time lag kPACF(k)T-STATP-value
1-0.335261-4.86991e-06
2-0.565882-8.21990
3-0.008822-0.12810.449078
4-0.437283-6.35190
5-0.280606-4.0763.2e-05
6-0.015076-0.2190.413432
7-0.030192-0.43860.330713
80.0762181.10710.134749
90.3557035.16690
10-0.194411-2.8240.002599
11-0.497955-7.23320
120.1576572.29010.011502
130.2318773.36820.00045
140.1871212.71810.003556
15-0.146879-2.13350.017017
16-0.003064-0.04450.482272
17-0.065369-0.94950.171715
18-0.077358-1.12370.131211
19-0.108653-1.57830.058
20-0.041503-0.60290.273624
21-0.012739-0.1850.426687
22-0.098417-1.42960.077157
23-0.137493-1.99720.023544
24-0.052105-0.75690.224985
250.0584310.84880.198487
26-0.003882-0.05640.477542
27-0.079031-1.1480.126136
280.0533910.77550.219442
29-0.001725-0.02510.490015
30-0.133685-1.94190.026741
310.0249170.36190.35888
32-0.000532-0.00770.496919
33-0.061038-0.88660.188143
340.1282911.86350.031888
35-0.085374-1.24010.108152
36-0.044451-0.64570.25959
370.0784281.13920.127948
38-0.028267-0.41060.340892
39-0.013027-0.18920.425046
40-0.030379-0.44130.32973
410.0118660.17240.431659
42-0.061025-0.88640.188196
430.0443970.64490.259845
44-0.016225-0.23570.406957
45-0.019496-0.28320.38865
460.0424060.6160.269283
47-0.032512-0.47230.318611
480.1494982.17160.015501


Parameters (Session):
par1 = two.sided ; par2 = 0.97 ; par3 = 14 ;
Parameters (R input):
par1 = 48 ; par2 = 1 ; par3 = 1 ; par4 = 0 ; par5 = 12 ; par6 = White Noise ; par7 = 0.95 ; par8 = ;
R code (references can be found in the software module):
par8 <- ''
par7 <- '0.95'
par6 <- 'White Noise'
par5 <- '12'
par4 <- '0'
par3 <- '1'
par2 <- '1'
par1 <- '48'
if (par1 == 'Default') {
par1 = 10*log10(length(x))
} else {
par1 <- as.numeric(par1)
}
par2 <- as.numeric(par2)
par3 <- as.numeric(par3)
par4 <- as.numeric(par4)
par5 <- as.numeric(par5)
if (par6 == 'White Noise') par6 <- 'white' else par6 <- 'ma'
par7 <- as.numeric(par7)
if (par8 != '') par8 <- as.numeric(par8)
x <- na.omit(x)
ox <- x
if (par8 == '') {
if (par2 == 0) {
x <- log(x)
} else {
x <- (x ^ par2 - 1) / par2
}
} else {
x <- log(x,base=par8)
}
if (par3 > 0) x <- diff(x,lag=1,difference=par3)
if (par4 > 0) x <- diff(x,lag=par5,difference=par4)
bitmap(file='picts.png')
op <- par(mfrow=c(2,1))
plot(ox,type='l',main='Original Time Series',xlab='time',ylab='value')
if (par8=='') {
mytitle <- paste('Working Time Series (lambda=',par2,', d=',par3,', D=',par4,')',sep='')
mysub <- paste('(lambda=',par2,', d=',par3,', D=',par4,', CI=', par7, ', CI type=',par6,')',sep='')
} else {
mytitle <- paste('Working Time Series (base=',par8,', d=',par3,', D=',par4,')',sep='')
mysub <- paste('(base=',par8,', d=',par3,', D=',par4,', CI=', par7, ', CI type=',par6,')',sep='')
}
plot(x,type='l', main=mytitle,xlab='time',ylab='value')
par(op)
dev.off()
bitmap(file='pic1.png')
racf <- acf(x, par1, main='Autocorrelation', xlab='time lag', ylab='ACF', ci.type=par6, ci=par7, sub=mysub)
dev.off()
bitmap(file='pic2.png')
rpacf <- pacf(x,par1,main='Partial Autocorrelation',xlab='lags',ylab='PACF',sub=mysub)
dev.off()
(myacf <- c(racf$acf))
(mypacf <- c(rpacf$acf))
lengthx <- length(x)
sqrtn <- sqrt(lengthx)
load(file='createtable')
a<-table.start()
a<-table.row.start(a)
a<-table.element(a,'Autocorrelation Function',4,TRUE)
a<-table.row.end(a)
a<-table.row.start(a)
a<-table.element(a,'Time lag k',header=TRUE)
a<-table.element(a,'ACF(k)',header=TRUE)
a<-table.element(a,'T-STAT',header=TRUE)
a<-table.element(a,'P-value',header=TRUE)
a<-table.row.end(a)
for (i in 2:(par1+1)) {
a<-table.row.start(a)
a<-table.element(a,i-1,header=TRUE)
a<-table.element(a,round(myacf[i],6))
mytstat <- myacf[i]*sqrtn
a<-table.element(a,round(mytstat,4))
a<-table.element(a,round(1-pt(abs(mytstat),lengthx),6))
a<-table.row.end(a)
}
a<-table.end(a)
table.save(a,file='mytable.tab')
a<-table.start()
a<-table.row.start(a)
a<-table.element(a,'Partial Autocorrelation Function',4,TRUE)
a<-table.row.end(a)
a<-table.row.start(a)
a<-table.element(a,'Time lag k',header=TRUE)
a<-table.element(a,'PACF(k)',header=TRUE)
a<-table.element(a,'T-STAT',header=TRUE)
a<-table.element(a,'P-value',header=TRUE)
a<-table.row.end(a)
for (i in 1:par1) {
a<-table.row.start(a)
a<-table.element(a,i,header=TRUE)
a<-table.element(a,round(mypacf[i],6))
mytstat <- mypacf[i]*sqrtn
a<-table.element(a,round(mytstat,4))
a<-table.element(a,round(1-pt(abs(mytstat),lengthx),6))
a<-table.row.end(a)
}
a<-table.end(a)
table.save(a,file='mytable1.tab')