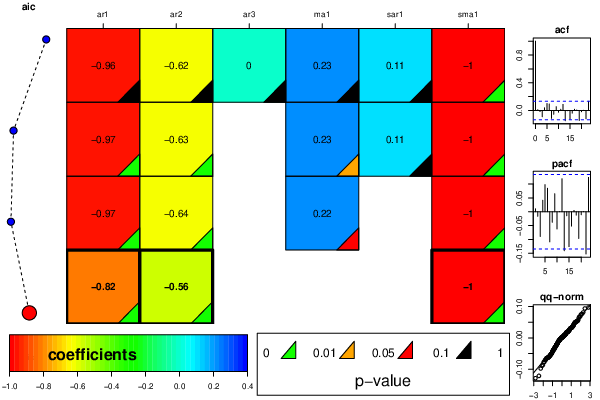
| ARIMA Parameter Estimation and Backward Selection | ||||||
| Iteration | ar1 | ar2 | ar3 | ma1 | sar1 | sma1 |
| Estimates ( 1 ) | -0.9646 | -0.6232 | 0.0021 | 0.2285 | 0.1058 | -1 |
| (p-val) | (0.3769 ) | (0.5059 ) | (0.9975 ) | (0.8235 ) | (0.1815 ) | (0 ) |
| Estimates ( 2 ) | -0.968 | -0.6262 | 0 | 0.2317 | 0.1058 | -1 |
| (p-val) | (0 ) | (0 ) | (NA ) | (0.0455 ) | (0.1791 ) | (0 ) |
| Estimates ( 3 ) | -0.9695 | -0.6351 | 0 | 0.2183 | 0 | -1 |
| (p-val) | (0 ) | (0 ) | (NA ) | (0.0518 ) | (NA ) | (0 ) |
| Estimates ( 4 ) | -0.8232 | -0.5579 | 0 | 0 | 0 | -1 |
| (p-val) | (0 ) | (0 ) | (NA ) | (NA ) | (NA ) | (0 ) |
| Estimates ( 5 ) | NA | NA | NA | NA | NA | NA |
| (p-val) | (NA ) | (NA ) | (NA ) | (NA ) | (NA ) | (NA ) |
| Estimates ( 6 ) | NA | NA | NA | NA | NA | NA |
| (p-val) | (NA ) | (NA ) | (NA ) | (NA ) | (NA ) | (NA ) |
| Estimates ( 7 ) | NA | NA | NA | NA | NA | NA |
| (p-val) | (NA ) | (NA ) | (NA ) | (NA ) | (NA ) | (NA ) |
| Estimates ( 8 ) | NA | NA | NA | NA | NA | NA |
| (p-val) | (NA ) | (NA ) | (NA ) | (NA ) | (NA ) | (NA ) |
| Estimates ( 9 ) | NA | NA | NA | NA | NA | NA |
| (p-val) | (NA ) | (NA ) | (NA ) | (NA ) | (NA ) | (NA ) |
| Estimates ( 10 ) | NA | NA | NA | NA | NA | NA |
| (p-val) | (NA ) | (NA ) | (NA ) | (NA ) | (NA ) | (NA ) |
| Estimates ( 11 ) | NA | NA | NA | NA | NA | NA |
| (p-val) | (NA ) | (NA ) | (NA ) | (NA ) | (NA ) | (NA ) |
| Menu of Residual Diagnostics | |
| Description | Link |
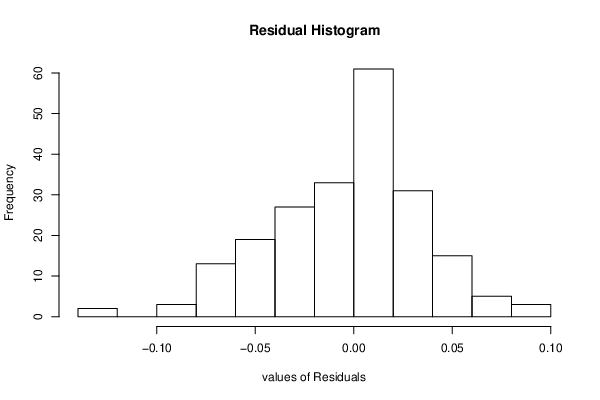
| Histogram | Compute |
| Central Tendency | Compute |
| QQ Plot | Compute |
| Kernel Density Plot | Compute |
| Skewness/Kurtosis Test | Compute |
| Skewness-Kurtosis Plot | Compute |
| Harrell-Davis Plot | Compute |
| Bootstrap Plot -- Central Tendency | Compute |
| Blocked Bootstrap Plot -- Central Tendency | Compute |
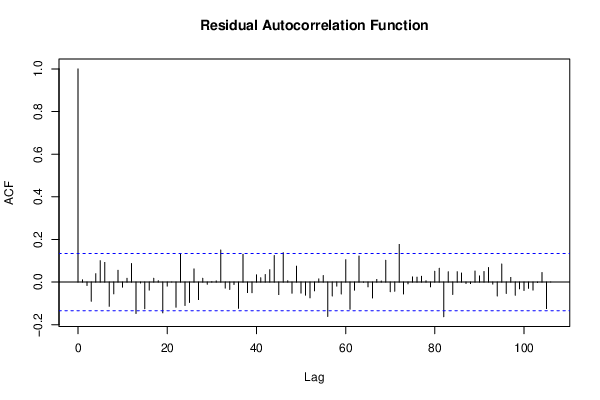
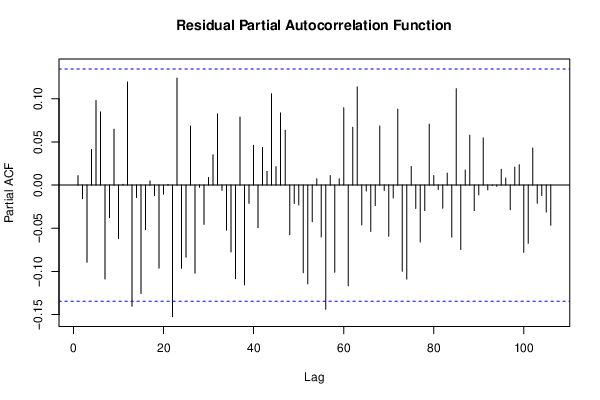
| (Partial) Autocorrelation Plot | Compute |
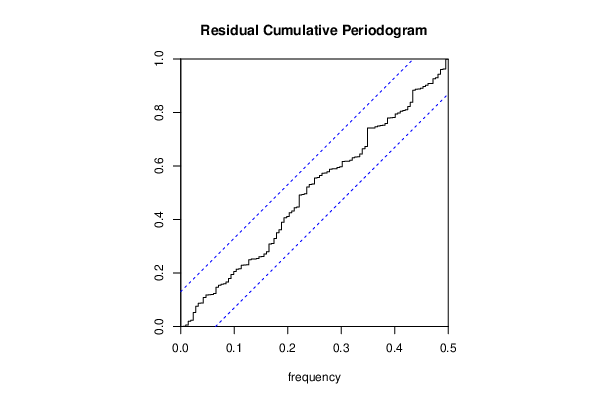
| Spectral Analysis | Compute |
| Tukey lambda PPCC Plot | Compute |
| Box-Cox Normality Plot | Compute |
| Summary Statistics | Compute |