| Tabulation of Results | ||
| groupB x genderB | ||
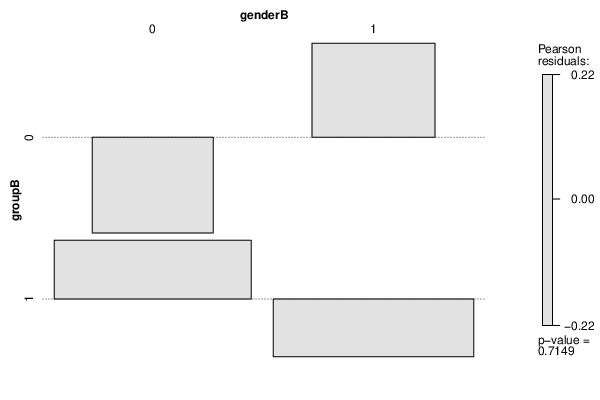
| 0 | 1 | 0 | 23 | 26 | 1 | 65 | 65 |
| Tabulation of Expected Results | ||
| groupB x genderB | ||
| 0 | 1 | 0 | 24.09 | 24.91 | 1 | 63.91 | 66.09 |
| Statistical Results | |
| Pearson's Chi-squared test with Yates' continuity correction | |
| Pearson Chi Square Statistic | 0.04 |
| Degrees of Freedom | 1 |
| P value | 0.84 |