| Multiple Linear Regression - Estimated Regression Equation |
| barrels_purchased[t] = + 461011 -8115.59cpi[t] + 7537.62M1[t] -16386.8M2[t] + 2249.84M3[t] + 9045.05M4[t] + 15645.9M5[t] + 18499.3M6[t] + 20494.1M7[t] + 25074.1M8[t] + 13383.9M9[t] + 16831.8M10[t] + 5014.51M11[t] + 3647.52t + e[t] |
| Multiple Linear Regression - Ordinary Least Squares | |||||
| Variable | Parameter | S.D. | T-STAT H0: parameter = 0 | 2-tail p-value | 1-tail p-value |
| (Intercept) | +4.61e+05 | 1.726e+04 | +2.6700e+01 | 2.007e-91 | 1.004e-91 |
| cpi | -8116 | 368.5 | -2.2020e+01 | 2.671e-71 | 1.336e-71 |
| M1 | +7538 | 6298 | +1.1970e+00 | 0.2321 | 0.116 |
| M2 | -1.639e+04 | 6298 | -2.6020e+00 | 0.009614 | 0.004807 |
| M3 | +2250 | 6300 | +3.5710e-01 | 0.7212 | 0.3606 |
| M4 | +9045 | 6301 | +1.4350e+00 | 0.1519 | 0.07596 |
| M5 | +1.565e+04 | 6301 | +2.4830e+00 | 0.01343 | 0.006716 |
| M6 | +1.85e+04 | 6302 | +2.9360e+00 | 0.003518 | 0.001759 |
| M7 | +2.049e+04 | 6300 | +3.2530e+00 | 0.001238 | 0.0006192 |
| M8 | +2.507e+04 | 6300 | +3.9800e+00 | 8.174e-05 | 4.087e-05 |
| M9 | +1.338e+04 | 6302 | +2.1240e+00 | 0.0343 | 0.01715 |
| M10 | +1.683e+04 | 6301 | +2.6710e+00 | 0.007862 | 0.003931 |
| M11 | +5014 | 6298 | +7.9610e-01 | 0.4264 | 0.2132 |
| t | +3648 | 143.9 | +2.5340e+01 | 1.195e-85 | 5.975e-86 |
| Multiple Linear Regression - Regression Statistics | |
| Multiple R | 0.9312 |
| R-squared | 0.8672 |
| Adjusted R-squared | 0.8629 |
| F-TEST (value) | 203.9 |
| F-TEST (DF numerator) | 13 |
| F-TEST (DF denominator) | 406 |
| p-value | 0 |
| Multiple Linear Regression - Residual Statistics | |
| Residual Standard Deviation | 2.634e+04 |
| Sum Squared Residuals | 2.817e+11 |
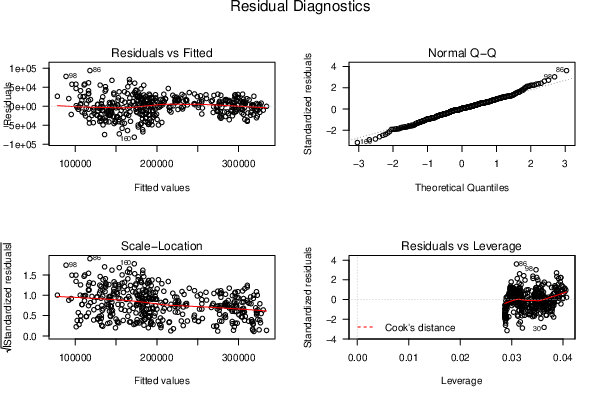
| Menu of Residual Diagnostics | |
| Description | Link |
| Histogram | Compute |
| Central Tendency | Compute |
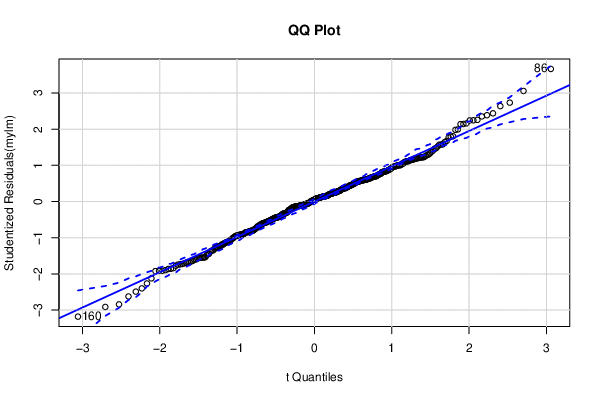
| QQ Plot | Compute |
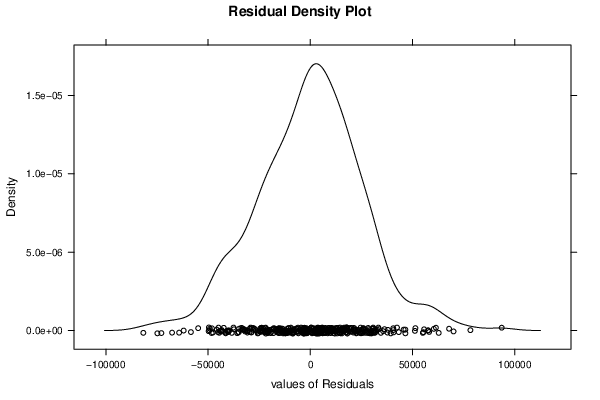
| Kernel Density Plot | Compute |
| Skewness/Kurtosis Test | Compute |
| Skewness-Kurtosis Plot | Compute |
| Harrell-Davis Plot | Compute |
| Bootstrap Plot -- Central Tendency | Compute |
| Blocked Bootstrap Plot -- Central Tendency | Compute |
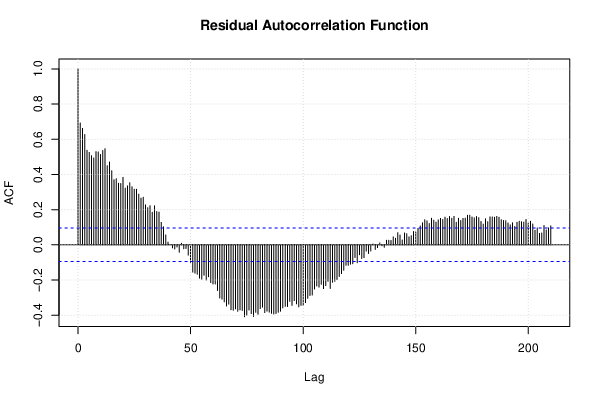
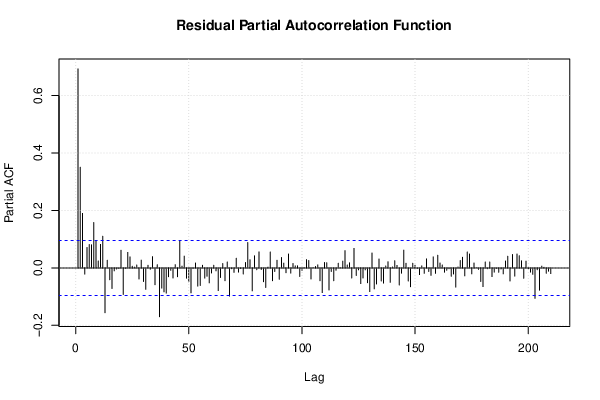
| (Partial) Autocorrelation Plot | Compute |
| Spectral Analysis | Compute |
| Tukey lambda PPCC Plot | Compute |
| Box-Cox Normality Plot | Compute |
| Summary Statistics | Compute |
| Ramsey RESET F-Test for powers (2 and 3) of fitted values |
> reset_test_fitted RESET test data: mylm RESET = 14.391, df1 = 2, df2 = 404, p-value = 9.178e-07 |
| Ramsey RESET F-Test for powers (2 and 3) of regressors |
> reset_test_regressors RESET test data: mylm RESET = 1.091, df1 = 26, df2 = 380, p-value = 0.3482 |
| Ramsey RESET F-Test for powers (2 and 3) of principal components |
> reset_test_principal_components RESET test data: mylm RESET = 3.1221, df1 = 2, df2 = 404, p-value = 0.04513 |
| Variance Inflation Factors (Multicollinearity) |
> vif
       cpi         M1         M2         M3         M4         M5         M6
184.313785   1.833981   1.834152   1.834923   1.835689   1.835834   1.836092
        M7         M8         M9        M10        M11          t
  1.835386   1.835392   1.836357   1.835805   1.834183 184.303778
|