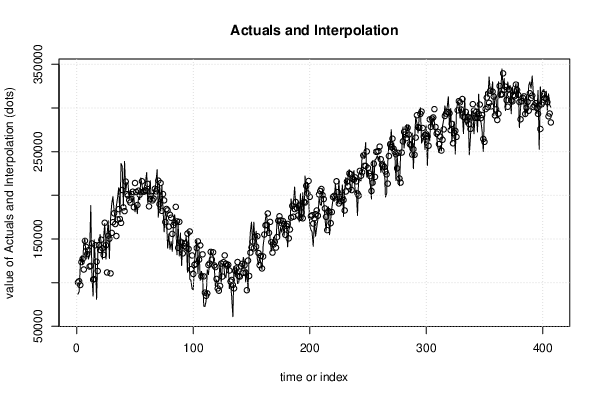
| Multiple Linear Regression - Estimated Regression Equation |
| barrels_purchased[t] = + 7323.02 -381.068unit_price[t] + 108.332cpi[t] + 0.528378`barrels_purchased(t-1)`[t] + 0.424374`barrels_purchased(t-1s)`[t] + e[t] |
| Multiple Linear Regression - Ordinary Least Squares | |||||
| Variable | Parameter | S.D. | T-STAT H0: parameter = 0 | 2-tail p-value | 1-tail p-value |
| (Intercept) | +7323 | 3140 | +2.3320e+00 | 0.0202 | 0.0101 |
| unit_price | -381.1 | 88.32 | -4.3150e+00 | 2.014e-05 | 1.007e-05 |
| cpi | +108.3 | 36.9 | +2.9360e+00 | 0.003519 | 0.00176 |
| `barrels_purchased(t-1)` | +0.5284 | 0.03731 | +1.4160e+01 | 3.248e-37 | 1.624e-37 |
| `barrels_purchased(t-1s)` | +0.4244 | 0.03832 | +1.1070e+01 | 4.679e-25 | 2.339e-25 |
| Multiple Linear Regression - Regression Statistics | |
| Multiple R | 0.9619 |
| R-squared | 0.9252 |
| Adjusted R-squared | 0.9245 |
| F-TEST (value) | 1243 |
| F-TEST (DF numerator) | 4 |
| F-TEST (DF denominator) | 402 |
| p-value | 0 |
| Multiple Linear Regression - Residual Statistics | |
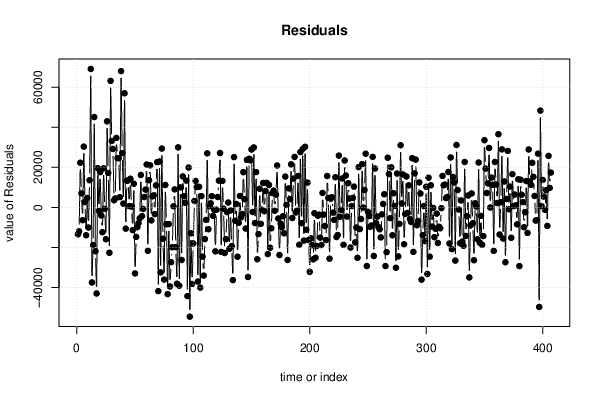
| Residual Standard Deviation | 1.932e+04 |
| Sum Squared Residuals | 1.501e+11 |
| Menu of Residual Diagnostics | |
| Description | Link |
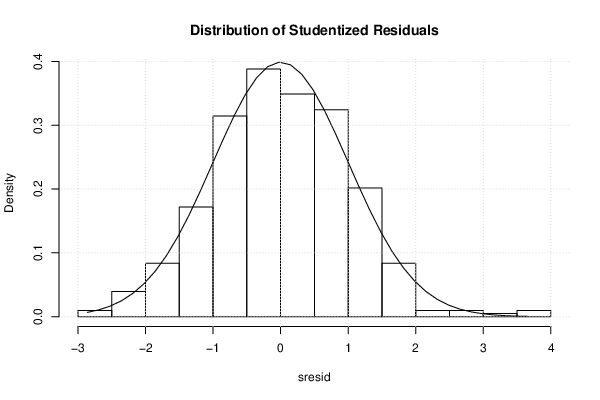
| Histogram | Compute |
| Central Tendency | Compute |
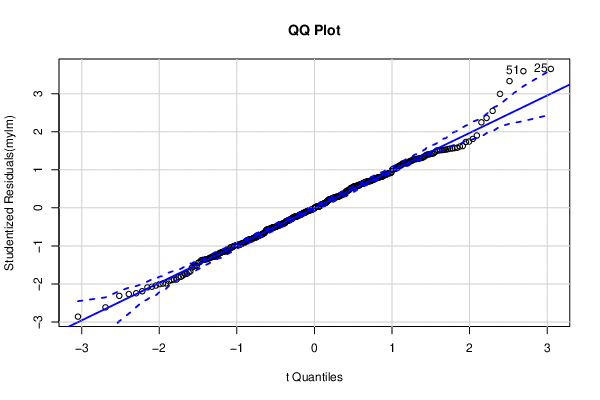
| QQ Plot | Compute |
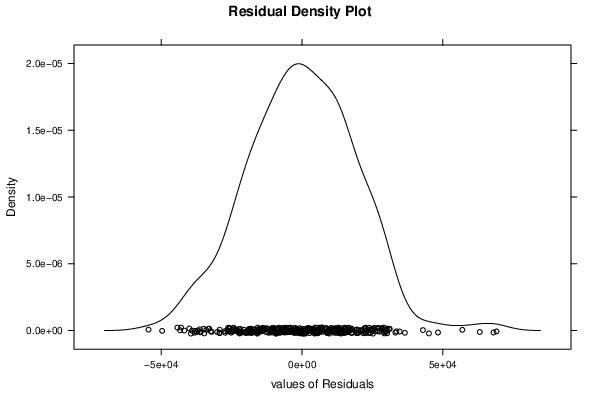
| Kernel Density Plot | Compute |
| Skewness/Kurtosis Test | Compute |
| Skewness-Kurtosis Plot | Compute |
| Harrell-Davis Plot | Compute |
| Bootstrap Plot -- Central Tendency | Compute |
| Blocked Bootstrap Plot -- Central Tendency | Compute |
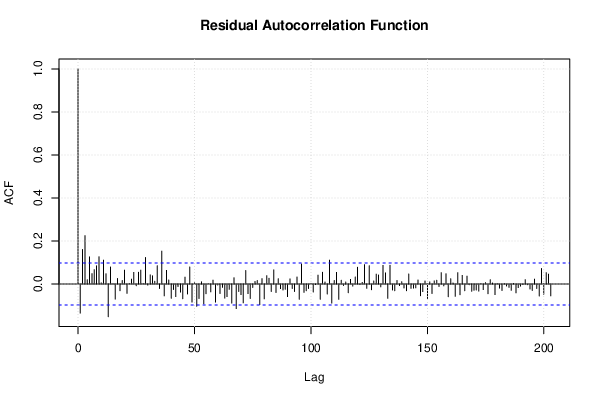
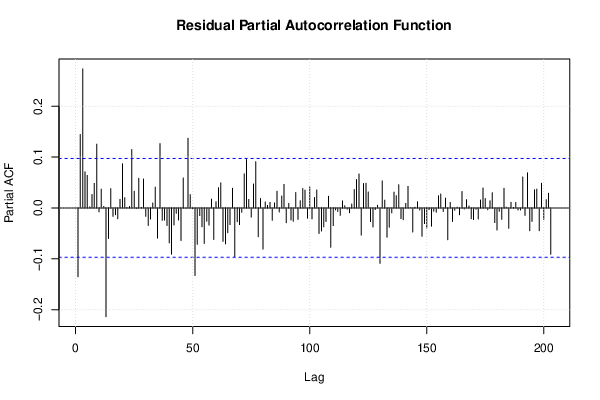
| (Partial) Autocorrelation Plot | Compute |
| Spectral Analysis | Compute |
| Tukey lambda PPCC Plot | Compute |
| Box-Cox Normality Plot | Compute |
| Summary Statistics | Compute |
| Ramsey RESET F-Test for powers (2 and 3) of fitted values |
> reset_test_fitted RESET test data: mylm RESET = 1.7122, df1 = 2, df2 = 400, p-value = 0.1818 |
| Ramsey RESET F-Test for powers (2 and 3) of regressors |
> reset_test_regressors RESET test data: mylm RESET = 7.8458, df1 = 8, df2 = 394, p-value = 8.46e-10 |
| Ramsey RESET F-Test for powers (2 and 3) of principal components |
> reset_test_principal_components RESET test data: mylm RESET = 2.846, df1 = 2, df2 = 400, p-value = 0.05925 |
| Variance Inflation Factors (Multicollinearity) |
> vif
               unit_price                       cpi  `barrels_purchased(t-1)`
                 1.426005                  3.101454                  7.498729
`barrels_purchased(t-1s)`
                 7.785503
|