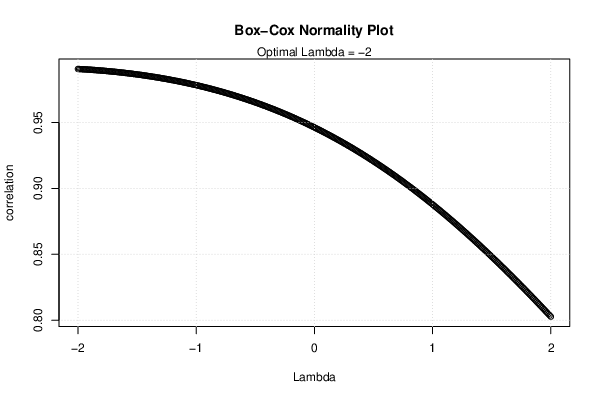
| Box-Cox Normality Plot | |
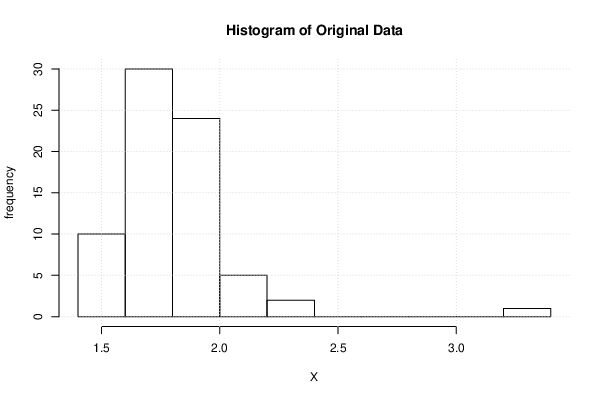
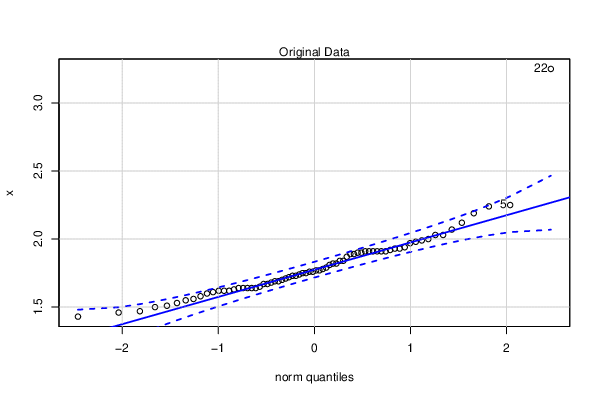
| # observations x | 72 |
| maximum correlation | 0.990733926889019 |
| optimal lambda | -2 |
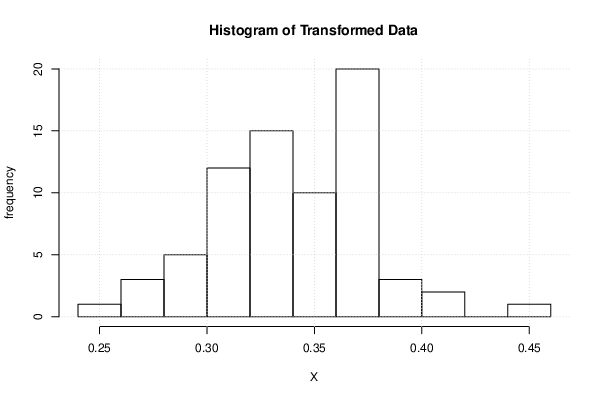
| transformation formula | for all lambda <> 0 : T(Y) = (Y^lambda - 1) / lambda |
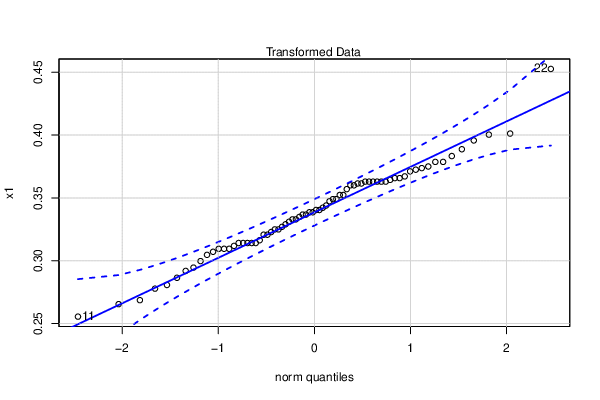
| Obs. | Original | Transformed |
| 1 | 1.63 | 0.311810756897136 |
| 2 | 1.64 | 0.314098750743605 |
| 3 | 1.58 | 0.299711584681942 |
| 4 | 1.98 | 0.372461993674115 |
| 5 | 2.25 | 0.401234567901235 |
| 6 | 1.46 | 0.265434415462563 |
| 7 | 1.84 | 0.352315689981096 |
| 8 | 2.03 | 0.378667281419107 |
| 9 | 2.19 | 0.395748629094473 |
| 10 | 1.67 | 0.320717845745634 |
| 11 | 1.43 | 0.255489265978776 |
| 12 | 1.47 | 0.268614928964783 |
| 13 | 1.91 | 0.362942353553905 |
| 14 | 1.91 | 0.362942353553905 |
| 15 | 2 | 0.375 |
| 16 | 1.73 | 0.332937953155802 |
| 17 | 1.91 | 0.362942353553905 |
| 18 | 1.89 | 0.36002631505277 |
| 19 | 1.53 | 0.28640693750267 |
| 20 | 1.65 | 0.316345270890725 |
| 21 | 1.51 | 0.280711372308232 |
| 22 | 3.25 | 0.452662721893491 |
| 23 | 1.87 | 0.357016214361291 |
| 24 | 1.55 | 0.291883454734651 |
| 25 | 1.64 | 0.314098750743605 |
| 26 | 1.56 | 0.294543063773833 |
| 27 | 1.68 | 0.322845804988662 |
| 28 | 1.73 | 0.332937953155802 |
| 29 | 2.07 | 0.3833111624542 |
| 30 | 2.24 | 0.400350765306122 |
| 31 | 1.91 | 0.362942353553905 |
| 32 | 1.72 | 0.33098972417523 |
| 33 | 2.03 | 0.378667281419107 |
| 34 | 1.5 | 0.277777777777778 |
| 35 | 1.61 | 0.307106207322248 |
| 36 | 1.76 | 0.338584710743802 |
| 37 | 1.79 | 0.343949939140476 |
| 38 | 1.76 | 0.338584710743802 |
| 39 | 1.75 | 0.336734693877551 |
| 40 | 1.9 | 0.361495844875346 |
| 41 | 1.93 | 0.365768208542511 |
| 42 | 1.92 | 0.364366319444444 |
| 43 | 1.91 | 0.362942353553905 |
| 44 | 1.71 | 0.329007215895489 |
| 45 | 1.69 | 0.324936101677112 |
| 46 | 1.64 | 0.314098750743605 |
| 47 | 1.7 | 0.326989619377163 |
| 48 | 1.62 | 0.309480262155159 |
| 49 | 1.64 | 0.314098750743605 |
| 50 | 1.62 | 0.309480262155159 |
| 51 | 1.62 | 0.309480262155159 |
| 52 | 2.12 | 0.38875044499822 |
| 53 | 1.78 | 0.342191642469385 |
| 54 | 1.99 | 0.373740562107018 |
| 55 | 1.9 | 0.361495844875346 |
| 56 | 1.64 | 0.314098750743605 |
| 57 | 1.94 | 0.367148474864491 |
| 58 | 1.84 | 0.352315689981096 |
| 59 | 1.6 | 0.3046875 |
| 60 | 1.67 | 0.320717845745634 |
| 61 | 1.75 | 0.336734693877551 |
| 62 | 1.77 | 0.340403460052986 |
| 63 | 1.93 | 0.365768208542511 |
| 64 | 1.77 | 0.340403460052986 |
| 65 | 1.82 | 0.349052046854245 |
| 66 | 1.97 | 0.371163905279703 |
| 67 | 1.89 | 0.36002631505277 |
| 68 | 1.74 | 0.33485268859823 |
| 69 | 1.82 | 0.349052046854245 |
| 70 | 1.69 | 0.324936101677112 |
| 71 | 1.81 | 0.347379506120082 |
| 72 | 1.91 | 0.362942353553905 |
| Maximum Likelihood Estimation of Lambda |
> summary(mypT)
bcPower Transformation to Normality
  Est Power Rounded Pwr Wald Lwr Bnd Wald Upr Bnd
x   -2.2888          -1      -3.6827      -0.8949
Likelihood ratio test that transformation parameter is equal to 0
 (log transformation)
                           LRT df       pval
LR test, lambda = (0) 13.46643  1 0.00024287
Likelihood ratio test that no transformation is needed
                           LRT df       pval
LR test, lambda = (1) 31.30519  1 2.2049e-08
|