| Pearson Product Moment Correlation - Ungrouped Data | ||
| Statistic | Variable X | Variable Y |
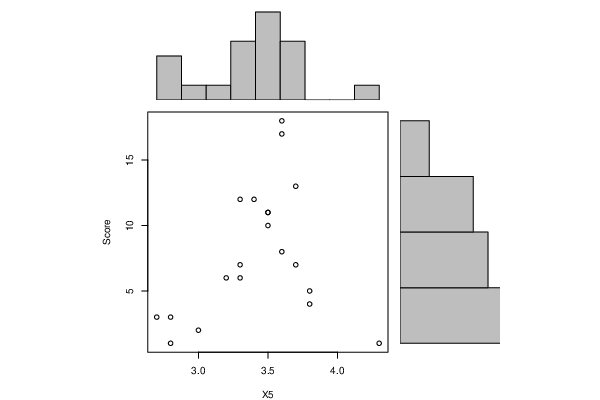
| Mean | 3.42 | 7.85 |
| Biased Variance | 0.1446 | 23.9275 |
| Biased Standard Deviation | 0.380263066836631 | 4.89157438868101 |
| Covariance | 0.534736842105263 | |
| Correlation | 0.273105787373561 | |
| Determination | 0.0745867710969326 | |
| T-Test | 1.204479198699 | |
| p-value (2 sided) | 0.244003623735134 | |
| p-value (1 sided) | 0.122001811867567 | |
| 95% CI of Correlation | [-0.192704266307775, 0.638464902289604] | |
| Degrees of Freedom | 18 | |
| Number of Observations | 20 | |
| Normality Tests |
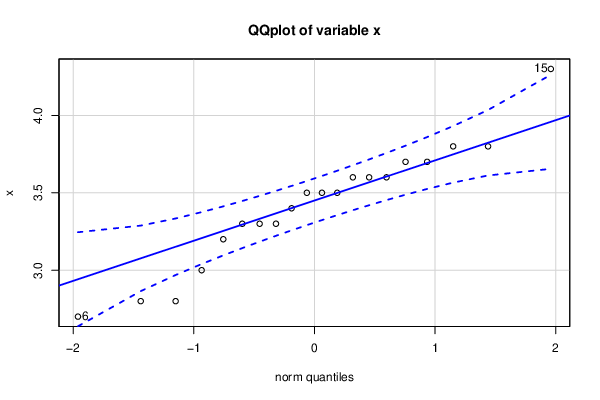
> jarque.x Jarque-Bera Normality Test data: x JB = 0.020236, p-value = 0.9899 alternative hypothesis: greater |
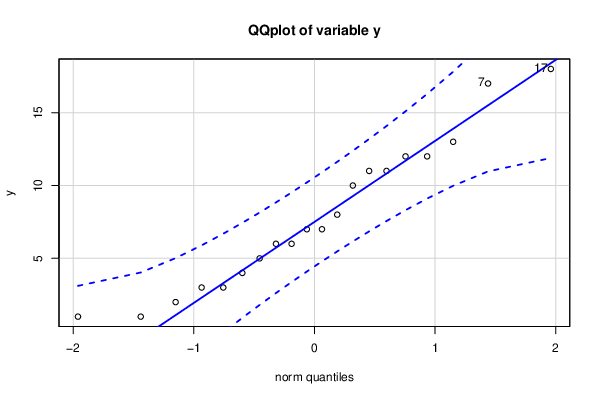
> jarque.y Jarque-Bera Normality Test data: y JB = 1.0361, p-value = 0.5957 alternative hypothesis: greater |
> ad.x Anderson-Darling normality test data: x A = 0.42074, p-value = 0.2934 |
> ad.y Anderson-Darling normality test data: y A = 0.31387, p-value = 0.5188 |