Free Statistics

of Irreproducible Research!

Author's title

Author*Unverified author*
R Software Modulerwasp_cross.wasp
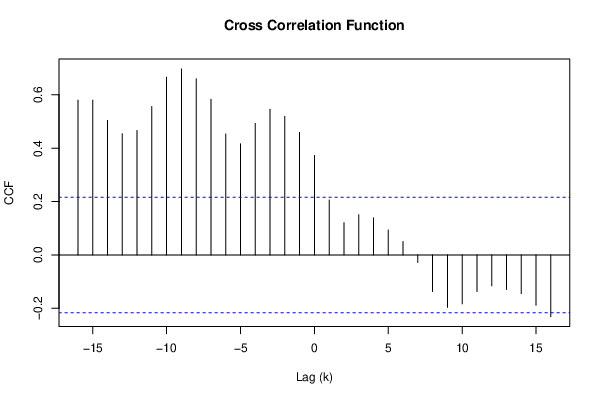
Title produced by softwareCross Correlation Function
Date of computationFri, 29 May 2020 19:48:06 +0200
Cite this page as followsStatistical Computations at FreeStatistics.org, Office for Research Development and Education, URL https://freestatistics.org/blog/index.php?v=date/2020/May/29/t1590774739bcd7k60fm3t72t6.htm/, Retrieved Thu, 25 Apr 2024 19:45:07 +0200
Statistical Computations at FreeStatistics.org, Office for Research Development and Education, URL https://freestatistics.org/blog/index.php?pk=, Retrieved Thu, 25 Apr 2024 19:45:07 +0200
QR Codes:

Original text written by user:
IsPrivate?This computation is/was private until 2020-12-31
User-defined keywords
Estimated Impact0
Dataseries X:
87
173
130
1169
2251
2078
2554
3896
390
693
10000
8355
5628
7143
6710
909
606
9740
6494
3983
4935
3636
216
216
6277
3117
2597
2857
2511
0
87
4372
2294
1255
1775
216
130
43
0
2251
1212
1515
1039
0
346
2251
1082
866
1342
519
87
0
1082
952
736
952
87
130
0
563
996
649
996
519
0
43
1039
1342
952
649
823
130
0
909
519
303
0
260
0
43
823
303
Dataseries Y:
180
188
346
265
492
578
1124
1341
1333
1751
2104
3022
4269
4317
6531
3629
3619
6033
5676
6248
9541
10000
9843
6837
6419
7101
8904
9827
9181
7115
5814
4691
6185
8125
7124
5677
4732
3465
3199
3084
3668
4248
5335
3356
2911
1908
2002
3166
3579
2697
2184
1813
1425
1665
2347
2120
1540
1284
1005
704
1233
1666
1829
1670
1062
801
1005
858
1337
1265
1044
786
587
920
776
1015
707
998
394
493
665
720


Summary of computational transaction
Raw Input view raw input (R code)
Raw Outputview raw output of R engine
Computing time0 seconds
R ServerBig Analytics Cloud Computing Center

\begin{tabular}{lllllllll}
\hline
Summary of computational transaction \tabularnewline
Raw Input view raw input (R code)  \tabularnewline
Raw Outputview raw output of R engine  \tabularnewline
Computing time0 seconds \tabularnewline
R ServerBig Analytics Cloud Computing Center \tabularnewline
\hline
\end{tabular}
%Source: https://freestatistics.org/blog/index.php?pk=&T=0

[TABLE]
[ROW]
Summary of computational transaction[/C][/ROW] [ROW]Raw Input[/C] view raw input (R code) [/C][/ROW] [ROW]Raw Output[/C]view raw output of R engine [/C][/ROW] [ROW]Computing time[/C]0 seconds[/C][/ROW] [ROW]R Server[/C]Big Analytics Cloud Computing Center[/C][/ROW] [/TABLE] Source: https://freestatistics.org/blog/index.php?pk=&T=0

Globally Unique Identifier (entire table): ba.freestatistics.org/blog/index.php?pk=&T=0

As an alternative you can also use a QR Code:  

The GUIDs for individual cells are displayed in the table below:

Summary of computational transaction
Raw Input view raw input (R code)
Raw Outputview raw output of R engine
Computing time0 seconds
R ServerBig Analytics Cloud Computing Center


Cross Correlation Function
ParameterValue
Box-Cox transformation parameter (lambda) of X series1
Degree of non-seasonal differencing (d) of X series0
Degree of seasonal differencing (D) of X series0
Seasonal Period (s)1
Box-Cox transformation parameter (lambda) of Y series1
Degree of non-seasonal differencing (d) of Y series0
Degree of seasonal differencing (D) of Y series0
krho(Y[t],X[t+k])
-160.580086884296583
-150.580017024423663
-140.504209321513071
-130.45475727924872
-120.466092837540858
-110.556219913170935
-100.666201504710004
-90.697176593633713
-80.660070874449004
-70.583154509393333
-60.45312030384054
-50.416603139506121
-40.493008533289075
-30.546134199578636
-20.519664582832478
-10.459305552670744
00.372580305078003
10.205562249961928
20.120893895226068
30.150755585642068
40.138951012119518
50.0933756037245823
60.0504195813757101
7-0.0283381255530779
8-0.136543409552155
9-0.19630561218524
10-0.183087534229423
11-0.136919519897529
12-0.115599858233531
13-0.129104803231496
14-0.144648887894824
15-0.188074338295871
16-0.231248821288643

\begin{tabular}{lllllllll}
\hline
Cross Correlation Function \tabularnewline
Parameter & Value \tabularnewline
Box-Cox transformation parameter (lambda) of X series & 1 \tabularnewline
Degree of non-seasonal differencing (d) of X series & 0 \tabularnewline
Degree of seasonal differencing (D) of X series & 0 \tabularnewline
Seasonal Period (s) & 1 \tabularnewline
Box-Cox transformation parameter (lambda) of Y series & 1 \tabularnewline
Degree of non-seasonal differencing (d) of Y series & 0 \tabularnewline
Degree of seasonal differencing (D) of Y series & 0 \tabularnewline
k & rho(Y[t],X[t+k]) \tabularnewline
-16 & 0.580086884296583 \tabularnewline
-15 & 0.580017024423663 \tabularnewline
-14 & 0.504209321513071 \tabularnewline
-13 & 0.45475727924872 \tabularnewline
-12 & 0.466092837540858 \tabularnewline
-11 & 0.556219913170935 \tabularnewline
-10 & 0.666201504710004 \tabularnewline
-9 & 0.697176593633713 \tabularnewline
-8 & 0.660070874449004 \tabularnewline
-7 & 0.583154509393333 \tabularnewline
-6 & 0.45312030384054 \tabularnewline
-5 & 0.416603139506121 \tabularnewline
-4 & 0.493008533289075 \tabularnewline
-3 & 0.546134199578636 \tabularnewline
-2 & 0.519664582832478 \tabularnewline
-1 & 0.459305552670744 \tabularnewline
0 & 0.372580305078003 \tabularnewline
1 & 0.205562249961928 \tabularnewline
2 & 0.120893895226068 \tabularnewline
3 & 0.150755585642068 \tabularnewline
4 & 0.138951012119518 \tabularnewline
5 & 0.0933756037245823 \tabularnewline
6 & 0.0504195813757101 \tabularnewline
7 & -0.0283381255530779 \tabularnewline
8 & -0.136543409552155 \tabularnewline
9 & -0.19630561218524 \tabularnewline
10 & -0.183087534229423 \tabularnewline
11 & -0.136919519897529 \tabularnewline
12 & -0.115599858233531 \tabularnewline
13 & -0.129104803231496 \tabularnewline
14 & -0.144648887894824 \tabularnewline
15 & -0.188074338295871 \tabularnewline
16 & -0.231248821288643 \tabularnewline
\hline
\end{tabular}
%Source: https://freestatistics.org/blog/index.php?pk=&T=1

[TABLE]
[ROW][C]Cross Correlation Function[/C][/ROW]
[ROW][C]Parameter[/C][C]Value[/C][/ROW]
[ROW][C]Box-Cox transformation parameter (lambda) of X series[/C][C]1[/C][/ROW]
[ROW][C]Degree of non-seasonal differencing (d) of X series[/C][C]0[/C][/ROW]
[ROW][C]Degree of seasonal differencing (D) of X series[/C][C]0[/C][/ROW]
[ROW][C]Seasonal Period (s)[/C][C]1[/C][/ROW]
[ROW][C]Box-Cox transformation parameter (lambda) of Y series[/C][C]1[/C][/ROW]
[ROW][C]Degree of non-seasonal differencing (d) of Y series[/C][C]0[/C][/ROW]
[ROW][C]Degree of seasonal differencing (D) of Y series[/C][C]0[/C][/ROW]
[ROW][C]k[/C][C]rho(Y[t],X[t+k])[/C][/ROW]
[ROW][C]-16[/C][C]0.580086884296583[/C][/ROW]
[ROW][C]-15[/C][C]0.580017024423663[/C][/ROW]
[ROW][C]-14[/C][C]0.504209321513071[/C][/ROW]
[ROW][C]-13[/C][C]0.45475727924872[/C][/ROW]
[ROW][C]-12[/C][C]0.466092837540858[/C][/ROW]
[ROW][C]-11[/C][C]0.556219913170935[/C][/ROW]
[ROW][C]-10[/C][C]0.666201504710004[/C][/ROW]
[ROW][C]-9[/C][C]0.697176593633713[/C][/ROW]
[ROW][C]-8[/C][C]0.660070874449004[/C][/ROW]
[ROW][C]-7[/C][C]0.583154509393333[/C][/ROW]
[ROW][C]-6[/C][C]0.45312030384054[/C][/ROW]
[ROW][C]-5[/C][C]0.416603139506121[/C][/ROW]
[ROW][C]-4[/C][C]0.493008533289075[/C][/ROW]
[ROW][C]-3[/C][C]0.546134199578636[/C][/ROW]
[ROW][C]-2[/C][C]0.519664582832478[/C][/ROW]
[ROW][C]-1[/C][C]0.459305552670744[/C][/ROW]
[ROW][C]0[/C][C]0.372580305078003[/C][/ROW]
[ROW][C]1[/C][C]0.205562249961928[/C][/ROW]
[ROW][C]2[/C][C]0.120893895226068[/C][/ROW]
[ROW][C]3[/C][C]0.150755585642068[/C][/ROW]
[ROW][C]4[/C][C]0.138951012119518[/C][/ROW]
[ROW][C]5[/C][C]0.0933756037245823[/C][/ROW]
[ROW][C]6[/C][C]0.0504195813757101[/C][/ROW]
[ROW][C]7[/C][C]-0.0283381255530779[/C][/ROW]
[ROW][C]8[/C][C]-0.136543409552155[/C][/ROW]
[ROW][C]9[/C][C]-0.19630561218524[/C][/ROW]
[ROW][C]10[/C][C]-0.183087534229423[/C][/ROW]
[ROW][C]11[/C][C]-0.136919519897529[/C][/ROW]
[ROW][C]12[/C][C]-0.115599858233531[/C][/ROW]
[ROW][C]13[/C][C]-0.129104803231496[/C][/ROW]
[ROW][C]14[/C][C]-0.144648887894824[/C][/ROW]
[ROW][C]15[/C][C]-0.188074338295871[/C][/ROW]
[ROW][C]16[/C][C]-0.231248821288643[/C][/ROW]
[/TABLE]
Source: https://freestatistics.org/blog/index.php?pk=&T=1

Globally Unique Identifier (entire table): ba.freestatistics.org/blog/index.php?pk=&T=1

As an alternative you can also use a QR Code:  

The GUIDs for individual cells are displayed in the table below:

Cross Correlation Function
ParameterValue
Box-Cox transformation parameter (lambda) of X series1
Degree of non-seasonal differencing (d) of X series0
Degree of seasonal differencing (D) of X series0
Seasonal Period (s)1
Box-Cox transformation parameter (lambda) of Y series1
Degree of non-seasonal differencing (d) of Y series0
Degree of seasonal differencing (D) of Y series0
krho(Y[t],X[t+k])
-160.580086884296583
-150.580017024423663
-140.504209321513071
-130.45475727924872
-120.466092837540858
-110.556219913170935
-100.666201504710004
-90.697176593633713
-80.660070874449004
-70.583154509393333
-60.45312030384054
-50.416603139506121
-40.493008533289075
-30.546134199578636
-20.519664582832478
-10.459305552670744
00.372580305078003
10.205562249961928
20.120893895226068
30.150755585642068
40.138951012119518
50.0933756037245823
60.0504195813757101
7-0.0283381255530779
8-0.136543409552155
9-0.19630561218524
10-0.183087534229423
11-0.136919519897529
12-0.115599858233531
13-0.129104803231496
14-0.144648887894824
15-0.188074338295871
16-0.231248821288643


Parameters (Session):
par1 = 1 ; par2 = 0 ; par3 = 0 ; par4 = 1 ; par5 = 1 ; par6 = 0 ; par7 = 0 ; par8 = na.fail ;
Parameters (R input):
par1 = 1 ; par2 = 0 ; par3 = 0 ; par4 = 1 ; par5 = 1 ; par6 = 0 ; par7 = 0 ; par8 = na.fail ;
R code (references can be found in the software module):
par8 <- 'na.fail'
par7 <- '0'
par6 <- '0'
par5 <- '1'
par4 <- '1'
par3 <- '0'
par2 <- '0'
par1 <- '1'
par1 <- as.numeric(par1)
par2 <- as.numeric(par2)
par3 <- as.numeric(par3)
par4 <- as.numeric(par4)
par5 <- as.numeric(par5)
par6 <- as.numeric(par6)
par7 <- as.numeric(par7)
if (par8=='na.fail') par8 <- na.fail else par8 <- na.pass
ccf <- function (x, y, lag.max = NULL, type = c('correlation', 'covariance'), plot = TRUE, na.action = na.fail, ...) {
type <- match.arg(type)
if (is.matrix(x) || is.matrix(y))
stop('univariate time series only')
X <- na.action(ts.intersect(as.ts(x), as.ts(y)))
colnames(X) <- c(deparse(substitute(x))[1L], deparse(substitute(y))[1L])
acf.out <- acf(X, lag.max = lag.max, plot = FALSE, type = type, na.action=na.action)
lag <- c(rev(acf.out$lag[-1, 2, 1]), acf.out$lag[, 1, 2])
y <- c(rev(acf.out$acf[-1, 2, 1]), acf.out$acf[, 1, 2])
acf.out$acf <- array(y, dim = c(length(y), 1L, 1L))
acf.out$lag <- array(lag, dim = c(length(y), 1L, 1L))
acf.out$snames <- paste(acf.out$snames, collapse = ' & ')
if (plot) {
plot(acf.out, ...)
return(invisible(acf.out))
}
else return(acf.out)
}
if (par1 == 0) {
x <- log(x)
} else {
x <- (x ^ par1 - 1) / par1
}
if (par5 == 0) {
y <- log(y)
} else {
y <- (y ^ par5 - 1) / par5
}
if (par2 > 0) x <- diff(x,lag=1,difference=par2)
if (par6 > 0) y <- diff(y,lag=1,difference=par6)
if (par3 > 0) x <- diff(x,lag=par4,difference=par3)
if (par7 > 0) y <- diff(y,lag=par4,difference=par7)
print(x)
print(y)
bitmap(file='test1.png')
(r <- ccf(x,y,na.action=par8,main='Cross Correlation Function',ylab='CCF',xlab='Lag (k)'))
dev.off()
load(file='createtable')
a<-table.start()
a<-table.row.start(a)
a<-table.element(a,'Cross Correlation Function',2,TRUE)
a<-table.row.end(a)
a<-table.row.start(a)
a<-table.element(a,'Parameter',header=TRUE)
a<-table.element(a,'Value',header=TRUE)
a<-table.row.end(a)
a<-table.row.start(a)
a<-table.element(a,'Box-Cox transformation parameter (lambda) of X series',header=TRUE)
a<-table.element(a,par1)
a<-table.row.end(a)
a<-table.row.start(a)
a<-table.element(a,'Degree of non-seasonal differencing (d) of X series',header=TRUE)
a<-table.element(a,par2)
a<-table.row.end(a)
a<-table.row.start(a)
a<-table.element(a,'Degree of seasonal differencing (D) of X series',header=TRUE)
a<-table.element(a,par3)
a<-table.row.end(a)
a<-table.row.start(a)
a<-table.element(a,'Seasonal Period (s)',header=TRUE)
a<-table.element(a,par4)
a<-table.row.end(a)
a<-table.row.start(a)
a<-table.element(a,'Box-Cox transformation parameter (lambda) of Y series',header=TRUE)
a<-table.element(a,par5)
a<-table.row.end(a)
a<-table.row.start(a)
a<-table.element(a,'Degree of non-seasonal differencing (d) of Y series',header=TRUE)
a<-table.element(a,par6)
a<-table.row.end(a)
a<-table.row.start(a)
a<-table.element(a,'Degree of seasonal differencing (D) of Y series',header=TRUE)
a<-table.element(a,par7)
a<-table.row.end(a)
a<-table.row.start(a)
a<-table.element(a,'k',header=TRUE)
a<-table.element(a,'rho(Y[t],X[t+k])',header=TRUE)
a<-table.row.end(a)
mylength <- length(r$acf)
myhalf <- floor((mylength-1)/2)
for (i in 1:mylength) {
a<-table.row.start(a)
a<-table.element(a,i-myhalf-1,header=TRUE)
a<-table.element(a,r$acf[i])
a<-table.row.end(a)
}
a<-table.end(a)
table.save(a,file='mytable.tab')