| Multiple Linear Regression - Estimated Regression Equation |
| Rate[t] = + 3.65 + 0.15StatusDummy[t] + 4.45CurryDummy[t] -4.1Interaction[t] + e[t] |
| Multiple Linear Regression - Ordinary Least Squares | |||||
| Variable | Parameter | S.D. | T-STAT H0: parameter = 0 | 2-tail p-value | 1-tail p-value |
| (Intercept) | +3.65 | 0.3365 | +1.0850e+01 | 4.244e-17 | 2.122e-17 |
| StatusDummy | +0.15 | 0.4759 | +3.1520e-01 | 0.7535 | 0.3767 |
| CurryDummy | +4.45 | 0.4759 | +9.3510e+00 | 2.842e-14 | 1.421e-14 |
| Interaction | -4.1 | 0.673 | -6.0920e+00 | 4.248e-08 | 2.124e-08 |
| Multiple Linear Regression - Regression Statistics | |
| Multiple R | 0.7823 |
| R-squared | 0.612 |
| Adjusted R-squared | 0.5967 |
| F-TEST (value) | 39.96 |
| F-TEST (DF numerator) | 3 |
| F-TEST (DF denominator) | 76 |
| p-value | 1.332e-15 |
| Multiple Linear Regression - Residual Statistics | |
| Residual Standard Deviation | 1.505 |
| Sum Squared Residuals | 172.1 |
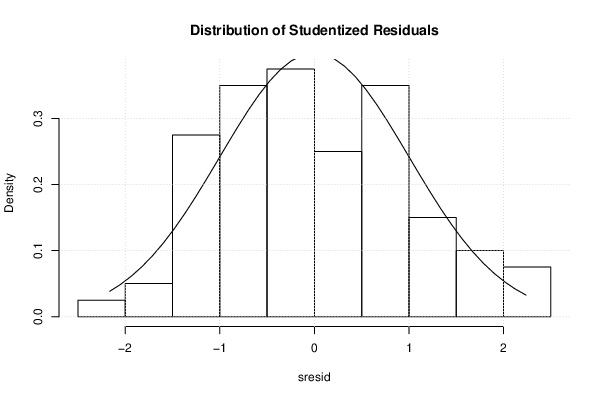
| Menu of Residual Diagnostics | |
| Description | Link |
| Histogram | Compute |
| Central Tendency | Compute |
| QQ Plot | Compute |
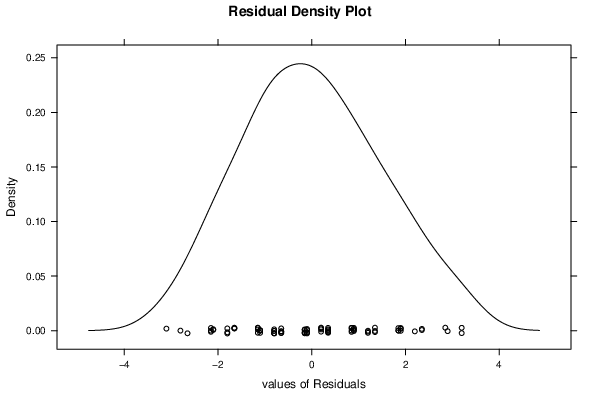
| Kernel Density Plot | Compute |
| Skewness/Kurtosis Test | Compute |
| Skewness-Kurtosis Plot | Compute |
| Harrell-Davis Plot | Compute |
| Bootstrap Plot -- Central Tendency | Compute |
| Blocked Bootstrap Plot -- Central Tendency | Compute |
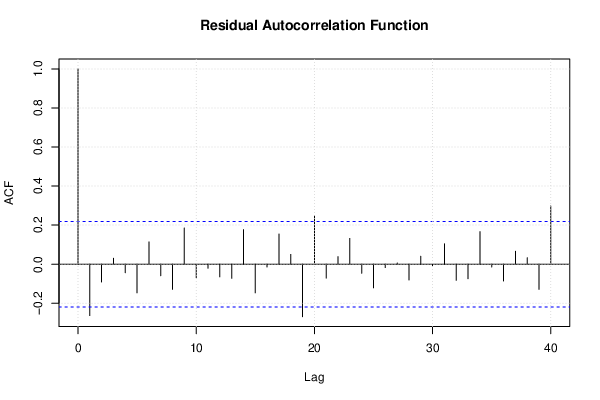
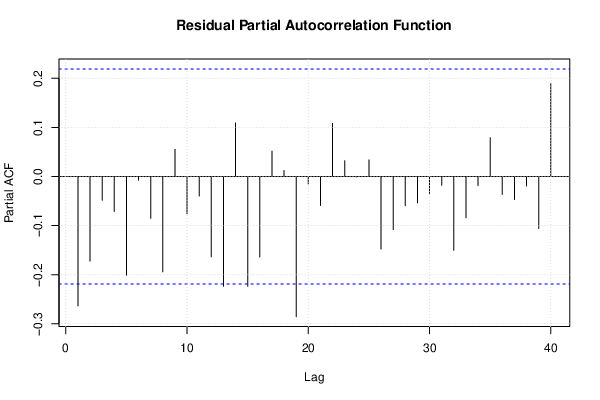
| (Partial) Autocorrelation Plot | Compute |
| Spectral Analysis | Compute |
| Tukey lambda PPCC Plot | Compute |
| Box-Cox Normality Plot | Compute |
| Summary Statistics | Compute |
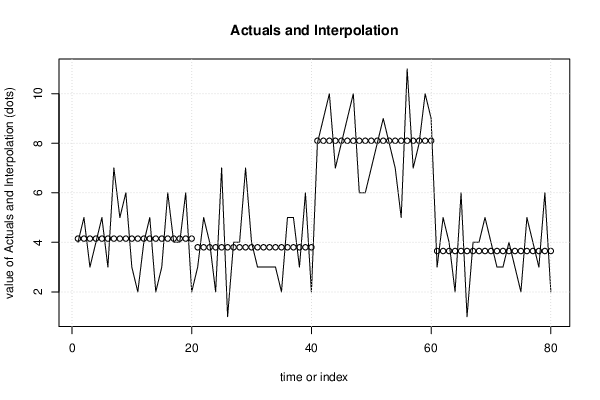
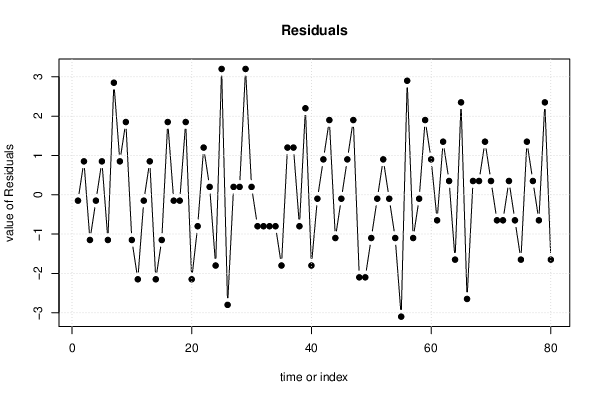
| Multiple Linear Regression - Actuals, Interpolation, and Residuals | |||
| Time or Index | Actuals | Interpolation Forecast | Residuals Prediction Error |
| 1 | 4 | 4.15 | -0.15 |
| 2 | 5 | 4.15 | 0.85 |
| 3 | 3 | 4.15 | -1.15 |
| 4 | 4 | 4.15 | -0.15 |
| 5 | 5 | 4.15 | 0.85 |
| 6 | 3 | 4.15 | -1.15 |
| 7 | 7 | 4.15 | 2.85 |
| 8 | 5 | 4.15 | 0.85 |
| 9 | 6 | 4.15 | 1.85 |
| 10 | 3 | 4.15 | -1.15 |
| 11 | 2 | 4.15 | -2.15 |
| 12 | 4 | 4.15 | -0.15 |
| 13 | 5 | 4.15 | 0.85 |
| 14 | 2 | 4.15 | -2.15 |
| 15 | 3 | 4.15 | -1.15 |
| 16 | 6 | 4.15 | 1.85 |
| 17 | 4 | 4.15 | -0.15 |
| 18 | 4 | 4.15 | -0.15 |
| 19 | 6 | 4.15 | 1.85 |
| 20 | 2 | 4.15 | -2.15 |
| 21 | 3 | 3.8 | -0.8 |
| 22 | 5 | 3.8 | 1.2 |
| 23 | 4 | 3.8 | 0.2 |
| 24 | 2 | 3.8 | -1.8 |
| 25 | 7 | 3.8 | 3.2 |
| 26 | 1 | 3.8 | -2.8 |
| 27 | 4 | 3.8 | 0.2 |
| 28 | 4 | 3.8 | 0.2 |
| 29 | 7 | 3.8 | 3.2 |
| 30 | 4 | 3.8 | 0.2 |
| 31 | 3 | 3.8 | -0.8 |
| 32 | 3 | 3.8 | -0.8 |
| 33 | 3 | 3.8 | -0.8 |
| 34 | 3 | 3.8 | -0.8 |
| 35 | 2 | 3.8 | -1.8 |
| 36 | 5 | 3.8 | 1.2 |
| 37 | 5 | 3.8 | 1.2 |
| 38 | 3 | 3.8 | -0.8 |
| 39 | 6 | 3.8 | 2.2 |
| 40 | 2 | 3.8 | -1.8 |
| 41 | 8 | 8.1 | -0.1 |
| 42 | 9 | 8.1 | 0.9 |
| 43 | 10 | 8.1 | 1.9 |
| 44 | 7 | 8.1 | -1.1 |
| 45 | 8 | 8.1 | -0.1 |
| 46 | 9 | 8.1 | 0.9 |
| 47 | 10 | 8.1 | 1.9 |
| 48 | 6 | 8.1 | -2.1 |
| 49 | 6 | 8.1 | -2.1 |
| 50 | 7 | 8.1 | -1.1 |
| 51 | 8 | 8.1 | -0.1 |
| 52 | 9 | 8.1 | 0.9 |
| 53 | 8 | 8.1 | -0.1 |
| 54 | 7 | 8.1 | -1.1 |
| 55 | 5 | 8.1 | -3.1 |
| 56 | 11 | 8.1 | 2.9 |
| 57 | 7 | 8.1 | -1.1 |
| 58 | 8 | 8.1 | -0.1 |
| 59 | 10 | 8.1 | 1.9 |
| 60 | 9 | 8.1 | 0.9 |
| 61 | 3 | 3.65 | -0.65 |
| 62 | 5 | 3.65 | 1.35 |
| 63 | 4 | 3.65 | 0.35 |
| 64 | 2 | 3.65 | -1.65 |
| 65 | 6 | 3.65 | 2.35 |
| 66 | 1 | 3.65 | -2.65 |
| 67 | 4 | 3.65 | 0.35 |
| 68 | 4 | 3.65 | 0.35 |
| 69 | 5 | 3.65 | 1.35 |
| 70 | 4 | 3.65 | 0.35 |
| 71 | 3 | 3.65 | -0.65 |
| 72 | 3 | 3.65 | -0.65 |
| 73 | 4 | 3.65 | 0.35 |
| 74 | 3 | 3.65 | -0.65 |
| 75 | 2 | 3.65 | -1.65 |
| 76 | 5 | 3.65 | 1.35 |
| 77 | 4 | 3.65 | 0.35 |
| 78 | 3 | 3.65 | -0.65 |
| 79 | 6 | 3.65 | 2.35 |
| 80 | 2 | 3.65 | -1.65 |
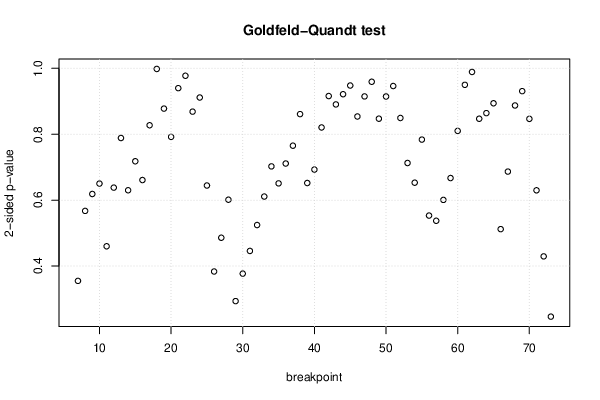
| Goldfeld-Quandt test for Heteroskedasticity | |||
| p-values | Alternative Hypothesis | ||
| breakpoint index | greater | 2-sided | less |
| 7 | 0.8225 | 0.3549 | 0.1775 |
| 8 | 0.7163 | 0.5673 | 0.2837 |
| 9 | 0.6907 | 0.6187 | 0.3093 |
| 10 | 0.6749 | 0.6502 | 0.3251 |
| 11 | 0.77 | 0.46 | 0.23 |
| 12 | 0.681 | 0.638 | 0.319 |
| 13 | 0.6057 | 0.7886 | 0.3943 |
| 14 | 0.685 | 0.63 | 0.315 |
| 15 | 0.641 | 0.718 | 0.359 |
| 16 | 0.6695 | 0.661 | 0.3305 |
| 17 | 0.5863 | 0.8273 | 0.4137 |
| 18 | 0.5009 | 0.9982 | 0.4991 |
| 19 | 0.5611 | 0.8779 | 0.4389 |
| 20 | 0.604 | 0.792 | 0.396 |
| 21 | 0.5301 | 0.9399 | 0.4699 |
| 22 | 0.5112 | 0.9775 | 0.4888 |
| 23 | 0.4343 | 0.8686 | 0.5657 |
| 24 | 0.4557 | 0.9115 | 0.5443 |
| 25 | 0.6778 | 0.6444 | 0.3222 |
| 26 | 0.8083 | 0.3834 | 0.1917 |
| 27 | 0.7571 | 0.4859 | 0.2429 |
| 28 | 0.6994 | 0.6013 | 0.3006 |
| 29 | 0.8532 | 0.2935 | 0.1468 |
| 30 | 0.8115 | 0.3769 | 0.1885 |
| 31 | 0.7771 | 0.4458 | 0.2229 |
| 32 | 0.7378 | 0.5244 | 0.2622 |
| 33 | 0.6946 | 0.6108 | 0.3054 |
| 34 | 0.6488 | 0.7024 | 0.3512 |
| 35 | 0.6746 | 0.6509 | 0.3254 |
| 36 | 0.6445 | 0.7111 | 0.3555 |
| 37 | 0.6174 | 0.7653 | 0.3826 |
| 38 | 0.5694 | 0.8611 | 0.4306 |
| 39 | 0.674 | 0.652 | 0.326 |
| 40 | 0.6536 | 0.6927 | 0.3464 |
| 41 | 0.5897 | 0.8206 | 0.4103 |
| 42 | 0.542 | 0.9159 | 0.458 |
| 43 | 0.5548 | 0.8905 | 0.4452 |
| 44 | 0.5392 | 0.9215 | 0.4608 |
| 45 | 0.4739 | 0.9479 | 0.5261 |
| 46 | 0.427 | 0.8539 | 0.573 |
| 47 | 0.4574 | 0.9148 | 0.5426 |
| 48 | 0.5204 | 0.9593 | 0.4796 |
| 49 | 0.5764 | 0.8472 | 0.4236 |
| 50 | 0.5427 | 0.9146 | 0.4573 |
| 51 | 0.4732 | 0.9463 | 0.5268 |
| 52 | 0.4247 | 0.8494 | 0.5753 |
| 53 | 0.3564 | 0.7127 | 0.6436 |
| 54 | 0.3265 | 0.653 | 0.6735 |
| 55 | 0.6081 | 0.7838 | 0.3919 |
| 56 | 0.7234 | 0.5532 | 0.2766 |
| 57 | 0.7313 | 0.5373 | 0.2687 |
| 58 | 0.6996 | 0.6007 | 0.3004 |
| 59 | 0.6665 | 0.6671 | 0.3335 |
| 60 | 0.5949 | 0.8101 | 0.4051 |
| 61 | 0.525 | 0.9499 | 0.475 |
| 62 | 0.5055 | 0.989 | 0.4945 |
| 63 | 0.4235 | 0.847 | 0.5765 |
| 64 | 0.4321 | 0.8641 | 0.5679 |
| 65 | 0.553 | 0.894 | 0.447 |
| 66 | 0.744 | 0.512 | 0.256 |
| 67 | 0.6567 | 0.6867 | 0.3433 |
| 68 | 0.5563 | 0.8873 | 0.4437 |
| 69 | 0.5346 | 0.9308 | 0.4654 |
| 70 | 0.4234 | 0.8467 | 0.5766 |
| 71 | 0.3149 | 0.6298 | 0.6851 |
| 72 | 0.2147 | 0.4293 | 0.7853 |
| 73 | 0.1232 | 0.2464 | 0.8768 |
| Meta Analysis of Goldfeld-Quandt test for Heteroskedasticity | |||
| Description | # significant tests | % significant tests | OK/NOK |
| 1% type I error level | 0 | 0 | OK |
| 5% type I error level | 0 | 0 | OK |
| 10% type I error level | 0 | 0 | OK |
| Ramsey RESET F-Test for powers (2 and 3) of fitted values |
> reset_test_fitted RESET test data: mylm RESET = 0, df1 = 2, df2 = 74, p-value = 1 |
| Ramsey RESET F-Test for powers (2 and 3) of regressors |
> reset_test_regressors RESET test data: mylm RESET = 0, df1 = 6, df2 = 70, p-value = 1 |
| Ramsey RESET F-Test for powers (2 and 3) of principal components |
> reset_test_principal_components RESET test data: mylm RESET = 0, df1 = 2, df2 = 74, p-value = 1 |
| Variance Inflation Factors (Multicollinearity) |
> vif
StatusDummy  CurryDummy Interaction
          2           2           3
|