| Multiple Linear Regression - Estimated Regression Equation |
| werkjarenhb[t] = + 4.67588 + 0.585209lto1[t] + 0.089438lto2[t] -0.639622lto3[t] -2.35412lto4[t] + 2.25776leeftijd[t] -0.0597828schooljaren[t] + e[t] |
| Multiple Linear Regression - Ordinary Least Squares | |||||
| Variable | Parameter | S.D. | T-STAT H0: parameter = 0 | 2-tail p-value | 1-tail p-value |
| (Intercept) | +4.676 | 5.797 | +8.0660e-01 | 0.4222 | 0.2111 |
| lto1 | +0.5852 | 1.024 | +5.7130e-01 | 0.5694 | 0.2847 |
| lto2 | +0.08944 | 1.196 | +7.4790e-02 | 0.9406 | 0.4703 |
| lto3 | -0.6396 | 0.9403 | -6.8030e-01 | 0.4983 | 0.2491 |
| lto4 | -2.354 | 0.9857 | -2.3880e+00 | 0.01923 | 0.009613 |
| leeftijd | +2.258 | 0.4087 | +5.5240e+00 | 3.815e-07 | 1.907e-07 |
| schooljaren | -0.05978 | 0.203 | -2.9450e-01 | 0.7691 | 0.3846 |
| Multiple Linear Regression - Regression Statistics | |
| Multiple R | 0.5821 |
| R-squared | 0.3389 |
| Adjusted R-squared | 0.2905 |
| F-TEST (value) | 7.006 |
| F-TEST (DF numerator) | 6 |
| F-TEST (DF denominator) | 82 |
| p-value | 4.866e-06 |
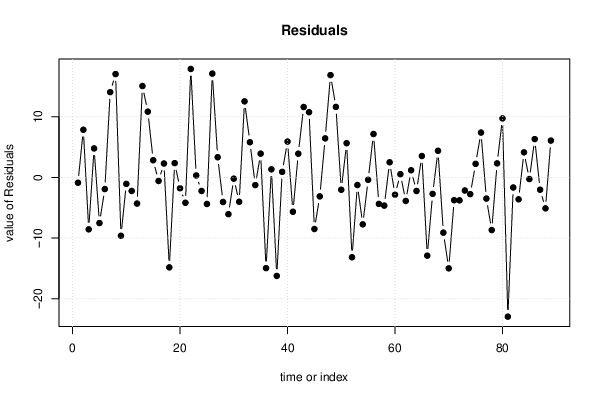
| Multiple Linear Regression - Residual Statistics | |
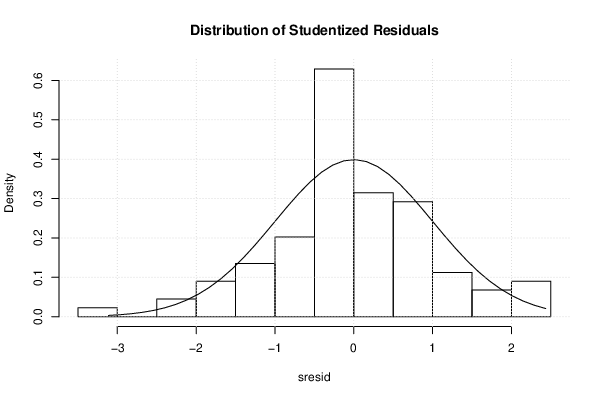
| Residual Standard Deviation | 8.259 |
| Sum Squared Residuals | 5593 |
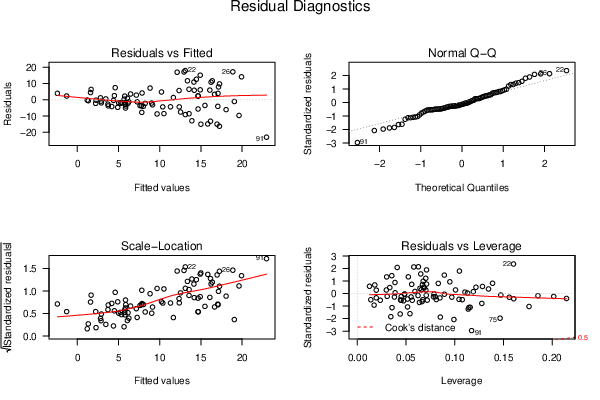
| Menu of Residual Diagnostics | |
| Description | Link |
| Histogram | Compute |
| Central Tendency | Compute |
| QQ Plot | Compute |
| Kernel Density Plot | Compute |
| Skewness/Kurtosis Test | Compute |
| Skewness-Kurtosis Plot | Compute |
| Harrell-Davis Plot | Compute |
| Bootstrap Plot -- Central Tendency | Compute |
| Blocked Bootstrap Plot -- Central Tendency | Compute |
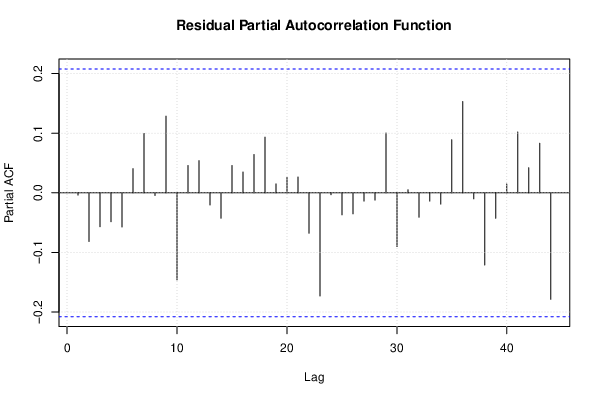
| (Partial) Autocorrelation Plot | Compute |
| Spectral Analysis | Compute |
| Tukey lambda PPCC Plot | Compute |
| Box-Cox Normality Plot | Compute |
| Summary Statistics | Compute |
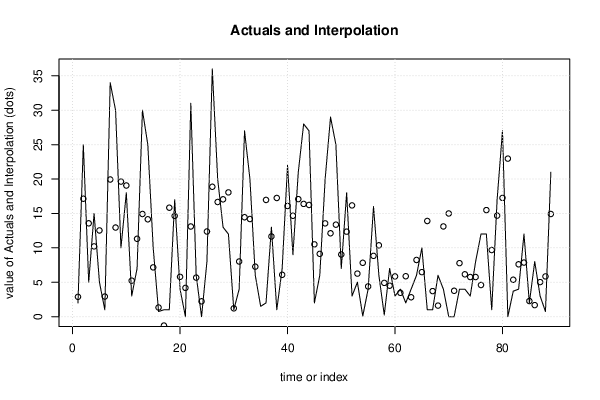
| Multiple Linear Regression - Actuals, Interpolation, and Residuals | |||
| Time or Index | Actuals | Interpolation Forecast | Residuals Prediction Error |
| 1 | 2 | 2.879 | -0.8787 |
| 2 | 25 | 17.14 | 7.862 |
| 3 | 5 | 13.56 | -8.564 |
| 4 | 15 | 10.21 | 4.786 |
| 5 | 5 | 12.53 | -7.531 |
| 6 | 1 | 2.92 | -1.92 |
| 7 | 34 | 19.93 | 14.07 |
| 8 | 30 | 12.95 | 17.05 |
| 9 | 10 | 19.63 | -9.629 |
| 10 | 18 | 19.06 | -1.06 |
| 11 | 3 | 5.233 | -2.233 |
| 12 | 7 | 11.31 | -4.312 |
| 13 | 30 | 14.92 | 15.08 |
| 14 | 25 | 14.15 | 10.85 |
| 15 | 10 | 7.162 | 2.838 |
| 16 | 0.75 | 1.332 | -0.582 |
| 17 | 1 | -1.296 | 2.296 |
| 18 | 1 | 15.83 | -14.83 |
| 19 | 17 | 14.65 | 2.354 |
| 20 | 4 | 5.788 | -1.788 |
| 21 | 0 | 4.182 | -4.182 |
| 22 | 31 | 13.1 | 17.9 |
| 23 | 6 | 5.674 | 0.3257 |
| 24 | 0 | 2.228 | -2.228 |
| 25 | 8 | 12.38 | -4.375 |
| 26 | 36 | 18.88 | 17.12 |
| 27 | 20 | 16.66 | 3.336 |
| 28 | 13 | 17.05 | -4.054 |
| 29 | 12 | 18.06 | -6.061 |
| 30 | 1 | 1.206 | -0.206 |
| 31 | 4 | 8.016 | -4.016 |
| 32 | 27 | 14.45 | 12.55 |
| 33 | 20 | 14.19 | 5.809 |
| 34 | 6 | 7.266 | -1.266 |
| 35 | 1.5 | -2.421 | 3.921 |
| 36 | 2 | 16.96 | -14.96 |
| 37 | 13 | 11.66 | 1.34 |
| 38 | 1 | 17.25 | -16.25 |
| 39 | 7 | 6.08 | 0.9201 |
| 40 | 22 | 16.09 | 5.915 |
| 41 | 9 | 14.66 | -5.659 |
| 42 | 21 | 17.08 | 3.917 |
| 43 | 28 | 16.38 | 11.62 |
| 44 | 27 | 16.23 | 10.77 |
| 45 | 2 | 10.51 | -8.511 |
| 46 | 6 | 9.127 | -3.127 |
| 47 | 20 | 13.56 | 6.441 |
| 48 | 29 | 12.12 | 16.88 |
| 49 | 25 | 13.37 | 11.63 |
| 50 | 7 | 9.03 | -2.03 |
| 51 | 18 | 12.35 | 5.648 |
| 52 | 3 | 16.17 | -13.17 |
| 53 | 5 | 6.255 | -1.255 |
| 54 | 0.08333 | 7.825 | -7.742 |
| 55 | 4 | 4.39 | -0.3905 |
| 56 | 16 | 8.835 | 7.165 |
| 57 | 6 | 10.37 | -4.37 |
| 58 | 0.25 | 4.903 | -4.653 |
| 59 | 7 | 4.499 | 2.501 |
| 60 | 3 | 5.848 | -2.848 |
| 61 | 4 | 3.464 | 0.5363 |
| 62 | 2 | 5.876 | -3.876 |
| 63 | 4 | 2.818 | 1.182 |
| 64 | 6 | 8.238 | -2.238 |
| 65 | 10 | 6.469 | 3.531 |
| 66 | 1 | 13.9 | -12.9 |
| 67 | 1 | 3.715 | -2.715 |
| 68 | 6 | 1.606 | 4.394 |
| 69 | 4 | 13.11 | -9.111 |
| 70 | 0 | 15 | -15 |
| 71 | 0 | 3.757 | -3.757 |
| 72 | 4 | 7.776 | -3.776 |
| 73 | 4 | 6.153 | -2.153 |
| 74 | 3 | 5.758 | -2.758 |
| 75 | 8 | 5.758 | 2.242 |
| 76 | 12 | 4.598 | 7.402 |
| 77 | 12 | 15.49 | -3.489 |
| 78 | 1 | 9.683 | -8.683 |
| 79 | 17 | 14.68 | 2.317 |
| 80 | 27 | 17.26 | 9.743 |
| 81 | 0 | 22.97 | -22.97 |
| 82 | 3.7 | 5.364 | -1.664 |
| 83 | 4 | 7.608 | -3.608 |
| 84 | 12 | 7.861 | 4.139 |
| 85 | 2 | 2.271 | -0.2705 |
| 86 | 8 | 1.677 | 6.323 |
| 87 | 3 | 5.024 | -2.024 |
| 88 | 0.75 | 5.849 | -5.099 |
| 89 | 21 | 14.92 | 6.079 |
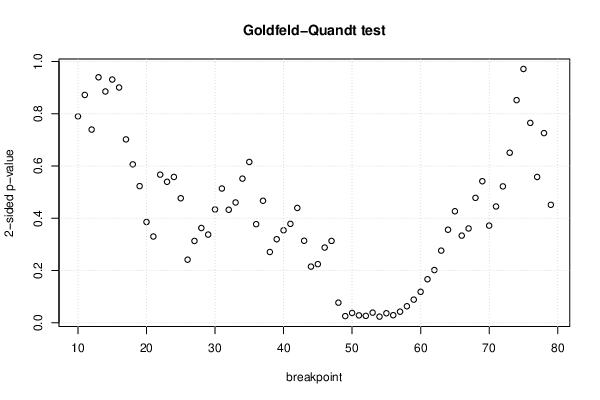
| Goldfeld-Quandt test for Heteroskedasticity | |||
| p-values | Alternative Hypothesis | ||
| breakpoint index | greater | 2-sided | less |
| 10 | 0.6049 | 0.7903 | 0.3951 |
| 11 | 0.4361 | 0.8722 | 0.5639 |
| 12 | 0.3699 | 0.7397 | 0.6301 |
| 13 | 0.5301 | 0.9398 | 0.4699 |
| 14 | 0.5573 | 0.8854 | 0.4427 |
| 15 | 0.5344 | 0.9311 | 0.4656 |
| 16 | 0.4503 | 0.9007 | 0.5497 |
| 17 | 0.351 | 0.702 | 0.649 |
| 18 | 0.3033 | 0.6066 | 0.6967 |
| 19 | 0.2616 | 0.5233 | 0.7384 |
| 20 | 0.193 | 0.3861 | 0.807 |
| 21 | 0.1652 | 0.3304 | 0.8348 |
| 22 | 0.7164 | 0.5671 | 0.2836 |
| 23 | 0.7301 | 0.5398 | 0.2699 |
| 24 | 0.7208 | 0.5584 | 0.2792 |
| 25 | 0.7616 | 0.4769 | 0.2384 |
| 26 | 0.8791 | 0.2418 | 0.1209 |
| 27 | 0.8433 | 0.3135 | 0.1567 |
| 28 | 0.8185 | 0.363 | 0.1815 |
| 29 | 0.8311 | 0.3379 | 0.1689 |
| 30 | 0.783 | 0.434 | 0.217 |
| 31 | 0.743 | 0.5141 | 0.257 |
| 32 | 0.7836 | 0.4328 | 0.2164 |
| 33 | 0.7696 | 0.4607 | 0.2304 |
| 34 | 0.7241 | 0.5519 | 0.2759 |
| 35 | 0.6921 | 0.6158 | 0.3079 |
| 36 | 0.8112 | 0.3777 | 0.1888 |
| 37 | 0.7664 | 0.4672 | 0.2336 |
| 38 | 0.8644 | 0.2712 | 0.1356 |
| 39 | 0.84 | 0.3201 | 0.16 |
| 40 | 0.8228 | 0.3543 | 0.1772 |
| 41 | 0.8105 | 0.3789 | 0.1895 |
| 42 | 0.7801 | 0.4397 | 0.2199 |
| 43 | 0.8429 | 0.3141 | 0.1571 |
| 44 | 0.8923 | 0.2153 | 0.1077 |
| 45 | 0.8876 | 0.2247 | 0.1124 |
| 46 | 0.8559 | 0.2881 | 0.1441 |
| 47 | 0.8432 | 0.3136 | 0.1568 |
| 48 | 0.9613 | 0.07731 | 0.03866 |
| 49 | 0.9871 | 0.02586 | 0.01293 |
| 50 | 0.9811 | 0.03789 | 0.01895 |
| 51 | 0.9856 | 0.02872 | 0.01436 |
| 52 | 0.9866 | 0.02673 | 0.01337 |
| 53 | 0.9805 | 0.0391 | 0.01955 |
| 54 | 0.9881 | 0.02378 | 0.01189 |
| 55 | 0.9816 | 0.03685 | 0.01843 |
| 56 | 0.9853 | 0.02939 | 0.01469 |
| 57 | 0.9786 | 0.04282 | 0.02141 |
| 58 | 0.9682 | 0.06358 | 0.03179 |
| 59 | 0.9555 | 0.08892 | 0.04446 |
| 60 | 0.9406 | 0.1188 | 0.0594 |
| 61 | 0.9165 | 0.167 | 0.08349 |
| 62 | 0.899 | 0.2021 | 0.101 |
| 63 | 0.8618 | 0.2764 | 0.1382 |
| 64 | 0.8218 | 0.3564 | 0.1782 |
| 65 | 0.7864 | 0.4272 | 0.2136 |
| 66 | 0.8331 | 0.3338 | 0.1669 |
| 67 | 0.8194 | 0.3612 | 0.1806 |
| 68 | 0.7608 | 0.4784 | 0.2392 |
| 69 | 0.729 | 0.542 | 0.271 |
| 70 | 0.8139 | 0.3721 | 0.1861 |
| 71 | 0.7773 | 0.4455 | 0.2227 |
| 72 | 0.7388 | 0.5223 | 0.2612 |
| 73 | 0.6745 | 0.6511 | 0.3255 |
| 74 | 0.5738 | 0.8523 | 0.4262 |
| 75 | 0.4858 | 0.9717 | 0.5142 |
| 76 | 0.3826 | 0.7653 | 0.6174 |
| 77 | 0.2792 | 0.5584 | 0.7208 |
| 78 | 0.3631 | 0.7262 | 0.6369 |
| 79 | 0.2258 | 0.4517 | 0.7742 |
| Meta Analysis of Goldfeld-Quandt test for Heteroskedasticity | |||
| Description | # significant tests | % significant tests | OK/NOK |
| 1% type I error level | 0 | 0 | OK |
| 5% type I error level | 9 | 0.128571 | NOK |
| 10% type I error level | 12 | 0.171429 | NOK |
| Ramsey RESET F-Test for powers (2 and 3) of fitted values |
> reset_test_fitted RESET test data: mylm RESET = 3.7937, df1 = 2, df2 = 80, p-value = 0.02666 |
| Ramsey RESET F-Test for powers (2 and 3) of regressors |
> reset_test_regressors RESET test data: mylm RESET = 1.3905, df1 = 12, df2 = 70, p-value = 0.1913 |
| Ramsey RESET F-Test for powers (2 and 3) of principal components |
> reset_test_principal_components RESET test data: mylm RESET = 0.052685, df1 = 2, df2 = 80, p-value = 0.9487 |
| Variance Inflation Factors (Multicollinearity) |
> vif
       lto1        lto2        lto3        lto4    leeftijd schooljaren
   1.071307    1.123786    1.085548    1.051206    1.156189    1.065262
|