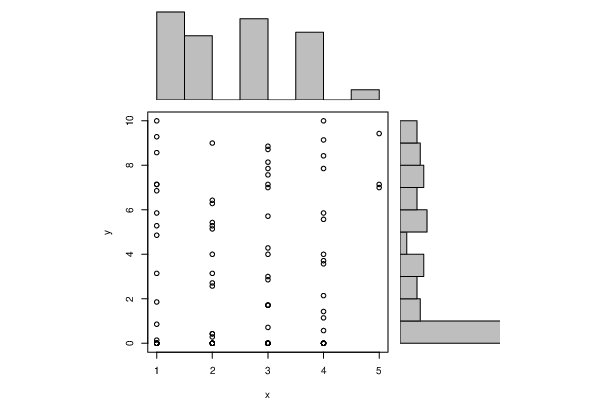
| Pearson Product Moment Correlation - Ungrouped Data | ||
| Statistic | Variable X | Variable Y |
| Mean | 2.51086956521739 | 3.15372670652174 |
| Biased Variance | 1.44553402646503 | 11.2432270188679 |
| Biased Standard Deviation | 1.20230363322458 | 3.35309215782506 |
| Covariance | 0.652156846082179 | |
| Correlation | 0.160009575570596 | |
| Determination | 0.0256030642742822 | |
| T-Test | 1.53779793432444 | |
| p-value (2 sided) | 0.127606494503546 | |
| p-value (1 sided) | 0.0638032472517732 | |
| 95% CI of Correlation | [-0.0463260606390274, 0.353250006859188] | |
| Degrees of Freedom | 90 | |
| Number of Observations | 92 | |
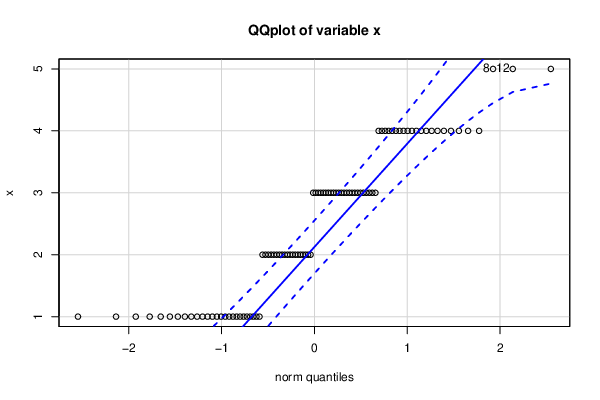
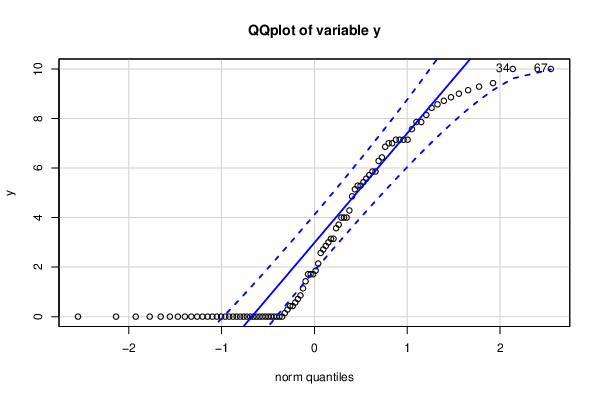
| Normality Tests |
> jarque.x Jarque-Bera Normality Test data: x JB = 5.5689, p-value = 0.06176 alternative hypothesis: greater |
> jarque.y Jarque-Bera Normality Test data: y JB = 10.251, p-value = 0.005944 alternative hypothesis: greater |
> ad.x Anderson-Darling normality test data: x A = 4.072, p-value = 3.289e-10 |
> ad.y Anderson-Darling normality test data: y A = 5.8158, p-value = 1.99e-14 |