Free Statistics
of Irreproducible Research!
Description of Statistical Computation | |||||||||||||||||||||||||||||||||||||||||||||||||||||||||||||||||||||||||||||||||||||||||||||||||||||||||||||||||||||||||||||||||||||||||||||||||||||||||||||||||||||||||||||||||||||||||||||||||||||||||||||||||||||||||||||||||||||||||||||||||||||||||||||||||||||||||||||||||||||||||||||||||||||||||||||||||||||||||||||||||||||
|---|---|---|---|---|---|---|---|---|---|---|---|---|---|---|---|---|---|---|---|---|---|---|---|---|---|---|---|---|---|---|---|---|---|---|---|---|---|---|---|---|---|---|---|---|---|---|---|---|---|---|---|---|---|---|---|---|---|---|---|---|---|---|---|---|---|---|---|---|---|---|---|---|---|---|---|---|---|---|---|---|---|---|---|---|---|---|---|---|---|---|---|---|---|---|---|---|---|---|---|---|---|---|---|---|---|---|---|---|---|---|---|---|---|---|---|---|---|---|---|---|---|---|---|---|---|---|---|---|---|---|---|---|---|---|---|---|---|---|---|---|---|---|---|---|---|---|---|---|---|---|---|---|---|---|---|---|---|---|---|---|---|---|---|---|---|---|---|---|---|---|---|---|---|---|---|---|---|---|---|---|---|---|---|---|---|---|---|---|---|---|---|---|---|---|---|---|---|---|---|---|---|---|---|---|---|---|---|---|---|---|---|---|---|---|---|---|---|---|---|---|---|---|---|---|---|---|---|---|---|---|---|---|---|---|---|---|---|---|---|---|---|---|---|---|---|---|---|---|---|---|---|---|---|---|---|---|---|---|---|---|---|---|---|---|---|---|---|---|---|---|---|---|---|---|---|---|---|---|---|---|---|---|---|---|---|---|---|---|---|---|---|---|---|---|---|---|---|---|---|---|---|---|---|---|---|---|---|---|---|---|---|---|---|---|---|---|---|---|---|---|---|---|---|---|---|
| Author's title | |||||||||||||||||||||||||||||||||||||||||||||||||||||||||||||||||||||||||||||||||||||||||||||||||||||||||||||||||||||||||||||||||||||||||||||||||||||||||||||||||||||||||||||||||||||||||||||||||||||||||||||||||||||||||||||||||||||||||||||||||||||||||||||||||||||||||||||||||||||||||||||||||||||||||||||||||||||||||||||||||||||
| Author | *The author of this computation has been verified* | ||||||||||||||||||||||||||||||||||||||||||||||||||||||||||||||||||||||||||||||||||||||||||||||||||||||||||||||||||||||||||||||||||||||||||||||||||||||||||||||||||||||||||||||||||||||||||||||||||||||||||||||||||||||||||||||||||||||||||||||||||||||||||||||||||||||||||||||||||||||||||||||||||||||||||||||||||||||||||||||||||||
| R Software Module | rwasp_autocorrelation.wasp | ||||||||||||||||||||||||||||||||||||||||||||||||||||||||||||||||||||||||||||||||||||||||||||||||||||||||||||||||||||||||||||||||||||||||||||||||||||||||||||||||||||||||||||||||||||||||||||||||||||||||||||||||||||||||||||||||||||||||||||||||||||||||||||||||||||||||||||||||||||||||||||||||||||||||||||||||||||||||||||||||||||
| Title produced by software | (Partial) Autocorrelation Function | ||||||||||||||||||||||||||||||||||||||||||||||||||||||||||||||||||||||||||||||||||||||||||||||||||||||||||||||||||||||||||||||||||||||||||||||||||||||||||||||||||||||||||||||||||||||||||||||||||||||||||||||||||||||||||||||||||||||||||||||||||||||||||||||||||||||||||||||||||||||||||||||||||||||||||||||||||||||||||||||||||||
| Date of computation | Fri, 24 Oct 2008 08:28:29 -0600 | ||||||||||||||||||||||||||||||||||||||||||||||||||||||||||||||||||||||||||||||||||||||||||||||||||||||||||||||||||||||||||||||||||||||||||||||||||||||||||||||||||||||||||||||||||||||||||||||||||||||||||||||||||||||||||||||||||||||||||||||||||||||||||||||||||||||||||||||||||||||||||||||||||||||||||||||||||||||||||||||||||||
| Cite this page as follows | Statistical Computations at FreeStatistics.org, Office for Research Development and Education, URL https://freestatistics.org/blog/index.php?v=date/2008/Oct/24/t1224858748urgfo4pmq4yb1rl.htm/, Retrieved Thu, 03 Apr 2025 10:14:59 +0000 | ||||||||||||||||||||||||||||||||||||||||||||||||||||||||||||||||||||||||||||||||||||||||||||||||||||||||||||||||||||||||||||||||||||||||||||||||||||||||||||||||||||||||||||||||||||||||||||||||||||||||||||||||||||||||||||||||||||||||||||||||||||||||||||||||||||||||||||||||||||||||||||||||||||||||||||||||||||||||||||||||||||
| Statistical Computations at FreeStatistics.org, Office for Research Development and Education, URL https://freestatistics.org/blog/index.php?pk=18624, Retrieved Thu, 03 Apr 2025 10:14:59 +0000 | |||||||||||||||||||||||||||||||||||||||||||||||||||||||||||||||||||||||||||||||||||||||||||||||||||||||||||||||||||||||||||||||||||||||||||||||||||||||||||||||||||||||||||||||||||||||||||||||||||||||||||||||||||||||||||||||||||||||||||||||||||||||||||||||||||||||||||||||||||||||||||||||||||||||||||||||||||||||||||||||||||||
| QR Codes: | |||||||||||||||||||||||||||||||||||||||||||||||||||||||||||||||||||||||||||||||||||||||||||||||||||||||||||||||||||||||||||||||||||||||||||||||||||||||||||||||||||||||||||||||||||||||||||||||||||||||||||||||||||||||||||||||||||||||||||||||||||||||||||||||||||||||||||||||||||||||||||||||||||||||||||||||||||||||||||||||||||||
|
| |||||||||||||||||||||||||||||||||||||||||||||||||||||||||||||||||||||||||||||||||||||||||||||||||||||||||||||||||||||||||||||||||||||||||||||||||||||||||||||||||||||||||||||||||||||||||||||||||||||||||||||||||||||||||||||||||||||||||||||||||||||||||||||||||||||||||||||||||||||||||||||||||||||||||||||||||||||||||||||||||||||
| Original text written by user: | |||||||||||||||||||||||||||||||||||||||||||||||||||||||||||||||||||||||||||||||||||||||||||||||||||||||||||||||||||||||||||||||||||||||||||||||||||||||||||||||||||||||||||||||||||||||||||||||||||||||||||||||||||||||||||||||||||||||||||||||||||||||||||||||||||||||||||||||||||||||||||||||||||||||||||||||||||||||||||||||||||||
| IsPrivate? | No (this computation is public) | ||||||||||||||||||||||||||||||||||||||||||||||||||||||||||||||||||||||||||||||||||||||||||||||||||||||||||||||||||||||||||||||||||||||||||||||||||||||||||||||||||||||||||||||||||||||||||||||||||||||||||||||||||||||||||||||||||||||||||||||||||||||||||||||||||||||||||||||||||||||||||||||||||||||||||||||||||||||||||||||||||||
| User-defined keywords | Autocorrelatie vervaardigde kleding | ||||||||||||||||||||||||||||||||||||||||||||||||||||||||||||||||||||||||||||||||||||||||||||||||||||||||||||||||||||||||||||||||||||||||||||||||||||||||||||||||||||||||||||||||||||||||||||||||||||||||||||||||||||||||||||||||||||||||||||||||||||||||||||||||||||||||||||||||||||||||||||||||||||||||||||||||||||||||||||||||||||
| Estimated Impact | 214 | ||||||||||||||||||||||||||||||||||||||||||||||||||||||||||||||||||||||||||||||||||||||||||||||||||||||||||||||||||||||||||||||||||||||||||||||||||||||||||||||||||||||||||||||||||||||||||||||||||||||||||||||||||||||||||||||||||||||||||||||||||||||||||||||||||||||||||||||||||||||||||||||||||||||||||||||||||||||||||||||||||||
Tree of Dependent Computations | |||||||||||||||||||||||||||||||||||||||||||||||||||||||||||||||||||||||||||||||||||||||||||||||||||||||||||||||||||||||||||||||||||||||||||||||||||||||||||||||||||||||||||||||||||||||||||||||||||||||||||||||||||||||||||||||||||||||||||||||||||||||||||||||||||||||||||||||||||||||||||||||||||||||||||||||||||||||||||||||||||||
| Family? (F = Feedback message, R = changed R code, M = changed R Module, P = changed Parameters, D = changed Data) | |||||||||||||||||||||||||||||||||||||||||||||||||||||||||||||||||||||||||||||||||||||||||||||||||||||||||||||||||||||||||||||||||||||||||||||||||||||||||||||||||||||||||||||||||||||||||||||||||||||||||||||||||||||||||||||||||||||||||||||||||||||||||||||||||||||||||||||||||||||||||||||||||||||||||||||||||||||||||||||||||||||
| F [Univariate Explorative Data Analysis] [Investigation Dis...] [2007-10-21 17:06:37] [b9964c45117f7aac638ab9056d451faa] F RMPD [(Partial) Autocorrelation Function] [] [2008-10-23 10:32:19] [28075c6928548bea087cb2be962cfe7e] - P [(Partial) Autocorrelation Function] [q2 autocorrelatio...] [2008-10-23 12:14:19] [7173087adebe3e3a714c80ea2417b3eb] - P [(Partial) Autocorrelation Function] [Autocorrelatie ve...] [2008-10-24 14:28:29] [f4b2017b314c03698059f43b95818e67] [Current] | |||||||||||||||||||||||||||||||||||||||||||||||||||||||||||||||||||||||||||||||||||||||||||||||||||||||||||||||||||||||||||||||||||||||||||||||||||||||||||||||||||||||||||||||||||||||||||||||||||||||||||||||||||||||||||||||||||||||||||||||||||||||||||||||||||||||||||||||||||||||||||||||||||||||||||||||||||||||||||||||||||||
| Feedback Forum | |||||||||||||||||||||||||||||||||||||||||||||||||||||||||||||||||||||||||||||||||||||||||||||||||||||||||||||||||||||||||||||||||||||||||||||||||||||||||||||||||||||||||||||||||||||||||||||||||||||||||||||||||||||||||||||||||||||||||||||||||||||||||||||||||||||||||||||||||||||||||||||||||||||||||||||||||||||||||||||||||||||
Post a new message | |||||||||||||||||||||||||||||||||||||||||||||||||||||||||||||||||||||||||||||||||||||||||||||||||||||||||||||||||||||||||||||||||||||||||||||||||||||||||||||||||||||||||||||||||||||||||||||||||||||||||||||||||||||||||||||||||||||||||||||||||||||||||||||||||||||||||||||||||||||||||||||||||||||||||||||||||||||||||||||||||||||
Dataset | |||||||||||||||||||||||||||||||||||||||||||||||||||||||||||||||||||||||||||||||||||||||||||||||||||||||||||||||||||||||||||||||||||||||||||||||||||||||||||||||||||||||||||||||||||||||||||||||||||||||||||||||||||||||||||||||||||||||||||||||||||||||||||||||||||||||||||||||||||||||||||||||||||||||||||||||||||||||||||||||||||||
| Dataseries X: | |||||||||||||||||||||||||||||||||||||||||||||||||||||||||||||||||||||||||||||||||||||||||||||||||||||||||||||||||||||||||||||||||||||||||||||||||||||||||||||||||||||||||||||||||||||||||||||||||||||||||||||||||||||||||||||||||||||||||||||||||||||||||||||||||||||||||||||||||||||||||||||||||||||||||||||||||||||||||||||||||||||
109.20 88.60 94.30 98.30 86.40 80.60 104.10 108.20 93.40 71.90 94.10 94.90 96.40 91.10 84.40 86.40 88.00 75.10 109.70 103.00 82.10 68.00 96.40 94.30 90.00 88.00 76.10 82.50 81.40 66.50 97.20 94.10 80.70 70.50 87.80 89.50 99.60 84.20 75.10 92.00 80.80 73.10 99.80 90.00 83.10 72.40 78.80 87.30 91.00 80.10 73.60 86.40 74.50 71.20 92.40 81.50 85.30 69.90 84.20 90.70 100.30 | |||||||||||||||||||||||||||||||||||||||||||||||||||||||||||||||||||||||||||||||||||||||||||||||||||||||||||||||||||||||||||||||||||||||||||||||||||||||||||||||||||||||||||||||||||||||||||||||||||||||||||||||||||||||||||||||||||||||||||||||||||||||||||||||||||||||||||||||||||||||||||||||||||||||||||||||||||||||||||||||||||||
Tables (Output of Computation) | |||||||||||||||||||||||||||||||||||||||||||||||||||||||||||||||||||||||||||||||||||||||||||||||||||||||||||||||||||||||||||||||||||||||||||||||||||||||||||||||||||||||||||||||||||||||||||||||||||||||||||||||||||||||||||||||||||||||||||||||||||||||||||||||||||||||||||||||||||||||||||||||||||||||||||||||||||||||||||||||||||||
\begin{tabular}{lllllllll}
\hline
Summary of computational transaction \tabularnewline
Raw Input & view raw input (R code)  \tabularnewline
Raw Output & view raw output of R engine  \tabularnewline
Computing time & 2 seconds \tabularnewline
R Server & 'Gwilym Jenkins' @ 72.249.127.135 \tabularnewline
\hline
\end{tabular}
%Source: https://freestatistics.org/blog/index.php?pk=18624&T=0
[TABLE] [ROW][C]Summary of computational transaction[/C][/ROW] [ROW][C]Raw Input[/C][C]view raw input (R code) [/C][/ROW] [ROW][C]Raw Output[/C][C]view raw output of R engine [/C][/ROW] [ROW][C]Computing time[/C][C]2 seconds[/C][/ROW] [ROW][C]R Server[/C][C]'Gwilym Jenkins' @ 72.249.127.135[/C][/ROW] [/TABLE] Source: https://freestatistics.org/blog/index.php?pk=18624&T=0
Globally Unique Identifier (entire table): ba.freestatistics.org/blog/index.php?pk=18624&T=0
As an alternative you can also use a QR Code: The GUIDs for individual cells are displayed in the table below:
\begin{tabular}{lllllllll}
\hline
Autocorrelation Function \tabularnewline
Time lag k & ACF(k) & T-STAT & P-value \tabularnewline
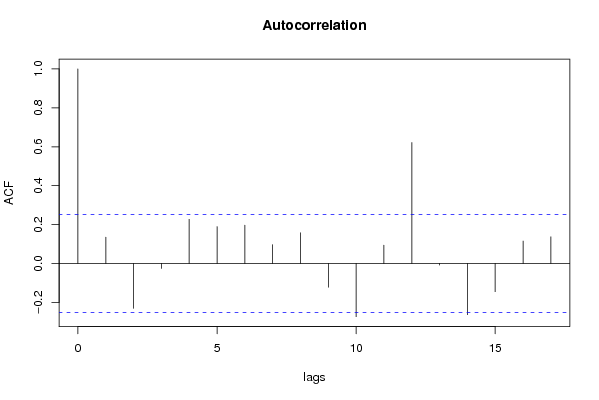
1 & 0.134868 & 1.0534 & 0.148167 \tabularnewline
2 & -0.230388 & -1.7994 & 0.038452 \tabularnewline
3 & -0.025856 & -0.2019 & 0.420317 \tabularnewline
4 & 0.226823 & 1.7715 & 0.040733 \tabularnewline
5 & 0.189347 & 1.4788 & 0.072164 \tabularnewline
6 & 0.196971 & 1.5384 & 0.064562 \tabularnewline
7 & 0.096731 & 0.7555 & 0.226431 \tabularnewline
8 & 0.157353 & 1.229 & 0.111903 \tabularnewline
9 & -0.121757 & -0.951 & 0.172691 \tabularnewline
10 & -0.273532 & -2.1364 & 0.018336 \tabularnewline
11 & 0.093815 & 0.7327 & 0.233269 \tabularnewline
12 & 0.621864 & 4.8569 & 4e-06 \tabularnewline
13 & -0.008279 & -0.0647 & 0.474327 \tabularnewline
14 & -0.26372 & -2.0597 & 0.02185 \tabularnewline
15 & -0.145361 & -1.1353 & 0.130345 \tabularnewline
16 & 0.115176 & 0.8996 & 0.185948 \tabularnewline
17 & 0.137087 & 1.0707 & 0.144266 \tabularnewline
\hline
\end{tabular}
%Source: https://freestatistics.org/blog/index.php?pk=18624&T=1
[TABLE] [ROW][C]Autocorrelation Function[/C][/ROW] [ROW][C]Time lag k[/C][C]ACF(k)[/C][C]T-STAT[/C][C]P-value[/C][/ROW] [ROW][C]1[/C][C]0.134868[/C][C]1.0534[/C][C]0.148167[/C][/ROW] [ROW][C]2[/C][C]-0.230388[/C][C]-1.7994[/C][C]0.038452[/C][/ROW] [ROW][C]3[/C][C]-0.025856[/C][C]-0.2019[/C][C]0.420317[/C][/ROW] [ROW][C]4[/C][C]0.226823[/C][C]1.7715[/C][C]0.040733[/C][/ROW] [ROW][C]5[/C][C]0.189347[/C][C]1.4788[/C][C]0.072164[/C][/ROW] [ROW][C]6[/C][C]0.196971[/C][C]1.5384[/C][C]0.064562[/C][/ROW] [ROW][C]7[/C][C]0.096731[/C][C]0.7555[/C][C]0.226431[/C][/ROW] [ROW][C]8[/C][C]0.157353[/C][C]1.229[/C][C]0.111903[/C][/ROW] [ROW][C]9[/C][C]-0.121757[/C][C]-0.951[/C][C]0.172691[/C][/ROW] [ROW][C]10[/C][C]-0.273532[/C][C]-2.1364[/C][C]0.018336[/C][/ROW] [ROW][C]11[/C][C]0.093815[/C][C]0.7327[/C][C]0.233269[/C][/ROW] [ROW][C]12[/C][C]0.621864[/C][C]4.8569[/C][C]4e-06[/C][/ROW] [ROW][C]13[/C][C]-0.008279[/C][C]-0.0647[/C][C]0.474327[/C][/ROW] [ROW][C]14[/C][C]-0.26372[/C][C]-2.0597[/C][C]0.02185[/C][/ROW] [ROW][C]15[/C][C]-0.145361[/C][C]-1.1353[/C][C]0.130345[/C][/ROW] [ROW][C]16[/C][C]0.115176[/C][C]0.8996[/C][C]0.185948[/C][/ROW] [ROW][C]17[/C][C]0.137087[/C][C]1.0707[/C][C]0.144266[/C][/ROW] [/TABLE] Source: https://freestatistics.org/blog/index.php?pk=18624&T=1
Globally Unique Identifier (entire table): ba.freestatistics.org/blog/index.php?pk=18624&T=1
As an alternative you can also use a QR Code: The GUIDs for individual cells are displayed in the table below:
\begin{tabular}{lllllllll}
\hline
Partial Autocorrelation Function \tabularnewline
Time lag k & PACF(k) & T-STAT & P-value \tabularnewline
1 & 0.134868 & 1.0534 & 0.148167 \tabularnewline
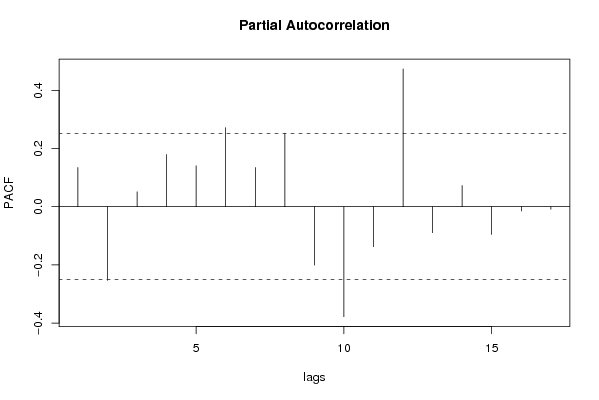
2 & -0.253183 & -1.9774 & 0.026259 \tabularnewline
3 & 0.051399 & 0.4014 & 0.344751 \tabularnewline
4 & 0.179242 & 1.3999 & 0.083301 \tabularnewline
5 & 0.140633 & 1.0984 & 0.138178 \tabularnewline
6 & 0.271856 & 2.1233 & 0.018899 \tabularnewline
7 & 0.134491 & 1.0504 & 0.148838 \tabularnewline
8 & 0.252903 & 1.9752 & 0.026385 \tabularnewline
9 & -0.200811 & -1.5684 & 0.060983 \tabularnewline
10 & -0.378002 & -2.9523 & 0.002236 \tabularnewline
11 & -0.137616 & -1.0748 & 0.143345 \tabularnewline
12 & 0.473747 & 3.7001 & 0.000232 \tabularnewline
13 & -0.089353 & -0.6979 & 0.243955 \tabularnewline
14 & 0.072708 & 0.5679 & 0.286104 \tabularnewline
15 & -0.09552 & -0.746 & 0.229255 \tabularnewline
16 & -0.014972 & -0.1169 & 0.453649 \tabularnewline
17 & -0.008653 & -0.0676 & 0.473169 \tabularnewline
\hline
\end{tabular}
%Source: https://freestatistics.org/blog/index.php?pk=18624&T=2
[TABLE] [ROW][C]Partial Autocorrelation Function[/C][/ROW] [ROW][C]Time lag k[/C][C]PACF(k)[/C][C]T-STAT[/C][C]P-value[/C][/ROW] [ROW][C]1[/C][C]0.134868[/C][C]1.0534[/C][C]0.148167[/C][/ROW] [ROW][C]2[/C][C]-0.253183[/C][C]-1.9774[/C][C]0.026259[/C][/ROW] [ROW][C]3[/C][C]0.051399[/C][C]0.4014[/C][C]0.344751[/C][/ROW] [ROW][C]4[/C][C]0.179242[/C][C]1.3999[/C][C]0.083301[/C][/ROW] [ROW][C]5[/C][C]0.140633[/C][C]1.0984[/C][C]0.138178[/C][/ROW] [ROW][C]6[/C][C]0.271856[/C][C]2.1233[/C][C]0.018899[/C][/ROW] [ROW][C]7[/C][C]0.134491[/C][C]1.0504[/C][C]0.148838[/C][/ROW] [ROW][C]8[/C][C]0.252903[/C][C]1.9752[/C][C]0.026385[/C][/ROW] [ROW][C]9[/C][C]-0.200811[/C][C]-1.5684[/C][C]0.060983[/C][/ROW] [ROW][C]10[/C][C]-0.378002[/C][C]-2.9523[/C][C]0.002236[/C][/ROW] [ROW][C]11[/C][C]-0.137616[/C][C]-1.0748[/C][C]0.143345[/C][/ROW] [ROW][C]12[/C][C]0.473747[/C][C]3.7001[/C][C]0.000232[/C][/ROW] [ROW][C]13[/C][C]-0.089353[/C][C]-0.6979[/C][C]0.243955[/C][/ROW] [ROW][C]14[/C][C]0.072708[/C][C]0.5679[/C][C]0.286104[/C][/ROW] [ROW][C]15[/C][C]-0.09552[/C][C]-0.746[/C][C]0.229255[/C][/ROW] [ROW][C]16[/C][C]-0.014972[/C][C]-0.1169[/C][C]0.453649[/C][/ROW] [ROW][C]17[/C][C]-0.008653[/C][C]-0.0676[/C][C]0.473169[/C][/ROW] [/TABLE] Source: https://freestatistics.org/blog/index.php?pk=18624&T=2
Globally Unique Identifier (entire table): ba.freestatistics.org/blog/index.php?pk=18624&T=2
As an alternative you can also use a QR Code: The GUIDs for individual cells are displayed in the table below:
| |||||||||||||||||||||||||||||||||||||||||||||||||||||||||||||||||||||||||||||||||||||||||||||||||||||||||||||||||||||||||||||||||||||||||||||||||||||||||||||||||||||||||||||||||||||||||||||||||||||||||||||||||||||||||||||||||||||||||||||||||||||||||||||||||||||||||||||||||||||||||||||||||||||||||||||||||||||||||||||||||||||
Figures (Output of Computation) | |||||||||||||||||||||||||||||||||||||||||||||||||||||||||||||||||||||||||||||||||||||||||||||||||||||||||||||||||||||||||||||||||||||||||||||||||||||||||||||||||||||||||||||||||||||||||||||||||||||||||||||||||||||||||||||||||||||||||||||||||||||||||||||||||||||||||||||||||||||||||||||||||||||||||||||||||||||||||||||||||||||
Input Parameters & R Code | |||||||||||||||||||||||||||||||||||||||||||||||||||||||||||||||||||||||||||||||||||||||||||||||||||||||||||||||||||||||||||||||||||||||||||||||||||||||||||||||||||||||||||||||||||||||||||||||||||||||||||||||||||||||||||||||||||||||||||||||||||||||||||||||||||||||||||||||||||||||||||||||||||||||||||||||||||||||||||||||||||||
| Parameters (Session): | |||||||||||||||||||||||||||||||||||||||||||||||||||||||||||||||||||||||||||||||||||||||||||||||||||||||||||||||||||||||||||||||||||||||||||||||||||||||||||||||||||||||||||||||||||||||||||||||||||||||||||||||||||||||||||||||||||||||||||||||||||||||||||||||||||||||||||||||||||||||||||||||||||||||||||||||||||||||||||||||||||||
| par1 = 0 ; par2 = 0 ; | |||||||||||||||||||||||||||||||||||||||||||||||||||||||||||||||||||||||||||||||||||||||||||||||||||||||||||||||||||||||||||||||||||||||||||||||||||||||||||||||||||||||||||||||||||||||||||||||||||||||||||||||||||||||||||||||||||||||||||||||||||||||||||||||||||||||||||||||||||||||||||||||||||||||||||||||||||||||||||||||||||||
| Parameters (R input): | |||||||||||||||||||||||||||||||||||||||||||||||||||||||||||||||||||||||||||||||||||||||||||||||||||||||||||||||||||||||||||||||||||||||||||||||||||||||||||||||||||||||||||||||||||||||||||||||||||||||||||||||||||||||||||||||||||||||||||||||||||||||||||||||||||||||||||||||||||||||||||||||||||||||||||||||||||||||||||||||||||||
| par1 = Default ; par2 = 1 ; par3 = 0 ; par4 = 0 ; par5 = 12 ; par6 = ; par7 = ; par8 = ; par9 = ; par10 = ; par11 = ; par12 = ; par13 = ; par14 = ; par15 = ; par16 = ; par17 = ; par18 = ; par19 = ; par20 = ; | |||||||||||||||||||||||||||||||||||||||||||||||||||||||||||||||||||||||||||||||||||||||||||||||||||||||||||||||||||||||||||||||||||||||||||||||||||||||||||||||||||||||||||||||||||||||||||||||||||||||||||||||||||||||||||||||||||||||||||||||||||||||||||||||||||||||||||||||||||||||||||||||||||||||||||||||||||||||||||||||||||||
| R code (references can be found in the software module): | |||||||||||||||||||||||||||||||||||||||||||||||||||||||||||||||||||||||||||||||||||||||||||||||||||||||||||||||||||||||||||||||||||||||||||||||||||||||||||||||||||||||||||||||||||||||||||||||||||||||||||||||||||||||||||||||||||||||||||||||||||||||||||||||||||||||||||||||||||||||||||||||||||||||||||||||||||||||||||||||||||||
if (par1 == 'Default') { | |||||||||||||||||||||||||||||||||||||||||||||||||||||||||||||||||||||||||||||||||||||||||||||||||||||||||||||||||||||||||||||||||||||||||||||||||||||||||||||||||||||||||||||||||||||||||||||||||||||||||||||||||||||||||||||||||||||||||||||||||||||||||||||||||||||||||||||||||||||||||||||||||||||||||||||||||||||||||||||||||||||


