Free Statistics
of Irreproducible Research!
Description of Statistical Computation | |||||||||||||||||||||||||||||||||||||||||
|---|---|---|---|---|---|---|---|---|---|---|---|---|---|---|---|---|---|---|---|---|---|---|---|---|---|---|---|---|---|---|---|---|---|---|---|---|---|---|---|---|---|
| Author's title | |||||||||||||||||||||||||||||||||||||||||
| Author | *Unverified author* | ||||||||||||||||||||||||||||||||||||||||
| R Software Module | rwasp_univariatedataseries.wasp | ||||||||||||||||||||||||||||||||||||||||
| Title produced by software | Univariate Data Series | ||||||||||||||||||||||||||||||||||||||||
| Date of computation | Tue, 15 Feb 2011 15:04:20 +0000 | ||||||||||||||||||||||||||||||||||||||||
| Cite this page as follows | Statistical Computations at FreeStatistics.org, Office for Research Development and Education, URL https://freestatistics.org/blog/index.php?v=date/2011/Feb/15/t1297782095cwvw1npkrd8c3qt.htm/, Retrieved Tue, 18 Feb 2025 22:05:29 +0000 | ||||||||||||||||||||||||||||||||||||||||
| Statistical Computations at FreeStatistics.org, Office for Research Development and Education, URL https://freestatistics.org/blog/index.php?pk=118294, Retrieved Tue, 18 Feb 2025 22:05:29 +0000 | |||||||||||||||||||||||||||||||||||||||||
| QR Codes: | |||||||||||||||||||||||||||||||||||||||||
|
| |||||||||||||||||||||||||||||||||||||||||
| Original text written by user: | |||||||||||||||||||||||||||||||||||||||||
| IsPrivate? | No (this computation is public) | ||||||||||||||||||||||||||||||||||||||||
| User-defined keywords | KDGP1W1 | ||||||||||||||||||||||||||||||||||||||||
| Estimated Impact | 233 | ||||||||||||||||||||||||||||||||||||||||
Tree of Dependent Computations | |||||||||||||||||||||||||||||||||||||||||
| Family? (F = Feedback message, R = changed R code, M = changed R Module, P = changed Parameters, D = changed Data) | |||||||||||||||||||||||||||||||||||||||||
| - [Univariate Data Series] [] [2011-02-15 15:04:20] [cd3c8dd726b701571412eb3280c696e7] [Current] - RMP [Histogram] [frequentietabel 1] [2011-02-22 14:33:09] [a64931d1905627575c372fc3cd81ac07] - RMP [Histogram] [frequentietabel 4...] [2011-02-22 14:36:10] [a64931d1905627575c372fc3cd81ac07] - RMP [Histogram] [frequentietabel 1...] [2011-02-22 14:40:14] [a64931d1905627575c372fc3cd81ac07] - RMP [Kernel Density Estimation] [dichtheidsgrafiek...] [2011-02-22 14:50:21] [a64931d1905627575c372fc3cd81ac07] | |||||||||||||||||||||||||||||||||||||||||
| Feedback Forum | |||||||||||||||||||||||||||||||||||||||||
Post a new message | |||||||||||||||||||||||||||||||||||||||||
Dataset | |||||||||||||||||||||||||||||||||||||||||
| Dataseries X: | |||||||||||||||||||||||||||||||||||||||||
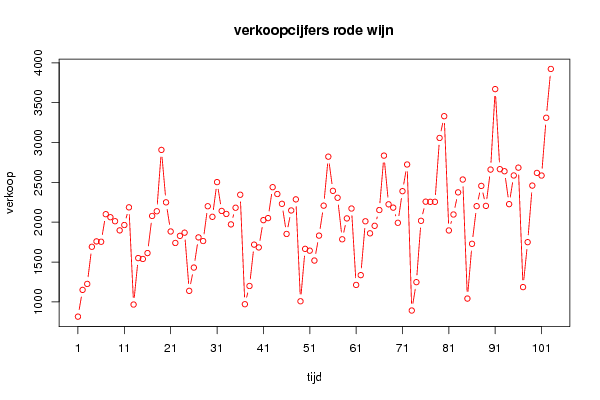
814 1150 1225 1691 1759 1754 2100 2062 2012 1897 1964 2186 966 1549 1538 1612 2078 2137 2907 2249 1883 1739 1828 1868 1138 1430 1809 1763 2200 2067 2503 2141 2103 1972 2181 2344 970 1199 1718 1683 2025 2051 2439 2353 2230 1852 2147 2286 1007 1665 1642 1518 1831 2207 2822 2393 2306 1785 2047 2171 1212 1335 2011 1860 1954 2152 2835 2224 2182 1992 2389 2724 891 1247 2017 2257 2255 2255 3057 3330 1896 2096 2374 2535 1041 1728 2201 2455 2204 2660 3670 2665 2639 2226 2586 2684 1185 1749 2459 2618 2585 3310 3923 | |||||||||||||||||||||||||||||||||||||||||
Tables (Output of Computation) | |||||||||||||||||||||||||||||||||||||||||
| |||||||||||||||||||||||||||||||||||||||||
Figures (Output of Computation) | |||||||||||||||||||||||||||||||||||||||||
Input Parameters & R Code | |||||||||||||||||||||||||||||||||||||||||
| Parameters (Session): | |||||||||||||||||||||||||||||||||||||||||
| par1 = verkoopcijfers rode wijn ; par2 = http://robjhyndman.com/tsdldata/data/redwine.dat ; par3 = verkoopcijfers rode wijn ; par4 = No season ; | |||||||||||||||||||||||||||||||||||||||||
| Parameters (R input): | |||||||||||||||||||||||||||||||||||||||||
| par1 = verkoopcijfers rode wijn ; par2 = http://robjhyndman.com/tsdldata/data/redwine.dat ; par3 = verkoopcijfers rode wijn ; par4 = No season ; | |||||||||||||||||||||||||||||||||||||||||
| R code (references can be found in the software module): | |||||||||||||||||||||||||||||||||||||||||
if (par4 != 'No season') { | |||||||||||||||||||||||||||||||||||||||||
