Free Statistics

of Irreproducible Research!

Author's title

Author*The author of this computation has been verified*
R Software Modulerwasp_multipleregression.wasp
Title produced by softwareMultiple Regression
Date of computationThu, 24 Nov 2011 13:25:47 -0500
Cite this page as followsStatistical Computations at FreeStatistics.org, Office for Research Development and Education, URL https://freestatistics.org/blog/index.php?v=date/2011/Nov/24/t13221592047qb8e6cwhpv1dm4.htm/, Retrieved Thu, 31 Oct 2024 22:58:08 +0000
Statistical Computations at FreeStatistics.org, Office for Research Development and Education, URL https://freestatistics.org/blog/index.php?pk=147133, Retrieved Thu, 31 Oct 2024 22:58:08 +0000
QR Codes:

Original text written by user:
IsPrivate?No (this computation is public)
User-defined keywords
Estimated Impact117
Family? (F = Feedback message, R = changed R code, M = changed R Module, P = changed Parameters, D = changed Data)
-       [Multiple Regression] [WS 7 2] [2011-11-24 18:25:47] [850c8b4f3ff1a893cc2b9e9f060c8f7e] [Current]
Feedback Forum

Post a new message
Dataseries X:
119.3	143.7
104.1	124.1
97.1	129.2
97.3	121.9
104.5	124.8
111	129.6
113	125.2
95.4	124.8
86.2	128.3
111.7	129.4
97.5	127.6
99.7	123.7
111.5	129
91.8	118.4
86.3	104.9
88.7	101
95.1	99.5
105.1	106.7
104.5	101.6
89.1	103.2
82.6	104.6
102.7	105.7
91.8	101.1
94.1	98.8
103.1	107.6
93.2	96.9
91	106.4
94.3	102
99.4	105.7
115.7	117
116.8	116
99.8	125.5
96	120.2
115.9	124.1
109.1	111.4
117.3	120.8
109.8	120.2
112.8	124.6
110.7	125.4
100	114.2
113.3	113.6
122.4	110.5
112.5	106.4
104.2	117
92.5	121.9
117.2	114.9
109.3	117.6
106.1	117.6
118.8	125.8
105.3	114.9
106	119.4
102	117.3
112.9	115
116.5	120.9
114.8	117
100.5	117.8
85.4	114
114.6	114.4
109.9	119.6
100.7	113.1
115.5	125.1


Summary of computational transaction
Raw Inputview raw input (R code)
Raw Outputview raw output of R engine
Computing time6 seconds
R Server'AstonUniversity' @ aston.wessa.net

\begin{tabular}{lllllllll}
\hline
Summary of computational transaction \tabularnewline
Raw Input & view raw input (R code)  \tabularnewline
Raw Output & view raw output of R engine  \tabularnewline
Computing time & 6 seconds \tabularnewline
R Server & 'AstonUniversity' @ aston.wessa.net \tabularnewline
\hline
\end{tabular}
%Source: https://freestatistics.org/blog/index.php?pk=147133&T=0

[TABLE]
[ROW][C]Summary of computational transaction[/C][/ROW]
[ROW][C]Raw Input[/C][C]view raw input (R code) [/C][/ROW]
[ROW][C]Raw Output[/C][C]view raw output of R engine [/C][/ROW]
[ROW][C]Computing time[/C][C]6 seconds[/C][/ROW]
[ROW][C]R Server[/C][C]'AstonUniversity' @ aston.wessa.net[/C][/ROW]
[/TABLE]
Source: https://freestatistics.org/blog/index.php?pk=147133&T=0

Globally Unique Identifier (entire table): ba.freestatistics.org/blog/index.php?pk=147133&T=0

As an alternative you can also use a QR Code:  

The GUIDs for individual cells are displayed in the table below:

Summary of computational transaction
Raw Inputview raw input (R code)
Raw Outputview raw output of R engine
Computing time6 seconds
R Server'AstonUniversity' @ aston.wessa.net


Multiple Linear Regression - Estimated Regression Equation
IPCN[t] = + 32.1359887285878 + 0.79806923413219TIP[t] + 2.91552114780811M1[t] + 2.68786816104289M2[t] + 6.53765109494854M3[t] + 2.16225294702119M4[t] -4.24518108183299M5[t] -6.28761111243592M6[t] -8.53512510631533M7[t] + 7.47284017328406M8[t] + 15.0029612813481M9[t] -4.15493202972855M10[t] + 0.707884154047932M11[t] + e[t]

\begin{tabular}{lllllllll}
\hline
Multiple Linear Regression - Estimated Regression Equation \tabularnewline
IPCN[t] =  +  32.1359887285878 +  0.79806923413219TIP[t] +  2.91552114780811M1[t] +  2.68786816104289M2[t] +  6.53765109494854M3[t] +  2.16225294702119M4[t] -4.24518108183299M5[t] -6.28761111243592M6[t] -8.53512510631533M7[t] +  7.47284017328406M8[t] +  15.0029612813481M9[t] -4.15493202972855M10[t] +  0.707884154047932M11[t]  + e[t] \tabularnewline
\hline
\end{tabular}
%Source: https://freestatistics.org/blog/index.php?pk=147133&T=1

[TABLE]
[ROW][C]Multiple Linear Regression - Estimated Regression Equation[/C][/ROW]
[ROW][C]IPCN[t] =  +  32.1359887285878 +  0.79806923413219TIP[t] +  2.91552114780811M1[t] +  2.68786816104289M2[t] +  6.53765109494854M3[t] +  2.16225294702119M4[t] -4.24518108183299M5[t] -6.28761111243592M6[t] -8.53512510631533M7[t] +  7.47284017328406M8[t] +  15.0029612813481M9[t] -4.15493202972855M10[t] +  0.707884154047932M11[t]  + e[t][/C][/ROW]
[/TABLE]
Source: https://freestatistics.org/blog/index.php?pk=147133&T=1

Globally Unique Identifier (entire table): ba.freestatistics.org/blog/index.php?pk=147133&T=1

As an alternative you can also use a QR Code:  

The GUIDs for individual cells are displayed in the table below:

Multiple Linear Regression - Estimated Regression Equation
IPCN[t] = + 32.1359887285878 + 0.79806923413219TIP[t] + 2.91552114780811M1[t] + 2.68786816104289M2[t] + 6.53765109494854M3[t] + 2.16225294702119M4[t] -4.24518108183299M5[t] -6.28761111243592M6[t] -8.53512510631533M7[t] + 7.47284017328406M8[t] + 15.0029612813481M9[t] -4.15493202972855M10[t] + 0.707884154047932M11[t] + e[t]


Multiple Linear Regression - Ordinary Least Squares
VariableParameterS.D.T-STATH0: parameter = 02-tail p-value1-tail p-value
(Intercept)32.135988728587817.3366031.85360.069940.03497
TIP0.798069234132190.1635824.87871.2e-056e-06
M12.915521147808115.2020690.56050.5777760.288888
M22.687868161042895.2013320.51680.6076930.303846
M36.537651094948545.2630871.24220.2202090.110104
M42.162252947021195.3186310.40650.6861510.343075
M5-4.245181081832995.195031-0.81720.4178740.208937
M6-6.287611112435925.469488-1.14960.2560130.128006
M7-8.535125106315335.382877-1.58560.1193950.059698
M87.472840173284065.2749671.41670.163040.08152
M915.00296128134815.743192.61230.011970.005985
M10-4.154932029728555.387244-0.77130.4443370.222168
M110.7078841540479325.1895470.13640.8920710.446036

\begin{tabular}{lllllllll}
\hline
Multiple Linear Regression - Ordinary Least Squares \tabularnewline
Variable & Parameter & S.D. & T-STATH0: parameter = 0 & 2-tail p-value & 1-tail p-value \tabularnewline
(Intercept) & 32.1359887285878 & 17.336603 & 1.8536 & 0.06994 & 0.03497 \tabularnewline
TIP & 0.79806923413219 & 0.163582 & 4.8787 & 1.2e-05 & 6e-06 \tabularnewline
M1 & 2.91552114780811 & 5.202069 & 0.5605 & 0.577776 & 0.288888 \tabularnewline
M2 & 2.68786816104289 & 5.201332 & 0.5168 & 0.607693 & 0.303846 \tabularnewline
M3 & 6.53765109494854 & 5.263087 & 1.2422 & 0.220209 & 0.110104 \tabularnewline
M4 & 2.16225294702119 & 5.318631 & 0.4065 & 0.686151 & 0.343075 \tabularnewline
M5 & -4.24518108183299 & 5.195031 & -0.8172 & 0.417874 & 0.208937 \tabularnewline
M6 & -6.28761111243592 & 5.469488 & -1.1496 & 0.256013 & 0.128006 \tabularnewline
M7 & -8.53512510631533 & 5.382877 & -1.5856 & 0.119395 & 0.059698 \tabularnewline
M8 & 7.47284017328406 & 5.274967 & 1.4167 & 0.16304 & 0.08152 \tabularnewline
M9 & 15.0029612813481 & 5.74319 & 2.6123 & 0.01197 & 0.005985 \tabularnewline
M10 & -4.15493202972855 & 5.387244 & -0.7713 & 0.444337 & 0.222168 \tabularnewline
M11 & 0.707884154047932 & 5.189547 & 0.1364 & 0.892071 & 0.446036 \tabularnewline
\hline
\end{tabular}
%Source: https://freestatistics.org/blog/index.php?pk=147133&T=2

[TABLE]
[ROW][C]Multiple Linear Regression - Ordinary Least Squares[/C][/ROW]
[ROW][C]Variable[/C][C]Parameter[/C][C]S.D.[/C][C]T-STATH0: parameter = 0[/C][C]2-tail p-value[/C][C]1-tail p-value[/C][/ROW]
[ROW][C](Intercept)[/C][C]32.1359887285878[/C][C]17.336603[/C][C]1.8536[/C][C]0.06994[/C][C]0.03497[/C][/ROW]
[ROW][C]TIP[/C][C]0.79806923413219[/C][C]0.163582[/C][C]4.8787[/C][C]1.2e-05[/C][C]6e-06[/C][/ROW]
[ROW][C]M1[/C][C]2.91552114780811[/C][C]5.202069[/C][C]0.5605[/C][C]0.577776[/C][C]0.288888[/C][/ROW]
[ROW][C]M2[/C][C]2.68786816104289[/C][C]5.201332[/C][C]0.5168[/C][C]0.607693[/C][C]0.303846[/C][/ROW]
[ROW][C]M3[/C][C]6.53765109494854[/C][C]5.263087[/C][C]1.2422[/C][C]0.220209[/C][C]0.110104[/C][/ROW]
[ROW][C]M4[/C][C]2.16225294702119[/C][C]5.318631[/C][C]0.4065[/C][C]0.686151[/C][C]0.343075[/C][/ROW]
[ROW][C]M5[/C][C]-4.24518108183299[/C][C]5.195031[/C][C]-0.8172[/C][C]0.417874[/C][C]0.208937[/C][/ROW]
[ROW][C]M6[/C][C]-6.28761111243592[/C][C]5.469488[/C][C]-1.1496[/C][C]0.256013[/C][C]0.128006[/C][/ROW]
[ROW][C]M7[/C][C]-8.53512510631533[/C][C]5.382877[/C][C]-1.5856[/C][C]0.119395[/C][C]0.059698[/C][/ROW]
[ROW][C]M8[/C][C]7.47284017328406[/C][C]5.274967[/C][C]1.4167[/C][C]0.16304[/C][C]0.08152[/C][/ROW]
[ROW][C]M9[/C][C]15.0029612813481[/C][C]5.74319[/C][C]2.6123[/C][C]0.01197[/C][C]0.005985[/C][/ROW]
[ROW][C]M10[/C][C]-4.15493202972855[/C][C]5.387244[/C][C]-0.7713[/C][C]0.444337[/C][C]0.222168[/C][/ROW]
[ROW][C]M11[/C][C]0.707884154047932[/C][C]5.189547[/C][C]0.1364[/C][C]0.892071[/C][C]0.446036[/C][/ROW]
[/TABLE]
Source: https://freestatistics.org/blog/index.php?pk=147133&T=2

Globally Unique Identifier (entire table): ba.freestatistics.org/blog/index.php?pk=147133&T=2

As an alternative you can also use a QR Code:  

The GUIDs for individual cells are displayed in the table below:

Multiple Linear Regression - Ordinary Least Squares
VariableParameterS.D.T-STATH0: parameter = 02-tail p-value1-tail p-value
(Intercept)32.135988728587817.3366031.85360.069940.03497
TIP0.798069234132190.1635824.87871.2e-056e-06
M12.915521147808115.2020690.56050.5777760.288888
M22.687868161042895.2013320.51680.6076930.303846
M36.537651094948545.2630871.24220.2202090.110104
M42.162252947021195.3186310.40650.6861510.343075
M5-4.245181081832995.195031-0.81720.4178740.208937
M6-6.287611112435925.469488-1.14960.2560130.128006
M7-8.535125106315335.382877-1.58560.1193950.059698
M87.472840173284065.2749671.41670.163040.08152
M915.00296128134815.743192.61230.011970.005985
M10-4.154932029728555.387244-0.77130.4443370.222168
M110.7078841540479325.1895470.13640.8920710.446036


Multiple Linear Regression - Regression Statistics
Multiple R0.653594003162558
R-squared0.427185120970058
Adjusted R-squared0.283981401212573
F-TEST (value)2.98305883180614
F-TEST (DF numerator)12
F-TEST (DF denominator)48
p-value0.00350563499120971
Multiple Linear Regression - Residual Statistics
Residual Standard Deviation8.20538028987783
Sum Squared Residuals3231.75675367275

\begin{tabular}{lllllllll}
\hline
Multiple Linear Regression - Regression Statistics \tabularnewline
Multiple R & 0.653594003162558 \tabularnewline
R-squared & 0.427185120970058 \tabularnewline
Adjusted R-squared & 0.283981401212573 \tabularnewline
F-TEST (value) & 2.98305883180614 \tabularnewline
F-TEST (DF numerator) & 12 \tabularnewline
F-TEST (DF denominator) & 48 \tabularnewline
p-value & 0.00350563499120971 \tabularnewline
Multiple Linear Regression - Residual Statistics \tabularnewline
Residual Standard Deviation & 8.20538028987783 \tabularnewline
Sum Squared Residuals & 3231.75675367275 \tabularnewline
\hline
\end{tabular}
%Source: https://freestatistics.org/blog/index.php?pk=147133&T=3

[TABLE]
[ROW][C]Multiple Linear Regression - Regression Statistics[/C][/ROW]
[ROW][C]Multiple R[/C][C]0.653594003162558[/C][/ROW]
[ROW][C]R-squared[/C][C]0.427185120970058[/C][/ROW]
[ROW][C]Adjusted R-squared[/C][C]0.283981401212573[/C][/ROW]
[ROW][C]F-TEST (value)[/C][C]2.98305883180614[/C][/ROW]
[ROW][C]F-TEST (DF numerator)[/C][C]12[/C][/ROW]
[ROW][C]F-TEST (DF denominator)[/C][C]48[/C][/ROW]
[ROW][C]p-value[/C][C]0.00350563499120971[/C][/ROW]
[ROW][C]Multiple Linear Regression - Residual Statistics[/C][/ROW]
[ROW][C]Residual Standard Deviation[/C][C]8.20538028987783[/C][/ROW]
[ROW][C]Sum Squared Residuals[/C][C]3231.75675367275[/C][/ROW]
[/TABLE]
Source: https://freestatistics.org/blog/index.php?pk=147133&T=3

Globally Unique Identifier (entire table): ba.freestatistics.org/blog/index.php?pk=147133&T=3

As an alternative you can also use a QR Code:  

The GUIDs for individual cells are displayed in the table below:

Multiple Linear Regression - Regression Statistics
Multiple R0.653594003162558
R-squared0.427185120970058
Adjusted R-squared0.283981401212573
F-TEST (value)2.98305883180614
F-TEST (DF numerator)12
F-TEST (DF denominator)48
p-value0.00350563499120971
Multiple Linear Regression - Residual Statistics
Residual Standard Deviation8.20538028987783
Sum Squared Residuals3231.75675367275


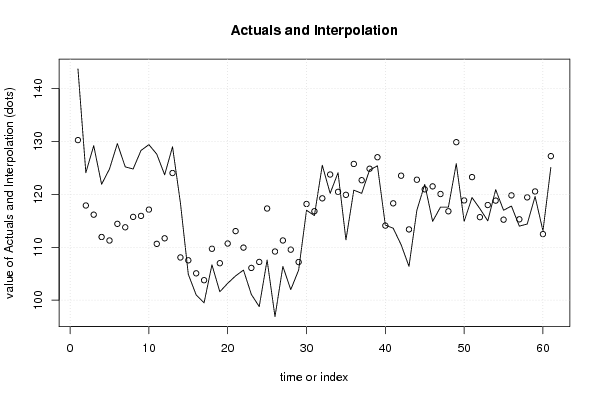
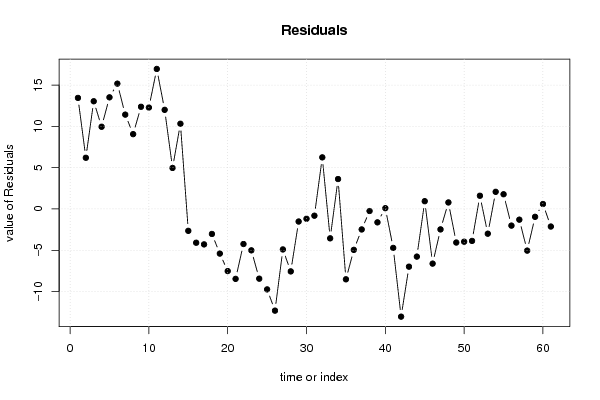
Multiple Linear Regression - Actuals, Interpolation, and Residuals
Time or IndexActualsInterpolationForecastResidualsPrediction Error
1143.7130.26116950836613.4388304916339
2124.1117.9028641627926.19713583720838
3129.2116.16616245777213.033837542228
4121.9111.9503781566719.94962184332896
5124.8111.28904261356913.5109573864314
6129.6114.43406260482515.1659373951751
7125.2113.7826870792111.4173129207901
8124.8115.7446338380839.05536616191725
9128.3115.93251799213112.3674820078693
10129.4117.12539015142512.2746098485752
11127.6110.65562321052416.9443767894758
12123.7111.70349137156711.9965086284329
13129124.0362294821354.96377051786495
14118.4108.08661258296610.3133874170343
15104.9107.547014729144-2.6470147291443
16101105.086982743134-4.08698274313422
1799.5103.787191812726-4.28719181272603
18106.7109.725454123445-3.025454123445
19101.6106.999098589086-5.39909858908629
20103.2110.71679766305-7.51679766304995
21104.6113.059468749255-8.4594687492548
22105.7109.942767044235-4.24276704423512
23101.1106.106628575971-5.00662857597074
2498.8107.234303660427-8.43430366042684
25107.6117.332447915425-9.73244791542465
2696.9109.203909510751-12.3039095107508
27106.4111.297940129566-4.8979401295656
28102109.556170454274-7.55617045427448
29105.7107.218889519494-1.51888951949445
30117118.184988005246-1.18498800524622
31116116.815350168912-0.815350168912207
32125.5119.2561384682646.24386153173563
33120.2123.753596486626-3.55359648662613
34124.1120.477280934783.62271906521997
35111.4119.913226326458-8.5132263264576
36120.8125.749509892294-4.94950989229363
37120.2122.67951178411-2.47951178411032
38124.6124.846066499742-0.246066499741675
39125.4127.01990404197-1.61990404196972
40114.2114.1051650888280.0948349111720517
41113.6118.312051873932-4.71205187393188
42110.5123.532051873932-13.0320518739319
43106.4113.383652462144-6.98365246214379
44117122.767643098446-5.76764309844602
45121.9120.9603541671630.939645832836533
46114.9121.514770939152-6.61477093915186
47117.6120.072840173284-2.47284017328405
48117.6116.8111344700130.788865529986883
49125.8129.8621348913-4.06213489130003
50114.9118.86054724375-3.96054724375025
51119.4123.268978641548-3.86897864154843
52117.3115.7013035570921.59869644290767
53115117.992824180279-2.99282418027901
54120.9118.8234433925522.07655660744804
55117115.2192117006481.78078829935217
56117.8119.814786932157-2.01478693215691
57114115.294062604825-1.29406260482493
58114.4119.439790930408-5.03979093040817
59119.6120.551681713763-0.951681713763376
60113.1112.5015606056990.598439394300698
61125.1127.228506418664-2.12850641866381

\begin{tabular}{lllllllll}
\hline
Multiple Linear Regression - Actuals, Interpolation, and Residuals \tabularnewline
Time or Index & Actuals & InterpolationForecast & ResidualsPrediction Error \tabularnewline
1 & 143.7 & 130.261169508366 & 13.4388304916339 \tabularnewline
2 & 124.1 & 117.902864162792 & 6.19713583720838 \tabularnewline
3 & 129.2 & 116.166162457772 & 13.033837542228 \tabularnewline
4 & 121.9 & 111.950378156671 & 9.94962184332896 \tabularnewline
5 & 124.8 & 111.289042613569 & 13.5109573864314 \tabularnewline
6 & 129.6 & 114.434062604825 & 15.1659373951751 \tabularnewline
7 & 125.2 & 113.78268707921 & 11.4173129207901 \tabularnewline
8 & 124.8 & 115.744633838083 & 9.05536616191725 \tabularnewline
9 & 128.3 & 115.932517992131 & 12.3674820078693 \tabularnewline
10 & 129.4 & 117.125390151425 & 12.2746098485752 \tabularnewline
11 & 127.6 & 110.655623210524 & 16.9443767894758 \tabularnewline
12 & 123.7 & 111.703491371567 & 11.9965086284329 \tabularnewline
13 & 129 & 124.036229482135 & 4.96377051786495 \tabularnewline
14 & 118.4 & 108.086612582966 & 10.3133874170343 \tabularnewline
15 & 104.9 & 107.547014729144 & -2.6470147291443 \tabularnewline
16 & 101 & 105.086982743134 & -4.08698274313422 \tabularnewline
17 & 99.5 & 103.787191812726 & -4.28719181272603 \tabularnewline
18 & 106.7 & 109.725454123445 & -3.025454123445 \tabularnewline
19 & 101.6 & 106.999098589086 & -5.39909858908629 \tabularnewline
20 & 103.2 & 110.71679766305 & -7.51679766304995 \tabularnewline
21 & 104.6 & 113.059468749255 & -8.4594687492548 \tabularnewline
22 & 105.7 & 109.942767044235 & -4.24276704423512 \tabularnewline
23 & 101.1 & 106.106628575971 & -5.00662857597074 \tabularnewline
24 & 98.8 & 107.234303660427 & -8.43430366042684 \tabularnewline
25 & 107.6 & 117.332447915425 & -9.73244791542465 \tabularnewline
26 & 96.9 & 109.203909510751 & -12.3039095107508 \tabularnewline
27 & 106.4 & 111.297940129566 & -4.8979401295656 \tabularnewline
28 & 102 & 109.556170454274 & -7.55617045427448 \tabularnewline
29 & 105.7 & 107.218889519494 & -1.51888951949445 \tabularnewline
30 & 117 & 118.184988005246 & -1.18498800524622 \tabularnewline
31 & 116 & 116.815350168912 & -0.815350168912207 \tabularnewline
32 & 125.5 & 119.256138468264 & 6.24386153173563 \tabularnewline
33 & 120.2 & 123.753596486626 & -3.55359648662613 \tabularnewline
34 & 124.1 & 120.47728093478 & 3.62271906521997 \tabularnewline
35 & 111.4 & 119.913226326458 & -8.5132263264576 \tabularnewline
36 & 120.8 & 125.749509892294 & -4.94950989229363 \tabularnewline
37 & 120.2 & 122.67951178411 & -2.47951178411032 \tabularnewline
38 & 124.6 & 124.846066499742 & -0.246066499741675 \tabularnewline
39 & 125.4 & 127.01990404197 & -1.61990404196972 \tabularnewline
40 & 114.2 & 114.105165088828 & 0.0948349111720517 \tabularnewline
41 & 113.6 & 118.312051873932 & -4.71205187393188 \tabularnewline
42 & 110.5 & 123.532051873932 & -13.0320518739319 \tabularnewline
43 & 106.4 & 113.383652462144 & -6.98365246214379 \tabularnewline
44 & 117 & 122.767643098446 & -5.76764309844602 \tabularnewline
45 & 121.9 & 120.960354167163 & 0.939645832836533 \tabularnewline
46 & 114.9 & 121.514770939152 & -6.61477093915186 \tabularnewline
47 & 117.6 & 120.072840173284 & -2.47284017328405 \tabularnewline
48 & 117.6 & 116.811134470013 & 0.788865529986883 \tabularnewline
49 & 125.8 & 129.8621348913 & -4.06213489130003 \tabularnewline
50 & 114.9 & 118.86054724375 & -3.96054724375025 \tabularnewline
51 & 119.4 & 123.268978641548 & -3.86897864154843 \tabularnewline
52 & 117.3 & 115.701303557092 & 1.59869644290767 \tabularnewline
53 & 115 & 117.992824180279 & -2.99282418027901 \tabularnewline
54 & 120.9 & 118.823443392552 & 2.07655660744804 \tabularnewline
55 & 117 & 115.219211700648 & 1.78078829935217 \tabularnewline
56 & 117.8 & 119.814786932157 & -2.01478693215691 \tabularnewline
57 & 114 & 115.294062604825 & -1.29406260482493 \tabularnewline
58 & 114.4 & 119.439790930408 & -5.03979093040817 \tabularnewline
59 & 119.6 & 120.551681713763 & -0.951681713763376 \tabularnewline
60 & 113.1 & 112.501560605699 & 0.598439394300698 \tabularnewline
61 & 125.1 & 127.228506418664 & -2.12850641866381 \tabularnewline
\hline
\end{tabular}
%Source: https://freestatistics.org/blog/index.php?pk=147133&T=4

[TABLE]
[ROW][C]Multiple Linear Regression - Actuals, Interpolation, and Residuals[/C][/ROW]
[ROW][C]Time or Index[/C][C]Actuals[/C][C]InterpolationForecast[/C][C]ResidualsPrediction Error[/C][/ROW]
[ROW][C]1[/C][C]143.7[/C][C]130.261169508366[/C][C]13.4388304916339[/C][/ROW]
[ROW][C]2[/C][C]124.1[/C][C]117.902864162792[/C][C]6.19713583720838[/C][/ROW]
[ROW][C]3[/C][C]129.2[/C][C]116.166162457772[/C][C]13.033837542228[/C][/ROW]
[ROW][C]4[/C][C]121.9[/C][C]111.950378156671[/C][C]9.94962184332896[/C][/ROW]
[ROW][C]5[/C][C]124.8[/C][C]111.289042613569[/C][C]13.5109573864314[/C][/ROW]
[ROW][C]6[/C][C]129.6[/C][C]114.434062604825[/C][C]15.1659373951751[/C][/ROW]
[ROW][C]7[/C][C]125.2[/C][C]113.78268707921[/C][C]11.4173129207901[/C][/ROW]
[ROW][C]8[/C][C]124.8[/C][C]115.744633838083[/C][C]9.05536616191725[/C][/ROW]
[ROW][C]9[/C][C]128.3[/C][C]115.932517992131[/C][C]12.3674820078693[/C][/ROW]
[ROW][C]10[/C][C]129.4[/C][C]117.125390151425[/C][C]12.2746098485752[/C][/ROW]
[ROW][C]11[/C][C]127.6[/C][C]110.655623210524[/C][C]16.9443767894758[/C][/ROW]
[ROW][C]12[/C][C]123.7[/C][C]111.703491371567[/C][C]11.9965086284329[/C][/ROW]
[ROW][C]13[/C][C]129[/C][C]124.036229482135[/C][C]4.96377051786495[/C][/ROW]
[ROW][C]14[/C][C]118.4[/C][C]108.086612582966[/C][C]10.3133874170343[/C][/ROW]
[ROW][C]15[/C][C]104.9[/C][C]107.547014729144[/C][C]-2.6470147291443[/C][/ROW]
[ROW][C]16[/C][C]101[/C][C]105.086982743134[/C][C]-4.08698274313422[/C][/ROW]
[ROW][C]17[/C][C]99.5[/C][C]103.787191812726[/C][C]-4.28719181272603[/C][/ROW]
[ROW][C]18[/C][C]106.7[/C][C]109.725454123445[/C][C]-3.025454123445[/C][/ROW]
[ROW][C]19[/C][C]101.6[/C][C]106.999098589086[/C][C]-5.39909858908629[/C][/ROW]
[ROW][C]20[/C][C]103.2[/C][C]110.71679766305[/C][C]-7.51679766304995[/C][/ROW]
[ROW][C]21[/C][C]104.6[/C][C]113.059468749255[/C][C]-8.4594687492548[/C][/ROW]
[ROW][C]22[/C][C]105.7[/C][C]109.942767044235[/C][C]-4.24276704423512[/C][/ROW]
[ROW][C]23[/C][C]101.1[/C][C]106.106628575971[/C][C]-5.00662857597074[/C][/ROW]
[ROW][C]24[/C][C]98.8[/C][C]107.234303660427[/C][C]-8.43430366042684[/C][/ROW]
[ROW][C]25[/C][C]107.6[/C][C]117.332447915425[/C][C]-9.73244791542465[/C][/ROW]
[ROW][C]26[/C][C]96.9[/C][C]109.203909510751[/C][C]-12.3039095107508[/C][/ROW]
[ROW][C]27[/C][C]106.4[/C][C]111.297940129566[/C][C]-4.8979401295656[/C][/ROW]
[ROW][C]28[/C][C]102[/C][C]109.556170454274[/C][C]-7.55617045427448[/C][/ROW]
[ROW][C]29[/C][C]105.7[/C][C]107.218889519494[/C][C]-1.51888951949445[/C][/ROW]
[ROW][C]30[/C][C]117[/C][C]118.184988005246[/C][C]-1.18498800524622[/C][/ROW]
[ROW][C]31[/C][C]116[/C][C]116.815350168912[/C][C]-0.815350168912207[/C][/ROW]
[ROW][C]32[/C][C]125.5[/C][C]119.256138468264[/C][C]6.24386153173563[/C][/ROW]
[ROW][C]33[/C][C]120.2[/C][C]123.753596486626[/C][C]-3.55359648662613[/C][/ROW]
[ROW][C]34[/C][C]124.1[/C][C]120.47728093478[/C][C]3.62271906521997[/C][/ROW]
[ROW][C]35[/C][C]111.4[/C][C]119.913226326458[/C][C]-8.5132263264576[/C][/ROW]
[ROW][C]36[/C][C]120.8[/C][C]125.749509892294[/C][C]-4.94950989229363[/C][/ROW]
[ROW][C]37[/C][C]120.2[/C][C]122.67951178411[/C][C]-2.47951178411032[/C][/ROW]
[ROW][C]38[/C][C]124.6[/C][C]124.846066499742[/C][C]-0.246066499741675[/C][/ROW]
[ROW][C]39[/C][C]125.4[/C][C]127.01990404197[/C][C]-1.61990404196972[/C][/ROW]
[ROW][C]40[/C][C]114.2[/C][C]114.105165088828[/C][C]0.0948349111720517[/C][/ROW]
[ROW][C]41[/C][C]113.6[/C][C]118.312051873932[/C][C]-4.71205187393188[/C][/ROW]
[ROW][C]42[/C][C]110.5[/C][C]123.532051873932[/C][C]-13.0320518739319[/C][/ROW]
[ROW][C]43[/C][C]106.4[/C][C]113.383652462144[/C][C]-6.98365246214379[/C][/ROW]
[ROW][C]44[/C][C]117[/C][C]122.767643098446[/C][C]-5.76764309844602[/C][/ROW]
[ROW][C]45[/C][C]121.9[/C][C]120.960354167163[/C][C]0.939645832836533[/C][/ROW]
[ROW][C]46[/C][C]114.9[/C][C]121.514770939152[/C][C]-6.61477093915186[/C][/ROW]
[ROW][C]47[/C][C]117.6[/C][C]120.072840173284[/C][C]-2.47284017328405[/C][/ROW]
[ROW][C]48[/C][C]117.6[/C][C]116.811134470013[/C][C]0.788865529986883[/C][/ROW]
[ROW][C]49[/C][C]125.8[/C][C]129.8621348913[/C][C]-4.06213489130003[/C][/ROW]
[ROW][C]50[/C][C]114.9[/C][C]118.86054724375[/C][C]-3.96054724375025[/C][/ROW]
[ROW][C]51[/C][C]119.4[/C][C]123.268978641548[/C][C]-3.86897864154843[/C][/ROW]
[ROW][C]52[/C][C]117.3[/C][C]115.701303557092[/C][C]1.59869644290767[/C][/ROW]
[ROW][C]53[/C][C]115[/C][C]117.992824180279[/C][C]-2.99282418027901[/C][/ROW]
[ROW][C]54[/C][C]120.9[/C][C]118.823443392552[/C][C]2.07655660744804[/C][/ROW]
[ROW][C]55[/C][C]117[/C][C]115.219211700648[/C][C]1.78078829935217[/C][/ROW]
[ROW][C]56[/C][C]117.8[/C][C]119.814786932157[/C][C]-2.01478693215691[/C][/ROW]
[ROW][C]57[/C][C]114[/C][C]115.294062604825[/C][C]-1.29406260482493[/C][/ROW]
[ROW][C]58[/C][C]114.4[/C][C]119.439790930408[/C][C]-5.03979093040817[/C][/ROW]
[ROW][C]59[/C][C]119.6[/C][C]120.551681713763[/C][C]-0.951681713763376[/C][/ROW]
[ROW][C]60[/C][C]113.1[/C][C]112.501560605699[/C][C]0.598439394300698[/C][/ROW]
[ROW][C]61[/C][C]125.1[/C][C]127.228506418664[/C][C]-2.12850641866381[/C][/ROW]
[/TABLE]
Source: https://freestatistics.org/blog/index.php?pk=147133&T=4

Globally Unique Identifier (entire table): ba.freestatistics.org/blog/index.php?pk=147133&T=4

As an alternative you can also use a QR Code:  

The GUIDs for individual cells are displayed in the table below:

Multiple Linear Regression - Actuals, Interpolation, and Residuals
Time or IndexActualsInterpolationForecastResidualsPrediction Error
1143.7130.26116950836613.4388304916339
2124.1117.9028641627926.19713583720838
3129.2116.16616245777213.033837542228
4121.9111.9503781566719.94962184332896
5124.8111.28904261356913.5109573864314
6129.6114.43406260482515.1659373951751
7125.2113.7826870792111.4173129207901
8124.8115.7446338380839.05536616191725
9128.3115.93251799213112.3674820078693
10129.4117.12539015142512.2746098485752
11127.6110.65562321052416.9443767894758
12123.7111.70349137156711.9965086284329
13129124.0362294821354.96377051786495
14118.4108.08661258296610.3133874170343
15104.9107.547014729144-2.6470147291443
16101105.086982743134-4.08698274313422
1799.5103.787191812726-4.28719181272603
18106.7109.725454123445-3.025454123445
19101.6106.999098589086-5.39909858908629
20103.2110.71679766305-7.51679766304995
21104.6113.059468749255-8.4594687492548
22105.7109.942767044235-4.24276704423512
23101.1106.106628575971-5.00662857597074
2498.8107.234303660427-8.43430366042684
25107.6117.332447915425-9.73244791542465
2696.9109.203909510751-12.3039095107508
27106.4111.297940129566-4.8979401295656
28102109.556170454274-7.55617045427448
29105.7107.218889519494-1.51888951949445
30117118.184988005246-1.18498800524622
31116116.815350168912-0.815350168912207
32125.5119.2561384682646.24386153173563
33120.2123.753596486626-3.55359648662613
34124.1120.477280934783.62271906521997
35111.4119.913226326458-8.5132263264576
36120.8125.749509892294-4.94950989229363
37120.2122.67951178411-2.47951178411032
38124.6124.846066499742-0.246066499741675
39125.4127.01990404197-1.61990404196972
40114.2114.1051650888280.0948349111720517
41113.6118.312051873932-4.71205187393188
42110.5123.532051873932-13.0320518739319
43106.4113.383652462144-6.98365246214379
44117122.767643098446-5.76764309844602
45121.9120.9603541671630.939645832836533
46114.9121.514770939152-6.61477093915186
47117.6120.072840173284-2.47284017328405
48117.6116.8111344700130.788865529986883
49125.8129.8621348913-4.06213489130003
50114.9118.86054724375-3.96054724375025
51119.4123.268978641548-3.86897864154843
52117.3115.7013035570921.59869644290767
53115117.992824180279-2.99282418027901
54120.9118.8234433925522.07655660744804
55117115.2192117006481.78078829935217
56117.8119.814786932157-2.01478693215691
57114115.294062604825-1.29406260482493
58114.4119.439790930408-5.03979093040817
59119.6120.551681713763-0.951681713763376
60113.1112.5015606056990.598439394300698
61125.1127.228506418664-2.12850641866381


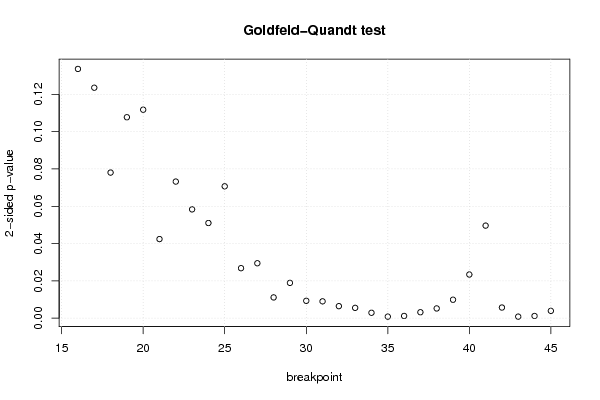
Goldfeld-Quandt test for Heteroskedasticity
p-valuesAlternative Hypothesis
breakpoint indexgreater2-sidedless
160.9331871882105140.1336256235789710.0668128117894856
170.938215793005240.1235684139895220.0617842069947609
180.9609625008509870.07807499829802550.0390374991490127
190.9461310961549430.1077378076901140.0538689038450568
200.944117170522460.1117656589550790.0558828294775394
210.9787896259899240.04242074802015130.0212103740100756
220.963377499443420.07324500111315810.0366225005565791
230.970829184143690.05834163171262190.0291708158563109
240.9744842025927850.05103159481442920.0255157974072146
250.9646447612957630.0707104774084740.035355238704237
260.98659152981140.02681694037719870.0134084701885993
270.9852717843577180.02945643128456370.0147282156422819
280.9944305905146430.01113881897071440.0055694094853572
290.9905355603945990.0189288792108030.0094644396054015
300.9953423391255070.00931532174898530.00465766087449265
310.995478496413420.009043007173158950.00452150358657948
320.996777409944290.006445180111420120.00322259005571006
330.997227128494210.005545743011581360.00277287150579068
340.9985441662147270.002911667570545830.00145583378527292
350.9995867335168070.0008265329663861970.000413266483193099
360.999403714291110.001192571417779920.000596285708889958
370.9984041538908920.003191692218216480.00159584610910824
380.9973850311600080.00522993767998320.0026149688399916
390.9950519892917920.009896021416415420.00494801070820771
400.9882934553996020.02341308920079620.0117065446003981
410.9751835826977910.04963283460441720.0248164173022086
420.997140704816960.005718590366081530.00285929518304077
430.9995833721684830.0008332556630342810.000416627831517141
440.9994071887929130.001185622414174250.000592811207087127
450.9980338603637860.003932279272427970.00196613963621399

\begin{tabular}{lllllllll}
\hline
Goldfeld-Quandt test for Heteroskedasticity \tabularnewline
p-values & Alternative Hypothesis \tabularnewline
breakpoint index & greater & 2-sided & less \tabularnewline
16 & 0.933187188210514 & 0.133625623578971 & 0.0668128117894856 \tabularnewline
17 & 0.93821579300524 & 0.123568413989522 & 0.0617842069947609 \tabularnewline
18 & 0.960962500850987 & 0.0780749982980255 & 0.0390374991490127 \tabularnewline
19 & 0.946131096154943 & 0.107737807690114 & 0.0538689038450568 \tabularnewline
20 & 0.94411717052246 & 0.111765658955079 & 0.0558828294775394 \tabularnewline
21 & 0.978789625989924 & 0.0424207480201513 & 0.0212103740100756 \tabularnewline
22 & 0.96337749944342 & 0.0732450011131581 & 0.0366225005565791 \tabularnewline
23 & 0.97082918414369 & 0.0583416317126219 & 0.0291708158563109 \tabularnewline
24 & 0.974484202592785 & 0.0510315948144292 & 0.0255157974072146 \tabularnewline
25 & 0.964644761295763 & 0.070710477408474 & 0.035355238704237 \tabularnewline
26 & 0.9865915298114 & 0.0268169403771987 & 0.0134084701885993 \tabularnewline
27 & 0.985271784357718 & 0.0294564312845637 & 0.0147282156422819 \tabularnewline
28 & 0.994430590514643 & 0.0111388189707144 & 0.0055694094853572 \tabularnewline
29 & 0.990535560394599 & 0.018928879210803 & 0.0094644396054015 \tabularnewline
30 & 0.995342339125507 & 0.0093153217489853 & 0.00465766087449265 \tabularnewline
31 & 0.99547849641342 & 0.00904300717315895 & 0.00452150358657948 \tabularnewline
32 & 0.99677740994429 & 0.00644518011142012 & 0.00322259005571006 \tabularnewline
33 & 0.99722712849421 & 0.00554574301158136 & 0.00277287150579068 \tabularnewline
34 & 0.998544166214727 & 0.00291166757054583 & 0.00145583378527292 \tabularnewline
35 & 0.999586733516807 & 0.000826532966386197 & 0.000413266483193099 \tabularnewline
36 & 0.99940371429111 & 0.00119257141777992 & 0.000596285708889958 \tabularnewline
37 & 0.998404153890892 & 0.00319169221821648 & 0.00159584610910824 \tabularnewline
38 & 0.997385031160008 & 0.0052299376799832 & 0.0026149688399916 \tabularnewline
39 & 0.995051989291792 & 0.00989602141641542 & 0.00494801070820771 \tabularnewline
40 & 0.988293455399602 & 0.0234130892007962 & 0.0117065446003981 \tabularnewline
41 & 0.975183582697791 & 0.0496328346044172 & 0.0248164173022086 \tabularnewline
42 & 0.99714070481696 & 0.00571859036608153 & 0.00285929518304077 \tabularnewline
43 & 0.999583372168483 & 0.000833255663034281 & 0.000416627831517141 \tabularnewline
44 & 0.999407188792913 & 0.00118562241417425 & 0.000592811207087127 \tabularnewline
45 & 0.998033860363786 & 0.00393227927242797 & 0.00196613963621399 \tabularnewline
\hline
\end{tabular}
%Source: https://freestatistics.org/blog/index.php?pk=147133&T=5

[TABLE]
[ROW][C]Goldfeld-Quandt test for Heteroskedasticity[/C][/ROW]
[ROW][C]p-values[/C][C]Alternative Hypothesis[/C][/ROW]
[ROW][C]breakpoint index[/C][C]greater[/C][C]2-sided[/C][C]less[/C][/ROW]
[ROW][C]16[/C][C]0.933187188210514[/C][C]0.133625623578971[/C][C]0.0668128117894856[/C][/ROW]
[ROW][C]17[/C][C]0.93821579300524[/C][C]0.123568413989522[/C][C]0.0617842069947609[/C][/ROW]
[ROW][C]18[/C][C]0.960962500850987[/C][C]0.0780749982980255[/C][C]0.0390374991490127[/C][/ROW]
[ROW][C]19[/C][C]0.946131096154943[/C][C]0.107737807690114[/C][C]0.0538689038450568[/C][/ROW]
[ROW][C]20[/C][C]0.94411717052246[/C][C]0.111765658955079[/C][C]0.0558828294775394[/C][/ROW]
[ROW][C]21[/C][C]0.978789625989924[/C][C]0.0424207480201513[/C][C]0.0212103740100756[/C][/ROW]
[ROW][C]22[/C][C]0.96337749944342[/C][C]0.0732450011131581[/C][C]0.0366225005565791[/C][/ROW]
[ROW][C]23[/C][C]0.97082918414369[/C][C]0.0583416317126219[/C][C]0.0291708158563109[/C][/ROW]
[ROW][C]24[/C][C]0.974484202592785[/C][C]0.0510315948144292[/C][C]0.0255157974072146[/C][/ROW]
[ROW][C]25[/C][C]0.964644761295763[/C][C]0.070710477408474[/C][C]0.035355238704237[/C][/ROW]
[ROW][C]26[/C][C]0.9865915298114[/C][C]0.0268169403771987[/C][C]0.0134084701885993[/C][/ROW]
[ROW][C]27[/C][C]0.985271784357718[/C][C]0.0294564312845637[/C][C]0.0147282156422819[/C][/ROW]
[ROW][C]28[/C][C]0.994430590514643[/C][C]0.0111388189707144[/C][C]0.0055694094853572[/C][/ROW]
[ROW][C]29[/C][C]0.990535560394599[/C][C]0.018928879210803[/C][C]0.0094644396054015[/C][/ROW]
[ROW][C]30[/C][C]0.995342339125507[/C][C]0.0093153217489853[/C][C]0.00465766087449265[/C][/ROW]
[ROW][C]31[/C][C]0.99547849641342[/C][C]0.00904300717315895[/C][C]0.00452150358657948[/C][/ROW]
[ROW][C]32[/C][C]0.99677740994429[/C][C]0.00644518011142012[/C][C]0.00322259005571006[/C][/ROW]
[ROW][C]33[/C][C]0.99722712849421[/C][C]0.00554574301158136[/C][C]0.00277287150579068[/C][/ROW]
[ROW][C]34[/C][C]0.998544166214727[/C][C]0.00291166757054583[/C][C]0.00145583378527292[/C][/ROW]
[ROW][C]35[/C][C]0.999586733516807[/C][C]0.000826532966386197[/C][C]0.000413266483193099[/C][/ROW]
[ROW][C]36[/C][C]0.99940371429111[/C][C]0.00119257141777992[/C][C]0.000596285708889958[/C][/ROW]
[ROW][C]37[/C][C]0.998404153890892[/C][C]0.00319169221821648[/C][C]0.00159584610910824[/C][/ROW]
[ROW][C]38[/C][C]0.997385031160008[/C][C]0.0052299376799832[/C][C]0.0026149688399916[/C][/ROW]
[ROW][C]39[/C][C]0.995051989291792[/C][C]0.00989602141641542[/C][C]0.00494801070820771[/C][/ROW]
[ROW][C]40[/C][C]0.988293455399602[/C][C]0.0234130892007962[/C][C]0.0117065446003981[/C][/ROW]
[ROW][C]41[/C][C]0.975183582697791[/C][C]0.0496328346044172[/C][C]0.0248164173022086[/C][/ROW]
[ROW][C]42[/C][C]0.99714070481696[/C][C]0.00571859036608153[/C][C]0.00285929518304077[/C][/ROW]
[ROW][C]43[/C][C]0.999583372168483[/C][C]0.000833255663034281[/C][C]0.000416627831517141[/C][/ROW]
[ROW][C]44[/C][C]0.999407188792913[/C][C]0.00118562241417425[/C][C]0.000592811207087127[/C][/ROW]
[ROW][C]45[/C][C]0.998033860363786[/C][C]0.00393227927242797[/C][C]0.00196613963621399[/C][/ROW]
[/TABLE]
Source: https://freestatistics.org/blog/index.php?pk=147133&T=5

Globally Unique Identifier (entire table): ba.freestatistics.org/blog/index.php?pk=147133&T=5

As an alternative you can also use a QR Code:  

The GUIDs for individual cells are displayed in the table below:

Goldfeld-Quandt test for Heteroskedasticity
p-valuesAlternative Hypothesis
breakpoint indexgreater2-sidedless
160.9331871882105140.1336256235789710.0668128117894856
170.938215793005240.1235684139895220.0617842069947609
180.9609625008509870.07807499829802550.0390374991490127
190.9461310961549430.1077378076901140.0538689038450568
200.944117170522460.1117656589550790.0558828294775394
210.9787896259899240.04242074802015130.0212103740100756
220.963377499443420.07324500111315810.0366225005565791
230.970829184143690.05834163171262190.0291708158563109
240.9744842025927850.05103159481442920.0255157974072146
250.9646447612957630.0707104774084740.035355238704237
260.98659152981140.02681694037719870.0134084701885993
270.9852717843577180.02945643128456370.0147282156422819
280.9944305905146430.01113881897071440.0055694094853572
290.9905355603945990.0189288792108030.0094644396054015
300.9953423391255070.00931532174898530.00465766087449265
310.995478496413420.009043007173158950.00452150358657948
320.996777409944290.006445180111420120.00322259005571006
330.997227128494210.005545743011581360.00277287150579068
340.9985441662147270.002911667570545830.00145583378527292
350.9995867335168070.0008265329663861970.000413266483193099
360.999403714291110.001192571417779920.000596285708889958
370.9984041538908920.003191692218216480.00159584610910824
380.9973850311600080.00522993767998320.0026149688399916
390.9950519892917920.009896021416415420.00494801070820771
400.9882934553996020.02341308920079620.0117065446003981
410.9751835826977910.04963283460441720.0248164173022086
420.997140704816960.005718590366081530.00285929518304077
430.9995833721684830.0008332556630342810.000416627831517141
440.9994071887929130.001185622414174250.000592811207087127
450.9980338603637860.003932279272427970.00196613963621399


Meta Analysis of Goldfeld-Quandt test for Heteroskedasticity
Description# significant tests% significant testsOK/NOK
1% type I error level140.466666666666667NOK
5% type I error level210.7NOK
10% type I error level260.866666666666667NOK

\begin{tabular}{lllllllll}
\hline
Meta Analysis of Goldfeld-Quandt test for Heteroskedasticity \tabularnewline
Description & # significant tests & % significant tests & OK/NOK \tabularnewline
1% type I error level & 14 & 0.466666666666667 & NOK \tabularnewline
5% type I error level & 21 & 0.7 & NOK \tabularnewline
10% type I error level & 26 & 0.866666666666667 & NOK \tabularnewline
\hline
\end{tabular}
%Source: https://freestatistics.org/blog/index.php?pk=147133&T=6

[TABLE]
[ROW][C]Meta Analysis of Goldfeld-Quandt test for Heteroskedasticity[/C][/ROW]
[ROW][C]Description[/C][C]# significant tests[/C][C]% significant tests[/C][C]OK/NOK[/C][/ROW]
[ROW][C]1% type I error level[/C][C]14[/C][C]0.466666666666667[/C][C]NOK[/C][/ROW]
[ROW][C]5% type I error level[/C][C]21[/C][C]0.7[/C][C]NOK[/C][/ROW]
[ROW][C]10% type I error level[/C][C]26[/C][C]0.866666666666667[/C][C]NOK[/C][/ROW]
[/TABLE]
Source: https://freestatistics.org/blog/index.php?pk=147133&T=6

Globally Unique Identifier (entire table): ba.freestatistics.org/blog/index.php?pk=147133&T=6

As an alternative you can also use a QR Code:  

The GUIDs for individual cells are displayed in the table below:

Meta Analysis of Goldfeld-Quandt test for Heteroskedasticity
Description# significant tests% significant testsOK/NOK
1% type I error level140.466666666666667NOK
5% type I error level210.7NOK
10% type I error level260.866666666666667NOK


Parameters (Session):
par1 = 2 ; par2 = Include Monthly Dummies ; par3 = No Linear Trend ;
Parameters (R input):
par1 = 2 ; par2 = Include Monthly Dummies ; par3 = No Linear Trend ;
R code (references can be found in the software module):
library(lattice)
library(lmtest)
n25 <- 25 #minimum number of obs. for Goldfeld-Quandt test
par1 <- as.numeric(par1)
x <- t(y)
k <- length(x[1,])
n <- length(x[,1])
x1 <- cbind(x[,par1], x[,1:k!=par1])
mycolnames <- c(colnames(x)[par1], colnames(x)[1:k!=par1])
colnames(x1) <- mycolnames #colnames(x)[par1]
x <- x1
if (par3 == 'First Differences'){
x2 <- array(0, dim=c(n-1,k), dimnames=list(1:(n-1), paste('(1-B)',colnames(x),sep='')))
for (i in 1:n-1) {
for (j in 1:k) {
x2[i,j] <- x[i+1,j] - x[i,j]
}
}
x <- x2
}
if (par2 == 'Include Monthly Dummies'){
x2 <- array(0, dim=c(n,11), dimnames=list(1:n, paste('M', seq(1:11), sep ='')))
for (i in 1:11){
x2[seq(i,n,12),i] <- 1
}
x <- cbind(x, x2)
}
if (par2 == 'Include Quarterly Dummies'){
x2 <- array(0, dim=c(n,3), dimnames=list(1:n, paste('Q', seq(1:3), sep ='')))
for (i in 1:3){
x2[seq(i,n,4),i] <- 1
}
x <- cbind(x, x2)
}
k <- length(x[1,])
if (par3 == 'Linear Trend'){
x <- cbind(x, c(1:n))
colnames(x)[k+1] <- 't'
}
x
k <- length(x[1,])
df <- as.data.frame(x)
(mylm <- lm(df))
(mysum <- summary(mylm))
if (n > n25) {
kp3 <- k + 3
nmkm3 <- n - k - 3
gqarr <- array(NA, dim=c(nmkm3-kp3+1,3))
numgqtests <- 0
numsignificant1 <- 0
numsignificant5 <- 0
numsignificant10 <- 0
for (mypoint in kp3:nmkm3) {
j <- 0
numgqtests <- numgqtests + 1
for (myalt in c('greater', 'two.sided', 'less')) {
j <- j + 1
gqarr[mypoint-kp3+1,j] <- gqtest(mylm, point=mypoint, alternative=myalt)$p.value
}
if (gqarr[mypoint-kp3+1,2] < 0.01) numsignificant1 <- numsignificant1 + 1
if (gqarr[mypoint-kp3+1,2] < 0.05) numsignificant5 <- numsignificant5 + 1
if (gqarr[mypoint-kp3+1,2] < 0.10) numsignificant10 <- numsignificant10 + 1
}
gqarr
}
bitmap(file='test0.png')
plot(x[,1], type='l', main='Actuals and Interpolation', ylab='value of Actuals and Interpolation (dots)', xlab='time or index')
points(x[,1]-mysum$resid)
grid()
dev.off()
bitmap(file='test1.png')
plot(mysum$resid, type='b', pch=19, main='Residuals', ylab='value of Residuals', xlab='time or index')
grid()
dev.off()
bitmap(file='test2.png')
hist(mysum$resid, main='Residual Histogram', xlab='values of Residuals')
grid()
dev.off()
bitmap(file='test3.png')
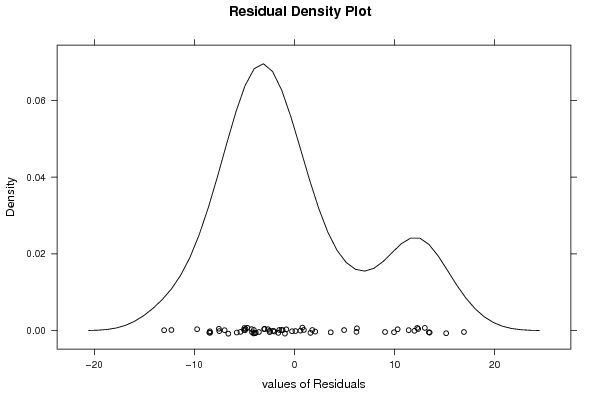
densityplot(~mysum$resid,col='black',main='Residual Density Plot', xlab='values of Residuals')
dev.off()
bitmap(file='test4.png')
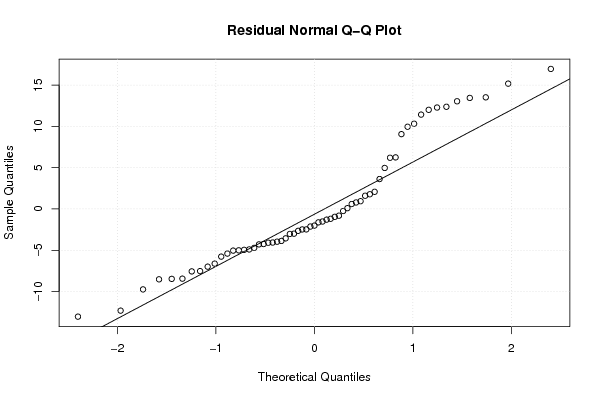
qqnorm(mysum$resid, main='Residual Normal Q-Q Plot')
qqline(mysum$resid)
grid()
dev.off()
(myerror <- as.ts(mysum$resid))
bitmap(file='test5.png')
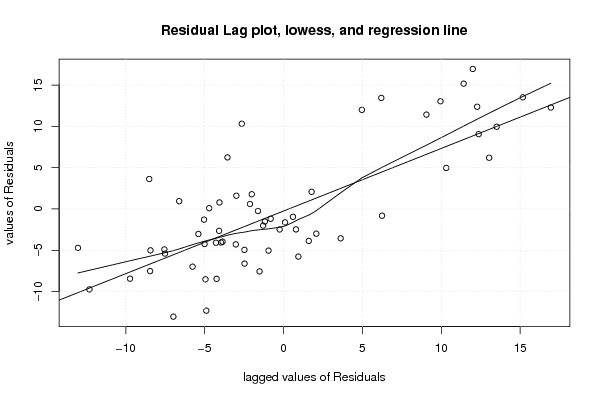
dum <- cbind(lag(myerror,k=1),myerror)
dum
dum1 <- dum[2:length(myerror),]
dum1
z <- as.data.frame(dum1)
z
plot(z,main=paste('Residual Lag plot, lowess, and regression line'), ylab='values of Residuals', xlab='lagged values of Residuals')
lines(lowess(z))
abline(lm(z))
grid()
dev.off()
bitmap(file='test6.png')
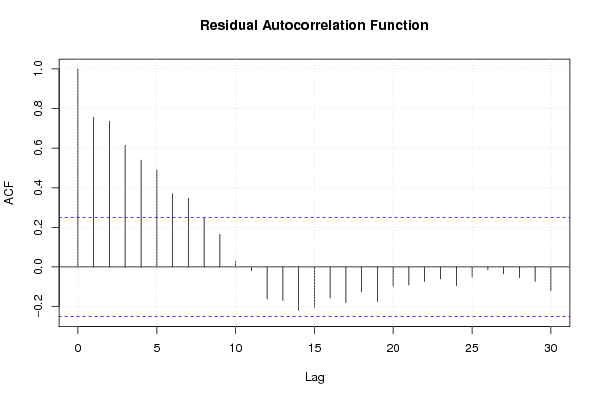
acf(mysum$resid, lag.max=length(mysum$resid)/2, main='Residual Autocorrelation Function')
grid()
dev.off()
bitmap(file='test7.png')
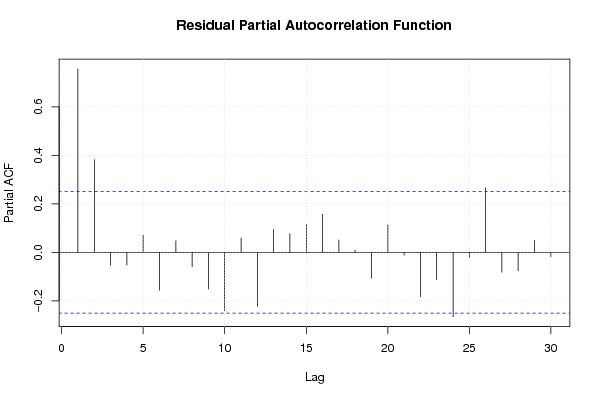
pacf(mysum$resid, lag.max=length(mysum$resid)/2, main='Residual Partial Autocorrelation Function')
grid()
dev.off()
bitmap(file='test8.png')
opar <- par(mfrow = c(2,2), oma = c(0, 0, 1.1, 0))
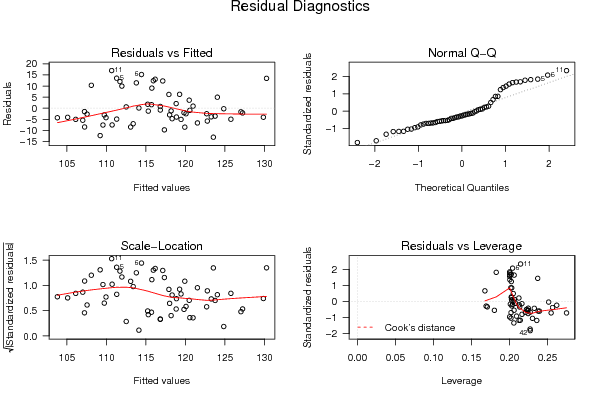
plot(mylm, las = 1, sub='Residual Diagnostics')
par(opar)
dev.off()
if (n > n25) {
bitmap(file='test9.png')
plot(kp3:nmkm3,gqarr[,2], main='Goldfeld-Quandt test',ylab='2-sided p-value',xlab='breakpoint')
grid()
dev.off()
}
load(file='createtable')
a<-table.start()
a<-table.row.start(a)
a<-table.element(a, 'Multiple Linear Regression - Estimated Regression Equation', 1, TRUE)
a<-table.row.end(a)
myeq <- colnames(x)[1]
myeq <- paste(myeq, '[t] = ', sep='')
for (i in 1:k){
if (mysum$coefficients[i,1] > 0) myeq <- paste(myeq, '+', '')
myeq <- paste(myeq, mysum$coefficients[i,1], sep=' ')
if (rownames(mysum$coefficients)[i] != '(Intercept)') {
myeq <- paste(myeq, rownames(mysum$coefficients)[i], sep='')
if (rownames(mysum$coefficients)[i] != 't') myeq <- paste(myeq, '[t]', sep='')
}
}
myeq <- paste(myeq, ' + e[t]')
a<-table.row.start(a)
a<-table.element(a, myeq)
a<-table.row.end(a)
a<-table.end(a)
table.save(a,file='mytable1.tab')
a<-table.start()
a<-table.row.start(a)
a<-table.element(a,hyperlink('ols1.htm','Multiple Linear Regression - Ordinary Least Squares',''), 6, TRUE)
a<-table.row.end(a)
a<-table.row.start(a)
a<-table.element(a,'Variable',header=TRUE)
a<-table.element(a,'Parameter',header=TRUE)
a<-table.element(a,'S.D.',header=TRUE)
a<-table.element(a,'T-STAT
H0: parameter = 0',header=TRUE)
a<-table.element(a,'2-tail p-value',header=TRUE)
a<-table.element(a,'1-tail p-value',header=TRUE)
a<-table.row.end(a)
for (i in 1:k){
a<-table.row.start(a)
a<-table.element(a,rownames(mysum$coefficients)[i],header=TRUE)
a<-table.element(a,mysum$coefficients[i,1])
a<-table.element(a, round(mysum$coefficients[i,2],6))
a<-table.element(a, round(mysum$coefficients[i,3],4))
a<-table.element(a, round(mysum$coefficients[i,4],6))
a<-table.element(a, round(mysum$coefficients[i,4]/2,6))
a<-table.row.end(a)
}
a<-table.end(a)
table.save(a,file='mytable2.tab')
a<-table.start()
a<-table.row.start(a)
a<-table.element(a, 'Multiple Linear Regression - Regression Statistics', 2, TRUE)
a<-table.row.end(a)
a<-table.row.start(a)
a<-table.element(a, 'Multiple R',1,TRUE)
a<-table.element(a, sqrt(mysum$r.squared))
a<-table.row.end(a)
a<-table.row.start(a)
a<-table.element(a, 'R-squared',1,TRUE)
a<-table.element(a, mysum$r.squared)
a<-table.row.end(a)
a<-table.row.start(a)
a<-table.element(a, 'Adjusted R-squared',1,TRUE)
a<-table.element(a, mysum$adj.r.squared)
a<-table.row.end(a)
a<-table.row.start(a)
a<-table.element(a, 'F-TEST (value)',1,TRUE)
a<-table.element(a, mysum$fstatistic[1])
a<-table.row.end(a)
a<-table.row.start(a)
a<-table.element(a, 'F-TEST (DF numerator)',1,TRUE)
a<-table.element(a, mysum$fstatistic[2])
a<-table.row.end(a)
a<-table.row.start(a)
a<-table.element(a, 'F-TEST (DF denominator)',1,TRUE)
a<-table.element(a, mysum$fstatistic[3])
a<-table.row.end(a)
a<-table.row.start(a)
a<-table.element(a, 'p-value',1,TRUE)
a<-table.element(a, 1-pf(mysum$fstatistic[1],mysum$fstatistic[2],mysum$fstatistic[3]))
a<-table.row.end(a)
a<-table.row.start(a)
a<-table.element(a, 'Multiple Linear Regression - Residual Statistics', 2, TRUE)
a<-table.row.end(a)
a<-table.row.start(a)
a<-table.element(a, 'Residual Standard Deviation',1,TRUE)
a<-table.element(a, mysum$sigma)
a<-table.row.end(a)
a<-table.row.start(a)
a<-table.element(a, 'Sum Squared Residuals',1,TRUE)
a<-table.element(a, sum(myerror*myerror))
a<-table.row.end(a)
a<-table.end(a)
table.save(a,file='mytable3.tab')
a<-table.start()
a<-table.row.start(a)
a<-table.element(a, 'Multiple Linear Regression - Actuals, Interpolation, and Residuals', 4, TRUE)
a<-table.row.end(a)
a<-table.row.start(a)
a<-table.element(a, 'Time or Index', 1, TRUE)
a<-table.element(a, 'Actuals', 1, TRUE)
a<-table.element(a, 'Interpolation
Forecast', 1, TRUE)
a<-table.element(a, 'Residuals
Prediction Error', 1, TRUE)
a<-table.row.end(a)
for (i in 1:n) {
a<-table.row.start(a)
a<-table.element(a,i, 1, TRUE)
a<-table.element(a,x[i])
a<-table.element(a,x[i]-mysum$resid[i])
a<-table.element(a,mysum$resid[i])
a<-table.row.end(a)
}
a<-table.end(a)
table.save(a,file='mytable4.tab')
if (n > n25) {
a<-table.start()
a<-table.row.start(a)
a<-table.element(a,'Goldfeld-Quandt test for Heteroskedasticity',4,TRUE)
a<-table.row.end(a)
a<-table.row.start(a)
a<-table.element(a,'p-values',header=TRUE)
a<-table.element(a,'Alternative Hypothesis',3,header=TRUE)
a<-table.row.end(a)
a<-table.row.start(a)
a<-table.element(a,'breakpoint index',header=TRUE)
a<-table.element(a,'greater',header=TRUE)
a<-table.element(a,'2-sided',header=TRUE)
a<-table.element(a,'less',header=TRUE)
a<-table.row.end(a)
for (mypoint in kp3:nmkm3) {
a<-table.row.start(a)
a<-table.element(a,mypoint,header=TRUE)
a<-table.element(a,gqarr[mypoint-kp3+1,1])
a<-table.element(a,gqarr[mypoint-kp3+1,2])
a<-table.element(a,gqarr[mypoint-kp3+1,3])
a<-table.row.end(a)
}
a<-table.end(a)
table.save(a,file='mytable5.tab')
a<-table.start()
a<-table.row.start(a)
a<-table.element(a,'Meta Analysis of Goldfeld-Quandt test for Heteroskedasticity',4,TRUE)
a<-table.row.end(a)
a<-table.row.start(a)
a<-table.element(a,'Description',header=TRUE)
a<-table.element(a,'# significant tests',header=TRUE)
a<-table.element(a,'% significant tests',header=TRUE)
a<-table.element(a,'OK/NOK',header=TRUE)
a<-table.row.end(a)
a<-table.row.start(a)
a<-table.element(a,'1% type I error level',header=TRUE)
a<-table.element(a,numsignificant1)
a<-table.element(a,numsignificant1/numgqtests)
if (numsignificant1/numgqtests < 0.01) dum <- 'OK' else dum <- 'NOK'
a<-table.element(a,dum)
a<-table.row.end(a)
a<-table.row.start(a)
a<-table.element(a,'5% type I error level',header=TRUE)
a<-table.element(a,numsignificant5)
a<-table.element(a,numsignificant5/numgqtests)
if (numsignificant5/numgqtests < 0.05) dum <- 'OK' else dum <- 'NOK'
a<-table.element(a,dum)
a<-table.row.end(a)
a<-table.row.start(a)
a<-table.element(a,'10% type I error level',header=TRUE)
a<-table.element(a,numsignificant10)
a<-table.element(a,numsignificant10/numgqtests)
if (numsignificant10/numgqtests < 0.1) dum <- 'OK' else dum <- 'NOK'
a<-table.element(a,dum)
a<-table.row.end(a)
a<-table.end(a)
table.save(a,file='mytable6.tab')
}