Free Statistics
of Irreproducible Research!
Description of Statistical Computation | |||||||||||||||||||||
|---|---|---|---|---|---|---|---|---|---|---|---|---|---|---|---|---|---|---|---|---|---|
| Author's title | |||||||||||||||||||||
| Author | *The author of this computation has been verified* | ||||||||||||||||||||
| R Software Module | rwasp_backtobackhist.wasp | ||||||||||||||||||||
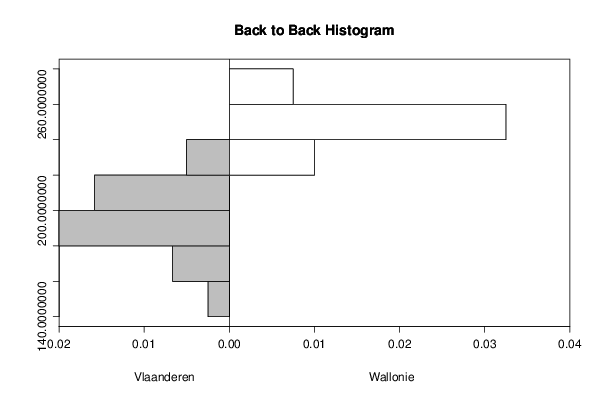
| Title produced by software | Back to Back Histogram | ||||||||||||||||||||
| Date of computation | Tue, 11 Dec 2012 12:55:23 -0500 | ||||||||||||||||||||
| Cite this page as follows | Statistical Computations at FreeStatistics.org, Office for Research Development and Education, URL https://freestatistics.org/blog/index.php?v=date/2012/Dec/11/t13552485399zdzxbrtmfvtqw2.htm/, Retrieved Thu, 06 Jun 2024 05:10:57 +0000 | ||||||||||||||||||||
| Statistical Computations at FreeStatistics.org, Office for Research Development and Education, URL https://freestatistics.org/blog/index.php?pk=198598, Retrieved Thu, 06 Jun 2024 05:10:57 +0000 | |||||||||||||||||||||
| QR Codes: | |||||||||||||||||||||
|
| |||||||||||||||||||||
| Original text written by user: | |||||||||||||||||||||
| IsPrivate? | No (this computation is public) | ||||||||||||||||||||
| User-defined keywords | |||||||||||||||||||||
| Estimated Impact | 92 | ||||||||||||||||||||
Tree of Dependent Computations | |||||||||||||||||||||
| Family? (F = Feedback message, R = changed R code, M = changed R Module, P = changed Parameters, D = changed Data) | |||||||||||||||||||||
| - [Notched Boxplots] [Screen Width and ...] [2010-09-25 10:03:47] [b98453cac15ba1066b407e146608df68] - RM D [Back to Back Histogram] [Werkloosheid Vlaa...] [2012-12-11 17:55:23] [b650a28572edc4a1d205c228043a3295] [Current] | |||||||||||||||||||||
| Feedback Forum | |||||||||||||||||||||
Post a new message | |||||||||||||||||||||
Dataset | |||||||||||||||||||||
| Dataseries X: | |||||||||||||||||||||
207.221 210.506 216.222 224.325 214.419 189.422 188.222 191.395 195.978 201.920 203.583 191.987 186.424 191.568 200.140 211.451 211.524 182.510 182.414 187.827 192.684 198.480 203.089 199.834 195.770 203.555 211.868 229.527 229.139 198.563 195.722 202.196 205.816 212.588 214.320 220.376 204.442 206.903 214.126 226.899 223.532 195.309 186.005 188.906 191.563 189.226 186.412 178.037 166.827 169.362 174.330 187.069 186.530 158.114 151.001 159.612 161.914 164.182 169.701 171.297 | |||||||||||||||||||||
| Dataseries Y: | |||||||||||||||||||||
247.182 251.362 257.784 264.661 258.558 235.162 235.042 238.575 242.254 249.192 250.333 242.470 244.894 248.197 254.511 261.678 253.299 231.770 233.271 237.520 242.082 243.287 246.526 245.622 247.447 252.470 262.976 267.145 260.951 239.171 238.454 245.385 252.487 257.375 261.240 252.222 250.627 255.159 263.948 268.145 263.281 242.967 241.326 248.985 247.599 247.323 246.546 243.985 241.478 242.936 251.178 254.016 249.999 229.521 228.793 239.709 239.494 251.846 253.376 248.284 | |||||||||||||||||||||
Tables (Output of Computation) | |||||||||||||||||||||
| |||||||||||||||||||||
Figures (Output of Computation) | |||||||||||||||||||||
Input Parameters & R Code | |||||||||||||||||||||
| Parameters (Session): | |||||||||||||||||||||
| par1 = grey ; | |||||||||||||||||||||
| Parameters (R input): | |||||||||||||||||||||
| par1 = grey ; par2 = white ; par3 = TRUE ; par4 = Vlaanderen ; par5 = Wallonie ; | |||||||||||||||||||||
| R code (references can be found in the software module): | |||||||||||||||||||||
par5 <- 'Wallonie' | |||||||||||||||||||||