Free Statistics

of Irreproducible Research!

Author's title

Author*Unverified author*
R Software Modulerwasp_autocorrelation.wasp
Title produced by software(Partial) Autocorrelation Function
Date of computationSun, 07 Dec 2014 09:35:20 +0000
Cite this page as followsStatistical Computations at FreeStatistics.org, Office for Research Development and Education, URL https://freestatistics.org/blog/index.php?v=date/2014/Dec/07/t1417945001ptxvkfwio4ibn4x.htm/, Retrieved Fri, 01 Nov 2024 00:09:15 +0000
Statistical Computations at FreeStatistics.org, Office for Research Development and Education, URL https://freestatistics.org/blog/index.php?pk=263691, Retrieved Fri, 01 Nov 2024 00:09:15 +0000
QR Codes:

Original text written by user:
IsPrivate?No (this computation is public)
User-defined keywords
Estimated Impact135
Family? (F = Feedback message, R = changed R code, M = changed R Module, P = changed Parameters, D = changed Data)
-       [(Partial) Autocorrelation Function] [] [2014-12-07 09:35:20] [7a6c09eb8232161d54860d64a56e9131] [Current]
Feedback Forum

Post a new message
Dataseries X:
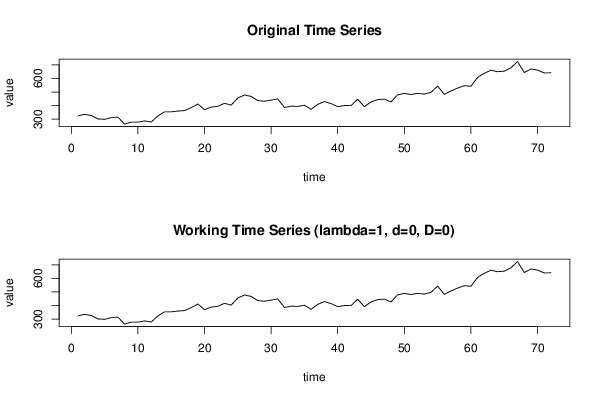
324
336
327
302
299
311
315
264
278
278
287
279
324
354
354
360
363
385
412
370
389
395
417
404
456
478
468
437
432
441
449
386
396
394
403
373
409
430
415
392
401
400
447
392
427
444
448
427
480
490
482
490
485
498
544
483
508
529
547
543
608
638
661
650
654
678
725
644
670
662
641
642


Summary of computational transaction
Raw Inputview raw input (R code)
Raw Outputview raw output of R engine
Computing time2 seconds
R Server'George Udny Yule' @ yule.wessa.net

\begin{tabular}{lllllllll}
\hline
Summary of computational transaction \tabularnewline
Raw Input & view raw input (R code)  \tabularnewline
Raw Output & view raw output of R engine  \tabularnewline
Computing time & 2 seconds \tabularnewline
R Server & 'George Udny Yule' @ yule.wessa.net \tabularnewline
\hline
\end{tabular}
%Source: https://freestatistics.org/blog/index.php?pk=263691&T=0

[TABLE]
[ROW][C]Summary of computational transaction[/C][/ROW]
[ROW][C]Raw Input[/C][C]view raw input (R code) [/C][/ROW]
[ROW][C]Raw Output[/C][C]view raw output of R engine [/C][/ROW]
[ROW][C]Computing time[/C][C]2 seconds[/C][/ROW]
[ROW][C]R Server[/C][C]'George Udny Yule' @ yule.wessa.net[/C][/ROW]
[/TABLE]
Source: https://freestatistics.org/blog/index.php?pk=263691&T=0

Globally Unique Identifier (entire table): ba.freestatistics.org/blog/index.php?pk=263691&T=0

As an alternative you can also use a QR Code:  

The GUIDs for individual cells are displayed in the table below:

Summary of computational transaction
Raw Inputview raw input (R code)
Raw Outputview raw output of R engine
Computing time2 seconds
R Server'George Udny Yule' @ yule.wessa.net


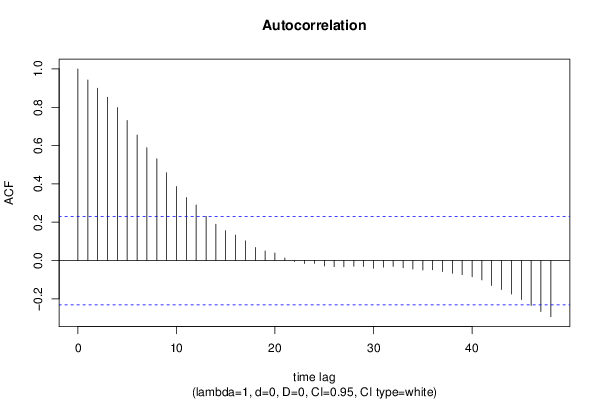
Autocorrelation Function
Time lag kACF(k)T-STATP-value
10.9419467.99270
20.8990377.62860
30.8521857.2310
40.7991756.78120
50.7308686.20160
60.6548365.55650
70.5884324.9932e-06
80.5313644.50881.2e-05
90.4578013.88460.000113
100.3866573.28090.000799
110.3292742.7940.003333
120.2901492.4620.008106
130.230411.95510.027227
140.1893461.60670.056254
150.155821.32220.095147
160.1324041.12350.132482
170.1026710.87120.193273
180.0683210.57970.281956
190.0494120.41930.338131
200.0395380.33550.369114
210.0130220.11050.456164
22-0.004854-0.04120.483631
23-0.015657-0.13290.44734
24-0.015242-0.12930.448727
25-0.028461-0.24150.404926
26-0.032207-0.27330.392707
27-0.032934-0.27950.390347
28-0.030076-0.25520.399647
29-0.031267-0.26530.395765
30-0.040289-0.34190.366724
31-0.034758-0.29490.384447
32-0.030925-0.26240.396879
33-0.037547-0.31860.375477
34-0.04425-0.37550.354207
35-0.050003-0.42430.336311
36-0.048141-0.40850.342065
37-0.057778-0.49030.312721
38-0.066756-0.56640.286426
39-0.073949-0.62750.266165
40-0.084884-0.72030.236846
41-0.101171-0.85850.196742
42-0.130447-1.10690.136015
43-0.151445-1.28510.101446
44-0.174989-1.48480.070976
45-0.203834-1.72960.043995
46-0.234966-1.99380.024984
47-0.26654-2.26170.013369
48-0.293135-2.48730.007594

\begin{tabular}{lllllllll}
\hline
Autocorrelation Function \tabularnewline
Time lag k & ACF(k) & T-STAT & P-value \tabularnewline
1 & 0.941946 & 7.9927 & 0 \tabularnewline
2 & 0.899037 & 7.6286 & 0 \tabularnewline
3 & 0.852185 & 7.231 & 0 \tabularnewline
4 & 0.799175 & 6.7812 & 0 \tabularnewline
5 & 0.730868 & 6.2016 & 0 \tabularnewline
6 & 0.654836 & 5.5565 & 0 \tabularnewline
7 & 0.588432 & 4.993 & 2e-06 \tabularnewline
8 & 0.531364 & 4.5088 & 1.2e-05 \tabularnewline
9 & 0.457801 & 3.8846 & 0.000113 \tabularnewline
10 & 0.386657 & 3.2809 & 0.000799 \tabularnewline
11 & 0.329274 & 2.794 & 0.003333 \tabularnewline
12 & 0.290149 & 2.462 & 0.008106 \tabularnewline
13 & 0.23041 & 1.9551 & 0.027227 \tabularnewline
14 & 0.189346 & 1.6067 & 0.056254 \tabularnewline
15 & 0.15582 & 1.3222 & 0.095147 \tabularnewline
16 & 0.132404 & 1.1235 & 0.132482 \tabularnewline
17 & 0.102671 & 0.8712 & 0.193273 \tabularnewline
18 & 0.068321 & 0.5797 & 0.281956 \tabularnewline
19 & 0.049412 & 0.4193 & 0.338131 \tabularnewline
20 & 0.039538 & 0.3355 & 0.369114 \tabularnewline
21 & 0.013022 & 0.1105 & 0.456164 \tabularnewline
22 & -0.004854 & -0.0412 & 0.483631 \tabularnewline
23 & -0.015657 & -0.1329 & 0.44734 \tabularnewline
24 & -0.015242 & -0.1293 & 0.448727 \tabularnewline
25 & -0.028461 & -0.2415 & 0.404926 \tabularnewline
26 & -0.032207 & -0.2733 & 0.392707 \tabularnewline
27 & -0.032934 & -0.2795 & 0.390347 \tabularnewline
28 & -0.030076 & -0.2552 & 0.399647 \tabularnewline
29 & -0.031267 & -0.2653 & 0.395765 \tabularnewline
30 & -0.040289 & -0.3419 & 0.366724 \tabularnewline
31 & -0.034758 & -0.2949 & 0.384447 \tabularnewline
32 & -0.030925 & -0.2624 & 0.396879 \tabularnewline
33 & -0.037547 & -0.3186 & 0.375477 \tabularnewline
34 & -0.04425 & -0.3755 & 0.354207 \tabularnewline
35 & -0.050003 & -0.4243 & 0.336311 \tabularnewline
36 & -0.048141 & -0.4085 & 0.342065 \tabularnewline
37 & -0.057778 & -0.4903 & 0.312721 \tabularnewline
38 & -0.066756 & -0.5664 & 0.286426 \tabularnewline
39 & -0.073949 & -0.6275 & 0.266165 \tabularnewline
40 & -0.084884 & -0.7203 & 0.236846 \tabularnewline
41 & -0.101171 & -0.8585 & 0.196742 \tabularnewline
42 & -0.130447 & -1.1069 & 0.136015 \tabularnewline
43 & -0.151445 & -1.2851 & 0.101446 \tabularnewline
44 & -0.174989 & -1.4848 & 0.070976 \tabularnewline
45 & -0.203834 & -1.7296 & 0.043995 \tabularnewline
46 & -0.234966 & -1.9938 & 0.024984 \tabularnewline
47 & -0.26654 & -2.2617 & 0.013369 \tabularnewline
48 & -0.293135 & -2.4873 & 0.007594 \tabularnewline
\hline
\end{tabular}
%Source: https://freestatistics.org/blog/index.php?pk=263691&T=1

[TABLE]
[ROW][C]Autocorrelation Function[/C][/ROW]
[ROW][C]Time lag k[/C][C]ACF(k)[/C][C]T-STAT[/C][C]P-value[/C][/ROW]
[ROW][C]1[/C][C]0.941946[/C][C]7.9927[/C][C]0[/C][/ROW]
[ROW][C]2[/C][C]0.899037[/C][C]7.6286[/C][C]0[/C][/ROW]
[ROW][C]3[/C][C]0.852185[/C][C]7.231[/C][C]0[/C][/ROW]
[ROW][C]4[/C][C]0.799175[/C][C]6.7812[/C][C]0[/C][/ROW]
[ROW][C]5[/C][C]0.730868[/C][C]6.2016[/C][C]0[/C][/ROW]
[ROW][C]6[/C][C]0.654836[/C][C]5.5565[/C][C]0[/C][/ROW]
[ROW][C]7[/C][C]0.588432[/C][C]4.993[/C][C]2e-06[/C][/ROW]
[ROW][C]8[/C][C]0.531364[/C][C]4.5088[/C][C]1.2e-05[/C][/ROW]
[ROW][C]9[/C][C]0.457801[/C][C]3.8846[/C][C]0.000113[/C][/ROW]
[ROW][C]10[/C][C]0.386657[/C][C]3.2809[/C][C]0.000799[/C][/ROW]
[ROW][C]11[/C][C]0.329274[/C][C]2.794[/C][C]0.003333[/C][/ROW]
[ROW][C]12[/C][C]0.290149[/C][C]2.462[/C][C]0.008106[/C][/ROW]
[ROW][C]13[/C][C]0.23041[/C][C]1.9551[/C][C]0.027227[/C][/ROW]
[ROW][C]14[/C][C]0.189346[/C][C]1.6067[/C][C]0.056254[/C][/ROW]
[ROW][C]15[/C][C]0.15582[/C][C]1.3222[/C][C]0.095147[/C][/ROW]
[ROW][C]16[/C][C]0.132404[/C][C]1.1235[/C][C]0.132482[/C][/ROW]
[ROW][C]17[/C][C]0.102671[/C][C]0.8712[/C][C]0.193273[/C][/ROW]
[ROW][C]18[/C][C]0.068321[/C][C]0.5797[/C][C]0.281956[/C][/ROW]
[ROW][C]19[/C][C]0.049412[/C][C]0.4193[/C][C]0.338131[/C][/ROW]
[ROW][C]20[/C][C]0.039538[/C][C]0.3355[/C][C]0.369114[/C][/ROW]
[ROW][C]21[/C][C]0.013022[/C][C]0.1105[/C][C]0.456164[/C][/ROW]
[ROW][C]22[/C][C]-0.004854[/C][C]-0.0412[/C][C]0.483631[/C][/ROW]
[ROW][C]23[/C][C]-0.015657[/C][C]-0.1329[/C][C]0.44734[/C][/ROW]
[ROW][C]24[/C][C]-0.015242[/C][C]-0.1293[/C][C]0.448727[/C][/ROW]
[ROW][C]25[/C][C]-0.028461[/C][C]-0.2415[/C][C]0.404926[/C][/ROW]
[ROW][C]26[/C][C]-0.032207[/C][C]-0.2733[/C][C]0.392707[/C][/ROW]
[ROW][C]27[/C][C]-0.032934[/C][C]-0.2795[/C][C]0.390347[/C][/ROW]
[ROW][C]28[/C][C]-0.030076[/C][C]-0.2552[/C][C]0.399647[/C][/ROW]
[ROW][C]29[/C][C]-0.031267[/C][C]-0.2653[/C][C]0.395765[/C][/ROW]
[ROW][C]30[/C][C]-0.040289[/C][C]-0.3419[/C][C]0.366724[/C][/ROW]
[ROW][C]31[/C][C]-0.034758[/C][C]-0.2949[/C][C]0.384447[/C][/ROW]
[ROW][C]32[/C][C]-0.030925[/C][C]-0.2624[/C][C]0.396879[/C][/ROW]
[ROW][C]33[/C][C]-0.037547[/C][C]-0.3186[/C][C]0.375477[/C][/ROW]
[ROW][C]34[/C][C]-0.04425[/C][C]-0.3755[/C][C]0.354207[/C][/ROW]
[ROW][C]35[/C][C]-0.050003[/C][C]-0.4243[/C][C]0.336311[/C][/ROW]
[ROW][C]36[/C][C]-0.048141[/C][C]-0.4085[/C][C]0.342065[/C][/ROW]
[ROW][C]37[/C][C]-0.057778[/C][C]-0.4903[/C][C]0.312721[/C][/ROW]
[ROW][C]38[/C][C]-0.066756[/C][C]-0.5664[/C][C]0.286426[/C][/ROW]
[ROW][C]39[/C][C]-0.073949[/C][C]-0.6275[/C][C]0.266165[/C][/ROW]
[ROW][C]40[/C][C]-0.084884[/C][C]-0.7203[/C][C]0.236846[/C][/ROW]
[ROW][C]41[/C][C]-0.101171[/C][C]-0.8585[/C][C]0.196742[/C][/ROW]
[ROW][C]42[/C][C]-0.130447[/C][C]-1.1069[/C][C]0.136015[/C][/ROW]
[ROW][C]43[/C][C]-0.151445[/C][C]-1.2851[/C][C]0.101446[/C][/ROW]
[ROW][C]44[/C][C]-0.174989[/C][C]-1.4848[/C][C]0.070976[/C][/ROW]
[ROW][C]45[/C][C]-0.203834[/C][C]-1.7296[/C][C]0.043995[/C][/ROW]
[ROW][C]46[/C][C]-0.234966[/C][C]-1.9938[/C][C]0.024984[/C][/ROW]
[ROW][C]47[/C][C]-0.26654[/C][C]-2.2617[/C][C]0.013369[/C][/ROW]
[ROW][C]48[/C][C]-0.293135[/C][C]-2.4873[/C][C]0.007594[/C][/ROW]
[/TABLE]
Source: https://freestatistics.org/blog/index.php?pk=263691&T=1

Globally Unique Identifier (entire table): ba.freestatistics.org/blog/index.php?pk=263691&T=1

As an alternative you can also use a QR Code:  

The GUIDs for individual cells are displayed in the table below:

Autocorrelation Function
Time lag kACF(k)T-STATP-value
10.9419467.99270
20.8990377.62860
30.8521857.2310
40.7991756.78120
50.7308686.20160
60.6548365.55650
70.5884324.9932e-06
80.5313644.50881.2e-05
90.4578013.88460.000113
100.3866573.28090.000799
110.3292742.7940.003333
120.2901492.4620.008106
130.230411.95510.027227
140.1893461.60670.056254
150.155821.32220.095147
160.1324041.12350.132482
170.1026710.87120.193273
180.0683210.57970.281956
190.0494120.41930.338131
200.0395380.33550.369114
210.0130220.11050.456164
22-0.004854-0.04120.483631
23-0.015657-0.13290.44734
24-0.015242-0.12930.448727
25-0.028461-0.24150.404926
26-0.032207-0.27330.392707
27-0.032934-0.27950.390347
28-0.030076-0.25520.399647
29-0.031267-0.26530.395765
30-0.040289-0.34190.366724
31-0.034758-0.29490.384447
32-0.030925-0.26240.396879
33-0.037547-0.31860.375477
34-0.04425-0.37550.354207
35-0.050003-0.42430.336311
36-0.048141-0.40850.342065
37-0.057778-0.49030.312721
38-0.066756-0.56640.286426
39-0.073949-0.62750.266165
40-0.084884-0.72030.236846
41-0.101171-0.85850.196742
42-0.130447-1.10690.136015
43-0.151445-1.28510.101446
44-0.174989-1.48480.070976
45-0.203834-1.72960.043995
46-0.234966-1.99380.024984
47-0.26654-2.26170.013369
48-0.293135-2.48730.007594


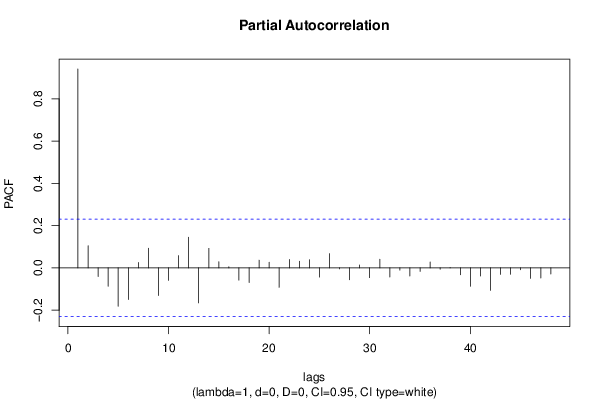
Partial Autocorrelation Function
Time lag kPACF(k)T-STATP-value
10.9419467.99270
20.1044420.88620.189224
3-0.041183-0.34950.363885
4-0.087179-0.73970.230932
5-0.182114-1.54530.063331
6-0.149806-1.27110.103884
70.0253240.21490.415234
80.0932350.79110.215734
9-0.131018-1.11170.134977
10-0.059118-0.50160.308728
110.0580650.49270.311863
120.1453111.2330.110793
13-0.165903-1.40770.081756
140.0922580.78280.218145
150.0294060.24950.401834
160.0056580.0480.480919
17-0.057931-0.49160.312262
18-0.069119-0.58650.279689
190.036550.31010.378675
200.0266710.22630.410801
21-0.092256-0.78280.218151
220.0395430.33550.369098
230.0313040.26560.395643
240.0383710.32560.372841
25-0.043698-0.37080.355943
260.0673280.57130.284789
27-0.004756-0.04040.483961
28-0.056386-0.47840.316891
290.013610.11550.45419
30-0.046096-0.39110.348426
310.0407750.3460.36518
32-0.043453-0.36870.356713
33-0.010686-0.09070.464002
34-0.038222-0.32430.373316
35-0.0165-0.140.444524
360.0277920.23580.407119
37-0.006327-0.05370.478666
380.0013460.01140.495458
39-0.032637-0.27690.391312
40-0.086775-0.73630.231966
41-0.038592-0.32750.372133
42-0.106673-0.90520.184202
43-0.030767-0.26110.397394
44-0.030378-0.25780.398663
45-0.00862-0.07310.470947
46-0.049724-0.42190.33717
47-0.04763-0.40420.34365
48-0.029156-0.24740.402654

\begin{tabular}{lllllllll}
\hline
Partial Autocorrelation Function \tabularnewline
Time lag k & PACF(k) & T-STAT & P-value \tabularnewline
1 & 0.941946 & 7.9927 & 0 \tabularnewline
2 & 0.104442 & 0.8862 & 0.189224 \tabularnewline
3 & -0.041183 & -0.3495 & 0.363885 \tabularnewline
4 & -0.087179 & -0.7397 & 0.230932 \tabularnewline
5 & -0.182114 & -1.5453 & 0.063331 \tabularnewline
6 & -0.149806 & -1.2711 & 0.103884 \tabularnewline
7 & 0.025324 & 0.2149 & 0.415234 \tabularnewline
8 & 0.093235 & 0.7911 & 0.215734 \tabularnewline
9 & -0.131018 & -1.1117 & 0.134977 \tabularnewline
10 & -0.059118 & -0.5016 & 0.308728 \tabularnewline
11 & 0.058065 & 0.4927 & 0.311863 \tabularnewline
12 & 0.145311 & 1.233 & 0.110793 \tabularnewline
13 & -0.165903 & -1.4077 & 0.081756 \tabularnewline
14 & 0.092258 & 0.7828 & 0.218145 \tabularnewline
15 & 0.029406 & 0.2495 & 0.401834 \tabularnewline
16 & 0.005658 & 0.048 & 0.480919 \tabularnewline
17 & -0.057931 & -0.4916 & 0.312262 \tabularnewline
18 & -0.069119 & -0.5865 & 0.279689 \tabularnewline
19 & 0.03655 & 0.3101 & 0.378675 \tabularnewline
20 & 0.026671 & 0.2263 & 0.410801 \tabularnewline
21 & -0.092256 & -0.7828 & 0.218151 \tabularnewline
22 & 0.039543 & 0.3355 & 0.369098 \tabularnewline
23 & 0.031304 & 0.2656 & 0.395643 \tabularnewline
24 & 0.038371 & 0.3256 & 0.372841 \tabularnewline
25 & -0.043698 & -0.3708 & 0.355943 \tabularnewline
26 & 0.067328 & 0.5713 & 0.284789 \tabularnewline
27 & -0.004756 & -0.0404 & 0.483961 \tabularnewline
28 & -0.056386 & -0.4784 & 0.316891 \tabularnewline
29 & 0.01361 & 0.1155 & 0.45419 \tabularnewline
30 & -0.046096 & -0.3911 & 0.348426 \tabularnewline
31 & 0.040775 & 0.346 & 0.36518 \tabularnewline
32 & -0.043453 & -0.3687 & 0.356713 \tabularnewline
33 & -0.010686 & -0.0907 & 0.464002 \tabularnewline
34 & -0.038222 & -0.3243 & 0.373316 \tabularnewline
35 & -0.0165 & -0.14 & 0.444524 \tabularnewline
36 & 0.027792 & 0.2358 & 0.407119 \tabularnewline
37 & -0.006327 & -0.0537 & 0.478666 \tabularnewline
38 & 0.001346 & 0.0114 & 0.495458 \tabularnewline
39 & -0.032637 & -0.2769 & 0.391312 \tabularnewline
40 & -0.086775 & -0.7363 & 0.231966 \tabularnewline
41 & -0.038592 & -0.3275 & 0.372133 \tabularnewline
42 & -0.106673 & -0.9052 & 0.184202 \tabularnewline
43 & -0.030767 & -0.2611 & 0.397394 \tabularnewline
44 & -0.030378 & -0.2578 & 0.398663 \tabularnewline
45 & -0.00862 & -0.0731 & 0.470947 \tabularnewline
46 & -0.049724 & -0.4219 & 0.33717 \tabularnewline
47 & -0.04763 & -0.4042 & 0.34365 \tabularnewline
48 & -0.029156 & -0.2474 & 0.402654 \tabularnewline
\hline
\end{tabular}
%Source: https://freestatistics.org/blog/index.php?pk=263691&T=2

[TABLE]
[ROW][C]Partial Autocorrelation Function[/C][/ROW]
[ROW][C]Time lag k[/C][C]PACF(k)[/C][C]T-STAT[/C][C]P-value[/C][/ROW]
[ROW][C]1[/C][C]0.941946[/C][C]7.9927[/C][C]0[/C][/ROW]
[ROW][C]2[/C][C]0.104442[/C][C]0.8862[/C][C]0.189224[/C][/ROW]
[ROW][C]3[/C][C]-0.041183[/C][C]-0.3495[/C][C]0.363885[/C][/ROW]
[ROW][C]4[/C][C]-0.087179[/C][C]-0.7397[/C][C]0.230932[/C][/ROW]
[ROW][C]5[/C][C]-0.182114[/C][C]-1.5453[/C][C]0.063331[/C][/ROW]
[ROW][C]6[/C][C]-0.149806[/C][C]-1.2711[/C][C]0.103884[/C][/ROW]
[ROW][C]7[/C][C]0.025324[/C][C]0.2149[/C][C]0.415234[/C][/ROW]
[ROW][C]8[/C][C]0.093235[/C][C]0.7911[/C][C]0.215734[/C][/ROW]
[ROW][C]9[/C][C]-0.131018[/C][C]-1.1117[/C][C]0.134977[/C][/ROW]
[ROW][C]10[/C][C]-0.059118[/C][C]-0.5016[/C][C]0.308728[/C][/ROW]
[ROW][C]11[/C][C]0.058065[/C][C]0.4927[/C][C]0.311863[/C][/ROW]
[ROW][C]12[/C][C]0.145311[/C][C]1.233[/C][C]0.110793[/C][/ROW]
[ROW][C]13[/C][C]-0.165903[/C][C]-1.4077[/C][C]0.081756[/C][/ROW]
[ROW][C]14[/C][C]0.092258[/C][C]0.7828[/C][C]0.218145[/C][/ROW]
[ROW][C]15[/C][C]0.029406[/C][C]0.2495[/C][C]0.401834[/C][/ROW]
[ROW][C]16[/C][C]0.005658[/C][C]0.048[/C][C]0.480919[/C][/ROW]
[ROW][C]17[/C][C]-0.057931[/C][C]-0.4916[/C][C]0.312262[/C][/ROW]
[ROW][C]18[/C][C]-0.069119[/C][C]-0.5865[/C][C]0.279689[/C][/ROW]
[ROW][C]19[/C][C]0.03655[/C][C]0.3101[/C][C]0.378675[/C][/ROW]
[ROW][C]20[/C][C]0.026671[/C][C]0.2263[/C][C]0.410801[/C][/ROW]
[ROW][C]21[/C][C]-0.092256[/C][C]-0.7828[/C][C]0.218151[/C][/ROW]
[ROW][C]22[/C][C]0.039543[/C][C]0.3355[/C][C]0.369098[/C][/ROW]
[ROW][C]23[/C][C]0.031304[/C][C]0.2656[/C][C]0.395643[/C][/ROW]
[ROW][C]24[/C][C]0.038371[/C][C]0.3256[/C][C]0.372841[/C][/ROW]
[ROW][C]25[/C][C]-0.043698[/C][C]-0.3708[/C][C]0.355943[/C][/ROW]
[ROW][C]26[/C][C]0.067328[/C][C]0.5713[/C][C]0.284789[/C][/ROW]
[ROW][C]27[/C][C]-0.004756[/C][C]-0.0404[/C][C]0.483961[/C][/ROW]
[ROW][C]28[/C][C]-0.056386[/C][C]-0.4784[/C][C]0.316891[/C][/ROW]
[ROW][C]29[/C][C]0.01361[/C][C]0.1155[/C][C]0.45419[/C][/ROW]
[ROW][C]30[/C][C]-0.046096[/C][C]-0.3911[/C][C]0.348426[/C][/ROW]
[ROW][C]31[/C][C]0.040775[/C][C]0.346[/C][C]0.36518[/C][/ROW]
[ROW][C]32[/C][C]-0.043453[/C][C]-0.3687[/C][C]0.356713[/C][/ROW]
[ROW][C]33[/C][C]-0.010686[/C][C]-0.0907[/C][C]0.464002[/C][/ROW]
[ROW][C]34[/C][C]-0.038222[/C][C]-0.3243[/C][C]0.373316[/C][/ROW]
[ROW][C]35[/C][C]-0.0165[/C][C]-0.14[/C][C]0.444524[/C][/ROW]
[ROW][C]36[/C][C]0.027792[/C][C]0.2358[/C][C]0.407119[/C][/ROW]
[ROW][C]37[/C][C]-0.006327[/C][C]-0.0537[/C][C]0.478666[/C][/ROW]
[ROW][C]38[/C][C]0.001346[/C][C]0.0114[/C][C]0.495458[/C][/ROW]
[ROW][C]39[/C][C]-0.032637[/C][C]-0.2769[/C][C]0.391312[/C][/ROW]
[ROW][C]40[/C][C]-0.086775[/C][C]-0.7363[/C][C]0.231966[/C][/ROW]
[ROW][C]41[/C][C]-0.038592[/C][C]-0.3275[/C][C]0.372133[/C][/ROW]
[ROW][C]42[/C][C]-0.106673[/C][C]-0.9052[/C][C]0.184202[/C][/ROW]
[ROW][C]43[/C][C]-0.030767[/C][C]-0.2611[/C][C]0.397394[/C][/ROW]
[ROW][C]44[/C][C]-0.030378[/C][C]-0.2578[/C][C]0.398663[/C][/ROW]
[ROW][C]45[/C][C]-0.00862[/C][C]-0.0731[/C][C]0.470947[/C][/ROW]
[ROW][C]46[/C][C]-0.049724[/C][C]-0.4219[/C][C]0.33717[/C][/ROW]
[ROW][C]47[/C][C]-0.04763[/C][C]-0.4042[/C][C]0.34365[/C][/ROW]
[ROW][C]48[/C][C]-0.029156[/C][C]-0.2474[/C][C]0.402654[/C][/ROW]
[/TABLE]
Source: https://freestatistics.org/blog/index.php?pk=263691&T=2

Globally Unique Identifier (entire table): ba.freestatistics.org/blog/index.php?pk=263691&T=2

As an alternative you can also use a QR Code:  

The GUIDs for individual cells are displayed in the table below:

Partial Autocorrelation Function
Time lag kPACF(k)T-STATP-value
10.9419467.99270
20.1044420.88620.189224
3-0.041183-0.34950.363885
4-0.087179-0.73970.230932
5-0.182114-1.54530.063331
6-0.149806-1.27110.103884
70.0253240.21490.415234
80.0932350.79110.215734
9-0.131018-1.11170.134977
10-0.059118-0.50160.308728
110.0580650.49270.311863
120.1453111.2330.110793
13-0.165903-1.40770.081756
140.0922580.78280.218145
150.0294060.24950.401834
160.0056580.0480.480919
17-0.057931-0.49160.312262
18-0.069119-0.58650.279689
190.036550.31010.378675
200.0266710.22630.410801
21-0.092256-0.78280.218151
220.0395430.33550.369098
230.0313040.26560.395643
240.0383710.32560.372841
25-0.043698-0.37080.355943
260.0673280.57130.284789
27-0.004756-0.04040.483961
28-0.056386-0.47840.316891
290.013610.11550.45419
30-0.046096-0.39110.348426
310.0407750.3460.36518
32-0.043453-0.36870.356713
33-0.010686-0.09070.464002
34-0.038222-0.32430.373316
35-0.0165-0.140.444524
360.0277920.23580.407119
37-0.006327-0.05370.478666
380.0013460.01140.495458
39-0.032637-0.27690.391312
40-0.086775-0.73630.231966
41-0.038592-0.32750.372133
42-0.106673-0.90520.184202
43-0.030767-0.26110.397394
44-0.030378-0.25780.398663
45-0.00862-0.07310.470947
46-0.049724-0.42190.33717
47-0.04763-0.40420.34365
48-0.029156-0.24740.402654


Parameters (Session):
par1 = 48 ; par2 = 1 ; par3 = 0 ; par4 = 0 ; par5 = 12 ; par6 = White Noise ; par7 = 0.95 ;
Parameters (R input):
par1 = 48 ; par2 = 1 ; par3 = 0 ; par4 = 0 ; par5 = 12 ; par6 = White Noise ; par7 = 0.95 ; par8 = ;
R code (references can be found in the software module):
if (par1 == 'Default') {
par1 = 10*log10(length(x))
} else {
par1 <- as.numeric(par1)
}
par2 <- as.numeric(par2)
par3 <- as.numeric(par3)
par4 <- as.numeric(par4)
par5 <- as.numeric(par5)
if (par6 == 'White Noise') par6 <- 'white' else par6 <- 'ma'
par7 <- as.numeric(par7)
if (par8 != '') par8 <- as.numeric(par8)
ox <- x
if (par8 == '') {
if (par2 == 0) {
x <- log(x)
} else {
x <- (x ^ par2 - 1) / par2
}
} else {
x <- log(x,base=par8)
}
if (par3 > 0) x <- diff(x,lag=1,difference=par3)
if (par4 > 0) x <- diff(x,lag=par5,difference=par4)
bitmap(file='picts.png')
op <- par(mfrow=c(2,1))
plot(ox,type='l',main='Original Time Series',xlab='time',ylab='value')
if (par8=='') {
mytitle <- paste('Working Time Series (lambda=',par2,', d=',par3,', D=',par4,')',sep='')
mysub <- paste('(lambda=',par2,', d=',par3,', D=',par4,', CI=', par7, ', CI type=',par6,')',sep='')
} else {
mytitle <- paste('Working Time Series (base=',par8,', d=',par3,', D=',par4,')',sep='')
mysub <- paste('(base=',par8,', d=',par3,', D=',par4,', CI=', par7, ', CI type=',par6,')',sep='')
}
plot(x,type='l', main=mytitle,xlab='time',ylab='value')
par(op)
dev.off()
bitmap(file='pic1.png')
racf <- acf(x, par1, main='Autocorrelation', xlab='time lag', ylab='ACF', ci.type=par6, ci=par7, sub=mysub)
dev.off()
bitmap(file='pic2.png')
rpacf <- pacf(x,par1,main='Partial Autocorrelation',xlab='lags',ylab='PACF',sub=mysub)
dev.off()
(myacf <- c(racf$acf))
(mypacf <- c(rpacf$acf))
lengthx <- length(x)
sqrtn <- sqrt(lengthx)
load(file='createtable')
a<-table.start()
a<-table.row.start(a)
a<-table.element(a,'Autocorrelation Function',4,TRUE)
a<-table.row.end(a)
a<-table.row.start(a)
a<-table.element(a,'Time lag k',header=TRUE)
a<-table.element(a,hyperlink('basics.htm','ACF(k)','click here for more information about the Autocorrelation Function'),header=TRUE)
a<-table.element(a,'T-STAT',header=TRUE)
a<-table.element(a,'P-value',header=TRUE)
a<-table.row.end(a)
for (i in 2:(par1+1)) {
a<-table.row.start(a)
a<-table.element(a,i-1,header=TRUE)
a<-table.element(a,round(myacf[i],6))
mytstat <- myacf[i]*sqrtn
a<-table.element(a,round(mytstat,4))
a<-table.element(a,round(1-pt(abs(mytstat),lengthx),6))
a<-table.row.end(a)
}
a<-table.end(a)
table.save(a,file='mytable.tab')
a<-table.start()
a<-table.row.start(a)
a<-table.element(a,'Partial Autocorrelation Function',4,TRUE)
a<-table.row.end(a)
a<-table.row.start(a)
a<-table.element(a,'Time lag k',header=TRUE)
a<-table.element(a,hyperlink('basics.htm','PACF(k)','click here for more information about the Partial Autocorrelation Function'),header=TRUE)
a<-table.element(a,'T-STAT',header=TRUE)
a<-table.element(a,'P-value',header=TRUE)
a<-table.row.end(a)
for (i in 1:par1) {
a<-table.row.start(a)
a<-table.element(a,i,header=TRUE)
a<-table.element(a,round(mypacf[i],6))
mytstat <- mypacf[i]*sqrtn
a<-table.element(a,round(mytstat,4))
a<-table.element(a,round(1-pt(abs(mytstat),lengthx),6))
a<-table.row.end(a)
}
a<-table.end(a)
table.save(a,file='mytable1.tab')