Free Statistics

of Irreproducible Research!

Author's title

Author*The author of this computation has been verified*
R Software Modulerwasp_multipleregression.wasp
Title produced by softwareMultiple Regression
Date of computationWed, 17 Dec 2014 20:56:59 +0000
Cite this page as followsStatistical Computations at FreeStatistics.org, Office for Research Development and Education, URL https://freestatistics.org/blog/index.php?v=date/2014/Dec/17/t1418849924erwer09rqbei831.htm/, Retrieved Thu, 31 Oct 2024 23:33:58 +0000
Statistical Computations at FreeStatistics.org, Office for Research Development and Education, URL https://freestatistics.org/blog/index.php?pk=270683, Retrieved Thu, 31 Oct 2024 23:33:58 +0000
QR Codes:

Original text written by user:
IsPrivate?No (this computation is public)
User-defined keywords
Estimated Impact90
Family? (F = Feedback message, R = changed R code, M = changed R Module, P = changed Parameters, D = changed Data)
-       [Multiple Regression] [] [2014-12-17 20:56:59] [92b9176a7d614ba60c8f41dcecd4e71d] [Current]
Feedback Forum

Post a new message
Dataseries X:
13 149 18 68
13 139 31 39
11 148 39 32
14 158 46 62
15 128 31 33
14 224 67 52
11 159 35 62
13 105 52 77
16 159 77 76
14 167 37 41
14 165 32 48
15 159 36 63
15 119 38 30
13 176 69 78
14 54 21 19
11 91 26 31
12 163 54 66
14 124 36 35
13 137 42 42
12 121 23 45
15 153 34 21
15 148 112 25
14 221 35 44
14 188 47 69
12 149 47 54
12 244 37 74
12 148 109 80
15 92 24 42
14 150 20 61
16 153 22 41
12 94 23 46
12 156 32 39
14 132 30 34
16 161 92 51
15 105 43 42
12 97 55 31
14 151 16 39
13 131 49 20
14 166 71 49
16 157 43 53
12 111 29 31
14 145 56 39
15 162 46 54
13 163 19 49
16 59 23 34
16 187 59 46
12 109 30 55
12 90 61 42
16 105 7 50
12 83 38 13
15 116 32 37
12 42 16 25
13 148 19 30
12 155 22 28
14 125 48 45
14 116 23 35
11 128 26 28
10 138 33 41
12 49 9 6
11 96 24 45
16 164 34 73
14 162 48 17
14 99 18 40
15 202 43 64
15 186 33 37
14 66 28 25
13 183 71 65
11 214 26 100
16 188 67 28
12 104 34 35
15 177 80 56
14 126 29 29
15 76 16 43
14 99 59 59
13 139 32 50
6 78 47 3
12 162 43 59
12 108 38 27
14 159 29 61
14 74 36 28
15 110 32 51
11 96 35 35
13 116 21 29
14 87 29 48
16 97 12 25
13 127 37 44
14 106 37 64
16 80 47 32
11 74 51 20
13 91 32 28
13 133 21 34
15 74 13 31
12 114 14 26
13 140 -2 58
12 95 20 23
14 98 24 21
14 121 11 21
16 126 23 33
15 98 24 16
14 95 14 20
13 110 52 37
14 70 15 35
15 102 23 33
14 86 19 27
12 130 35 41
7 96 24 40
12 102 39 35
15 100 29 28
12 94 13 32
13 52 8 22
11 98 18 44
14 118 24 27


Summary of computational transaction
Raw Inputview raw input (R code)
Raw Outputview raw output of R engine
Computing time6 seconds
R Server'Sir Maurice George Kendall' @ kendall.wessa.net

\begin{tabular}{lllllllll}
\hline
Summary of computational transaction \tabularnewline
Raw Input & view raw input (R code)  \tabularnewline
Raw Output & view raw output of R engine  \tabularnewline
Computing time & 6 seconds \tabularnewline
R Server & 'Sir Maurice George Kendall' @ kendall.wessa.net \tabularnewline
\hline
\end{tabular}
%Source: https://freestatistics.org/blog/index.php?pk=270683&T=0

[TABLE]
[ROW][C]Summary of computational transaction[/C][/ROW]
[ROW][C]Raw Input[/C][C]view raw input (R code) [/C][/ROW]
[ROW][C]Raw Output[/C][C]view raw output of R engine [/C][/ROW]
[ROW][C]Computing time[/C][C]6 seconds[/C][/ROW]
[ROW][C]R Server[/C][C]'Sir Maurice George Kendall' @ kendall.wessa.net[/C][/ROW]
[/TABLE]
Source: https://freestatistics.org/blog/index.php?pk=270683&T=0

Globally Unique Identifier (entire table): ba.freestatistics.org/blog/index.php?pk=270683&T=0

As an alternative you can also use a QR Code:  

The GUIDs for individual cells are displayed in the table below:

Summary of computational transaction
Raw Inputview raw input (R code)
Raw Outputview raw output of R engine
Computing time6 seconds
R Server'Sir Maurice George Kendall' @ kendall.wessa.net


Multiple Linear Regression - Estimated Regression Equation
STRESSTOT[t] = + 12.5083 + 0.00654663LFM[t] + 0.00307172PRH[t] -0.00106607CH[t] + e[t]

\begin{tabular}{lllllllll}
\hline
Multiple Linear Regression - Estimated Regression Equation \tabularnewline
STRESSTOT[t] =  +  12.5083 +  0.00654663LFM[t] +  0.00307172PRH[t] -0.00106607CH[t]  + e[t] \tabularnewline
\hline
\end{tabular}
%Source: https://freestatistics.org/blog/index.php?pk=270683&T=1

[TABLE]
[ROW][C]Multiple Linear Regression - Estimated Regression Equation[/C][/ROW]
[ROW][C]STRESSTOT[t] =  +  12.5083 +  0.00654663LFM[t] +  0.00307172PRH[t] -0.00106607CH[t]  + e[t][/C][/ROW]
[/TABLE]
Source: https://freestatistics.org/blog/index.php?pk=270683&T=1

Globally Unique Identifier (entire table): ba.freestatistics.org/blog/index.php?pk=270683&T=1

As an alternative you can also use a QR Code:  

The GUIDs for individual cells are displayed in the table below:

Multiple Linear Regression - Estimated Regression Equation
STRESSTOT[t] = + 12.5083 + 0.00654663LFM[t] + 0.00307172PRH[t] -0.00106607CH[t] + e[t]


Multiple Linear Regression - Ordinary Least Squares
VariableParameterS.D.T-STATH0: parameter = 02-tail p-value1-tail p-value
(Intercept)12.50830.57450521.772.66406e-411.33203e-41
LFM0.006546630.005381711.2160.2264620.113231
PRH0.003071720.009363330.32810.7435020.371751
CH-0.001066070.0120774-0.088270.9298260.464913

\begin{tabular}{lllllllll}
\hline
Multiple Linear Regression - Ordinary Least Squares \tabularnewline
Variable & Parameter & S.D. & T-STATH0: parameter = 0 & 2-tail p-value & 1-tail p-value \tabularnewline
(Intercept) & 12.5083 & 0.574505 & 21.77 & 2.66406e-41 & 1.33203e-41 \tabularnewline
LFM & 0.00654663 & 0.00538171 & 1.216 & 0.226462 & 0.113231 \tabularnewline
PRH & 0.00307172 & 0.00936333 & 0.3281 & 0.743502 & 0.371751 \tabularnewline
CH & -0.00106607 & 0.0120774 & -0.08827 & 0.929826 & 0.464913 \tabularnewline
\hline
\end{tabular}
%Source: https://freestatistics.org/blog/index.php?pk=270683&T=2

[TABLE]
[ROW][C]Multiple Linear Regression - Ordinary Least Squares[/C][/ROW]
[ROW][C]Variable[/C][C]Parameter[/C][C]S.D.[/C][C]T-STATH0: parameter = 0[/C][C]2-tail p-value[/C][C]1-tail p-value[/C][/ROW]
[ROW][C](Intercept)[/C][C]12.5083[/C][C]0.574505[/C][C]21.77[/C][C]2.66406e-41[/C][C]1.33203e-41[/C][/ROW]
[ROW][C]LFM[/C][C]0.00654663[/C][C]0.00538171[/C][C]1.216[/C][C]0.226462[/C][C]0.113231[/C][/ROW]
[ROW][C]PRH[/C][C]0.00307172[/C][C]0.00936333[/C][C]0.3281[/C][C]0.743502[/C][C]0.371751[/C][/ROW]
[ROW][C]CH[/C][C]-0.00106607[/C][C]0.0120774[/C][C]-0.08827[/C][C]0.929826[/C][C]0.464913[/C][/ROW]
[/TABLE]
Source: https://freestatistics.org/blog/index.php?pk=270683&T=2

Globally Unique Identifier (entire table): ba.freestatistics.org/blog/index.php?pk=270683&T=2

As an alternative you can also use a QR Code:  

The GUIDs for individual cells are displayed in the table below:

Multiple Linear Regression - Ordinary Least Squares
VariableParameterS.D.T-STATH0: parameter = 02-tail p-value1-tail p-value
(Intercept)12.50830.57450521.772.66406e-411.33203e-41
LFM0.006546630.005381711.2160.2264620.113231
PRH0.003071720.009363330.32810.7435020.371751
CH-0.001066070.0120774-0.088270.9298260.464913


Multiple Linear Regression - Regression Statistics
Multiple R0.159113
R-squared0.025317
Adjusted R-squared-0.0017575
F-TEST (value)0.935086
F-TEST (DF numerator)3
F-TEST (DF denominator)108
p-value0.42644
Multiple Linear Regression - Residual Statistics
Residual Standard Deviation1.76433
Sum Squared Residuals336.187

\begin{tabular}{lllllllll}
\hline
Multiple Linear Regression - Regression Statistics \tabularnewline
Multiple R & 0.159113 \tabularnewline
R-squared & 0.025317 \tabularnewline
Adjusted R-squared & -0.0017575 \tabularnewline
F-TEST (value) & 0.935086 \tabularnewline
F-TEST (DF numerator) & 3 \tabularnewline
F-TEST (DF denominator) & 108 \tabularnewline
p-value & 0.42644 \tabularnewline
Multiple Linear Regression - Residual Statistics \tabularnewline
Residual Standard Deviation & 1.76433 \tabularnewline
Sum Squared Residuals & 336.187 \tabularnewline
\hline
\end{tabular}
%Source: https://freestatistics.org/blog/index.php?pk=270683&T=3

[TABLE]
[ROW][C]Multiple Linear Regression - Regression Statistics[/C][/ROW]
[ROW][C]Multiple R[/C][C]0.159113[/C][/ROW]
[ROW][C]R-squared[/C][C]0.025317[/C][/ROW]
[ROW][C]Adjusted R-squared[/C][C]-0.0017575[/C][/ROW]
[ROW][C]F-TEST (value)[/C][C]0.935086[/C][/ROW]
[ROW][C]F-TEST (DF numerator)[/C][C]3[/C][/ROW]
[ROW][C]F-TEST (DF denominator)[/C][C]108[/C][/ROW]
[ROW][C]p-value[/C][C]0.42644[/C][/ROW]
[ROW][C]Multiple Linear Regression - Residual Statistics[/C][/ROW]
[ROW][C]Residual Standard Deviation[/C][C]1.76433[/C][/ROW]
[ROW][C]Sum Squared Residuals[/C][C]336.187[/C][/ROW]
[/TABLE]
Source: https://freestatistics.org/blog/index.php?pk=270683&T=3

Globally Unique Identifier (entire table): ba.freestatistics.org/blog/index.php?pk=270683&T=3

As an alternative you can also use a QR Code:  

The GUIDs for individual cells are displayed in the table below:

Multiple Linear Regression - Regression Statistics
Multiple R0.159113
R-squared0.025317
Adjusted R-squared-0.0017575
F-TEST (value)0.935086
F-TEST (DF numerator)3
F-TEST (DF denominator)108
p-value0.42644
Multiple Linear Regression - Residual Statistics
Residual Standard Deviation1.76433
Sum Squared Residuals336.187


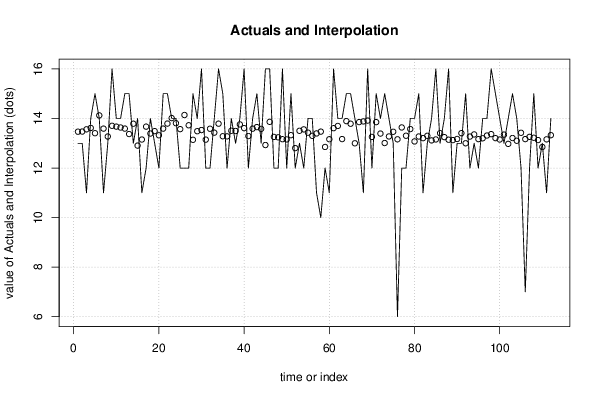
Multiple Linear Regression - Actuals, Interpolation, and Residuals
Time or IndexActualsInterpolationForecastResidualsPrediction Error
11313.4666-0.466562
21313.4719-0.471944
31113.5629-2.5629
41413.61790.382113
51513.40631.59367
61414.1251-0.125131
71113.5906-2.59064
81313.2734-0.273355
91613.70472.29527
101413.67150.328452
111413.63560.364366
121513.59261.40735
131513.37211.62789
141313.7893-0.789318
151412.90611.09391
161113.1509-2.15088
171213.6709-1.67093
181413.39340.606632
191313.4894-0.489442
201213.3231-1.32313
211513.5921.408
221513.79461.2054
231414.0157-0.0157244
241413.80990.190105
251213.5706-1.57057
261214.1405-2.14046
271213.7267-1.72675
281513.13961.86045
291413.48670.513285
301613.53382.46618
311213.1453-1.14531
321213.5863-1.58631
331413.42840.571623
341613.79062.20945
351513.2831.71698
361213.2792-1.27924
371413.50440.495572
381313.4951-0.495118
391413.76090.239089
401613.61172.38828
411213.291-1.29102
421413.5880.411983
431513.65261.3474
441313.5815-0.581542
451612.9293.07103
461613.86472.13527
471213.2554-1.25542
481213.2401-1.24011
491613.16392.83609
501213.1546-1.15455
511513.32661.67342
521212.8058-0.80577
531313.5036-0.503598
541213.5608-1.56077
551413.42610.573886
561413.30110.698938
571113.3963-2.3963
581013.4694-3.46941
591212.8504-0.85035
601113.1625-2.16254
611613.60862.39142
621413.69820.30181
631413.16910.830919
641513.89461.10541
651513.78791.21209
661412.99981.00025
671313.8551-0.855147
681113.8826-2.88255
691613.9152.08496
701213.2563-1.25629
711513.85311.14689
721413.39140.608645
731513.00921.99083
741413.27480.725234
751313.4633-0.463289
76613.1601-7.16013
771213.6381-1.63806
781213.3033-1.30329
791413.57330.42672
801413.07350.926501
811513.27241.72763
821113.207-2.20699
831313.3013-0.301315
841413.11580.884218
851613.15352.84645
861313.4065-0.406485
871413.24770.752316
881613.14232.8577
891113.1281-2.1281
901313.1725-0.172505
911313.4073-0.407278
921512.99972.00035
931213.2699-1.26992
941313.3569-0.356869
951213.1672-1.16716
961413.20120.79878
971413.31190.68814
981613.36872.63134
991513.20661.79345
1001413.15190.848071
1011313.3487-0.34873
1021412.97531.02466
1031513.21151.78846
1041413.10090.899095
1051213.4232-1.42318
106713.1679-6.16787
1071213.2586-1.25856
1081513.22221.77779
1091213.1295-1.12952
1101312.84990.150139
1111113.1583-2.15827
1121413.32580.674244

\begin{tabular}{lllllllll}
\hline
Multiple Linear Regression - Actuals, Interpolation, and Residuals \tabularnewline
Time or Index & Actuals & InterpolationForecast & ResidualsPrediction Error \tabularnewline
1 & 13 & 13.4666 & -0.466562 \tabularnewline
2 & 13 & 13.4719 & -0.471944 \tabularnewline
3 & 11 & 13.5629 & -2.5629 \tabularnewline
4 & 14 & 13.6179 & 0.382113 \tabularnewline
5 & 15 & 13.4063 & 1.59367 \tabularnewline
6 & 14 & 14.1251 & -0.125131 \tabularnewline
7 & 11 & 13.5906 & -2.59064 \tabularnewline
8 & 13 & 13.2734 & -0.273355 \tabularnewline
9 & 16 & 13.7047 & 2.29527 \tabularnewline
10 & 14 & 13.6715 & 0.328452 \tabularnewline
11 & 14 & 13.6356 & 0.364366 \tabularnewline
12 & 15 & 13.5926 & 1.40735 \tabularnewline
13 & 15 & 13.3721 & 1.62789 \tabularnewline
14 & 13 & 13.7893 & -0.789318 \tabularnewline
15 & 14 & 12.9061 & 1.09391 \tabularnewline
16 & 11 & 13.1509 & -2.15088 \tabularnewline
17 & 12 & 13.6709 & -1.67093 \tabularnewline
18 & 14 & 13.3934 & 0.606632 \tabularnewline
19 & 13 & 13.4894 & -0.489442 \tabularnewline
20 & 12 & 13.3231 & -1.32313 \tabularnewline
21 & 15 & 13.592 & 1.408 \tabularnewline
22 & 15 & 13.7946 & 1.2054 \tabularnewline
23 & 14 & 14.0157 & -0.0157244 \tabularnewline
24 & 14 & 13.8099 & 0.190105 \tabularnewline
25 & 12 & 13.5706 & -1.57057 \tabularnewline
26 & 12 & 14.1405 & -2.14046 \tabularnewline
27 & 12 & 13.7267 & -1.72675 \tabularnewline
28 & 15 & 13.1396 & 1.86045 \tabularnewline
29 & 14 & 13.4867 & 0.513285 \tabularnewline
30 & 16 & 13.5338 & 2.46618 \tabularnewline
31 & 12 & 13.1453 & -1.14531 \tabularnewline
32 & 12 & 13.5863 & -1.58631 \tabularnewline
33 & 14 & 13.4284 & 0.571623 \tabularnewline
34 & 16 & 13.7906 & 2.20945 \tabularnewline
35 & 15 & 13.283 & 1.71698 \tabularnewline
36 & 12 & 13.2792 & -1.27924 \tabularnewline
37 & 14 & 13.5044 & 0.495572 \tabularnewline
38 & 13 & 13.4951 & -0.495118 \tabularnewline
39 & 14 & 13.7609 & 0.239089 \tabularnewline
40 & 16 & 13.6117 & 2.38828 \tabularnewline
41 & 12 & 13.291 & -1.29102 \tabularnewline
42 & 14 & 13.588 & 0.411983 \tabularnewline
43 & 15 & 13.6526 & 1.3474 \tabularnewline
44 & 13 & 13.5815 & -0.581542 \tabularnewline
45 & 16 & 12.929 & 3.07103 \tabularnewline
46 & 16 & 13.8647 & 2.13527 \tabularnewline
47 & 12 & 13.2554 & -1.25542 \tabularnewline
48 & 12 & 13.2401 & -1.24011 \tabularnewline
49 & 16 & 13.1639 & 2.83609 \tabularnewline
50 & 12 & 13.1546 & -1.15455 \tabularnewline
51 & 15 & 13.3266 & 1.67342 \tabularnewline
52 & 12 & 12.8058 & -0.80577 \tabularnewline
53 & 13 & 13.5036 & -0.503598 \tabularnewline
54 & 12 & 13.5608 & -1.56077 \tabularnewline
55 & 14 & 13.4261 & 0.573886 \tabularnewline
56 & 14 & 13.3011 & 0.698938 \tabularnewline
57 & 11 & 13.3963 & -2.3963 \tabularnewline
58 & 10 & 13.4694 & -3.46941 \tabularnewline
59 & 12 & 12.8504 & -0.85035 \tabularnewline
60 & 11 & 13.1625 & -2.16254 \tabularnewline
61 & 16 & 13.6086 & 2.39142 \tabularnewline
62 & 14 & 13.6982 & 0.30181 \tabularnewline
63 & 14 & 13.1691 & 0.830919 \tabularnewline
64 & 15 & 13.8946 & 1.10541 \tabularnewline
65 & 15 & 13.7879 & 1.21209 \tabularnewline
66 & 14 & 12.9998 & 1.00025 \tabularnewline
67 & 13 & 13.8551 & -0.855147 \tabularnewline
68 & 11 & 13.8826 & -2.88255 \tabularnewline
69 & 16 & 13.915 & 2.08496 \tabularnewline
70 & 12 & 13.2563 & -1.25629 \tabularnewline
71 & 15 & 13.8531 & 1.14689 \tabularnewline
72 & 14 & 13.3914 & 0.608645 \tabularnewline
73 & 15 & 13.0092 & 1.99083 \tabularnewline
74 & 14 & 13.2748 & 0.725234 \tabularnewline
75 & 13 & 13.4633 & -0.463289 \tabularnewline
76 & 6 & 13.1601 & -7.16013 \tabularnewline
77 & 12 & 13.6381 & -1.63806 \tabularnewline
78 & 12 & 13.3033 & -1.30329 \tabularnewline
79 & 14 & 13.5733 & 0.42672 \tabularnewline
80 & 14 & 13.0735 & 0.926501 \tabularnewline
81 & 15 & 13.2724 & 1.72763 \tabularnewline
82 & 11 & 13.207 & -2.20699 \tabularnewline
83 & 13 & 13.3013 & -0.301315 \tabularnewline
84 & 14 & 13.1158 & 0.884218 \tabularnewline
85 & 16 & 13.1535 & 2.84645 \tabularnewline
86 & 13 & 13.4065 & -0.406485 \tabularnewline
87 & 14 & 13.2477 & 0.752316 \tabularnewline
88 & 16 & 13.1423 & 2.8577 \tabularnewline
89 & 11 & 13.1281 & -2.1281 \tabularnewline
90 & 13 & 13.1725 & -0.172505 \tabularnewline
91 & 13 & 13.4073 & -0.407278 \tabularnewline
92 & 15 & 12.9997 & 2.00035 \tabularnewline
93 & 12 & 13.2699 & -1.26992 \tabularnewline
94 & 13 & 13.3569 & -0.356869 \tabularnewline
95 & 12 & 13.1672 & -1.16716 \tabularnewline
96 & 14 & 13.2012 & 0.79878 \tabularnewline
97 & 14 & 13.3119 & 0.68814 \tabularnewline
98 & 16 & 13.3687 & 2.63134 \tabularnewline
99 & 15 & 13.2066 & 1.79345 \tabularnewline
100 & 14 & 13.1519 & 0.848071 \tabularnewline
101 & 13 & 13.3487 & -0.34873 \tabularnewline
102 & 14 & 12.9753 & 1.02466 \tabularnewline
103 & 15 & 13.2115 & 1.78846 \tabularnewline
104 & 14 & 13.1009 & 0.899095 \tabularnewline
105 & 12 & 13.4232 & -1.42318 \tabularnewline
106 & 7 & 13.1679 & -6.16787 \tabularnewline
107 & 12 & 13.2586 & -1.25856 \tabularnewline
108 & 15 & 13.2222 & 1.77779 \tabularnewline
109 & 12 & 13.1295 & -1.12952 \tabularnewline
110 & 13 & 12.8499 & 0.150139 \tabularnewline
111 & 11 & 13.1583 & -2.15827 \tabularnewline
112 & 14 & 13.3258 & 0.674244 \tabularnewline
\hline
\end{tabular}
%Source: https://freestatistics.org/blog/index.php?pk=270683&T=4

[TABLE]
[ROW][C]Multiple Linear Regression - Actuals, Interpolation, and Residuals[/C][/ROW]
[ROW][C]Time or Index[/C][C]Actuals[/C][C]InterpolationForecast[/C][C]ResidualsPrediction Error[/C][/ROW]
[ROW][C]1[/C][C]13[/C][C]13.4666[/C][C]-0.466562[/C][/ROW]
[ROW][C]2[/C][C]13[/C][C]13.4719[/C][C]-0.471944[/C][/ROW]
[ROW][C]3[/C][C]11[/C][C]13.5629[/C][C]-2.5629[/C][/ROW]
[ROW][C]4[/C][C]14[/C][C]13.6179[/C][C]0.382113[/C][/ROW]
[ROW][C]5[/C][C]15[/C][C]13.4063[/C][C]1.59367[/C][/ROW]
[ROW][C]6[/C][C]14[/C][C]14.1251[/C][C]-0.125131[/C][/ROW]
[ROW][C]7[/C][C]11[/C][C]13.5906[/C][C]-2.59064[/C][/ROW]
[ROW][C]8[/C][C]13[/C][C]13.2734[/C][C]-0.273355[/C][/ROW]
[ROW][C]9[/C][C]16[/C][C]13.7047[/C][C]2.29527[/C][/ROW]
[ROW][C]10[/C][C]14[/C][C]13.6715[/C][C]0.328452[/C][/ROW]
[ROW][C]11[/C][C]14[/C][C]13.6356[/C][C]0.364366[/C][/ROW]
[ROW][C]12[/C][C]15[/C][C]13.5926[/C][C]1.40735[/C][/ROW]
[ROW][C]13[/C][C]15[/C][C]13.3721[/C][C]1.62789[/C][/ROW]
[ROW][C]14[/C][C]13[/C][C]13.7893[/C][C]-0.789318[/C][/ROW]
[ROW][C]15[/C][C]14[/C][C]12.9061[/C][C]1.09391[/C][/ROW]
[ROW][C]16[/C][C]11[/C][C]13.1509[/C][C]-2.15088[/C][/ROW]
[ROW][C]17[/C][C]12[/C][C]13.6709[/C][C]-1.67093[/C][/ROW]
[ROW][C]18[/C][C]14[/C][C]13.3934[/C][C]0.606632[/C][/ROW]
[ROW][C]19[/C][C]13[/C][C]13.4894[/C][C]-0.489442[/C][/ROW]
[ROW][C]20[/C][C]12[/C][C]13.3231[/C][C]-1.32313[/C][/ROW]
[ROW][C]21[/C][C]15[/C][C]13.592[/C][C]1.408[/C][/ROW]
[ROW][C]22[/C][C]15[/C][C]13.7946[/C][C]1.2054[/C][/ROW]
[ROW][C]23[/C][C]14[/C][C]14.0157[/C][C]-0.0157244[/C][/ROW]
[ROW][C]24[/C][C]14[/C][C]13.8099[/C][C]0.190105[/C][/ROW]
[ROW][C]25[/C][C]12[/C][C]13.5706[/C][C]-1.57057[/C][/ROW]
[ROW][C]26[/C][C]12[/C][C]14.1405[/C][C]-2.14046[/C][/ROW]
[ROW][C]27[/C][C]12[/C][C]13.7267[/C][C]-1.72675[/C][/ROW]
[ROW][C]28[/C][C]15[/C][C]13.1396[/C][C]1.86045[/C][/ROW]
[ROW][C]29[/C][C]14[/C][C]13.4867[/C][C]0.513285[/C][/ROW]
[ROW][C]30[/C][C]16[/C][C]13.5338[/C][C]2.46618[/C][/ROW]
[ROW][C]31[/C][C]12[/C][C]13.1453[/C][C]-1.14531[/C][/ROW]
[ROW][C]32[/C][C]12[/C][C]13.5863[/C][C]-1.58631[/C][/ROW]
[ROW][C]33[/C][C]14[/C][C]13.4284[/C][C]0.571623[/C][/ROW]
[ROW][C]34[/C][C]16[/C][C]13.7906[/C][C]2.20945[/C][/ROW]
[ROW][C]35[/C][C]15[/C][C]13.283[/C][C]1.71698[/C][/ROW]
[ROW][C]36[/C][C]12[/C][C]13.2792[/C][C]-1.27924[/C][/ROW]
[ROW][C]37[/C][C]14[/C][C]13.5044[/C][C]0.495572[/C][/ROW]
[ROW][C]38[/C][C]13[/C][C]13.4951[/C][C]-0.495118[/C][/ROW]
[ROW][C]39[/C][C]14[/C][C]13.7609[/C][C]0.239089[/C][/ROW]
[ROW][C]40[/C][C]16[/C][C]13.6117[/C][C]2.38828[/C][/ROW]
[ROW][C]41[/C][C]12[/C][C]13.291[/C][C]-1.29102[/C][/ROW]
[ROW][C]42[/C][C]14[/C][C]13.588[/C][C]0.411983[/C][/ROW]
[ROW][C]43[/C][C]15[/C][C]13.6526[/C][C]1.3474[/C][/ROW]
[ROW][C]44[/C][C]13[/C][C]13.5815[/C][C]-0.581542[/C][/ROW]
[ROW][C]45[/C][C]16[/C][C]12.929[/C][C]3.07103[/C][/ROW]
[ROW][C]46[/C][C]16[/C][C]13.8647[/C][C]2.13527[/C][/ROW]
[ROW][C]47[/C][C]12[/C][C]13.2554[/C][C]-1.25542[/C][/ROW]
[ROW][C]48[/C][C]12[/C][C]13.2401[/C][C]-1.24011[/C][/ROW]
[ROW][C]49[/C][C]16[/C][C]13.1639[/C][C]2.83609[/C][/ROW]
[ROW][C]50[/C][C]12[/C][C]13.1546[/C][C]-1.15455[/C][/ROW]
[ROW][C]51[/C][C]15[/C][C]13.3266[/C][C]1.67342[/C][/ROW]
[ROW][C]52[/C][C]12[/C][C]12.8058[/C][C]-0.80577[/C][/ROW]
[ROW][C]53[/C][C]13[/C][C]13.5036[/C][C]-0.503598[/C][/ROW]
[ROW][C]54[/C][C]12[/C][C]13.5608[/C][C]-1.56077[/C][/ROW]
[ROW][C]55[/C][C]14[/C][C]13.4261[/C][C]0.573886[/C][/ROW]
[ROW][C]56[/C][C]14[/C][C]13.3011[/C][C]0.698938[/C][/ROW]
[ROW][C]57[/C][C]11[/C][C]13.3963[/C][C]-2.3963[/C][/ROW]
[ROW][C]58[/C][C]10[/C][C]13.4694[/C][C]-3.46941[/C][/ROW]
[ROW][C]59[/C][C]12[/C][C]12.8504[/C][C]-0.85035[/C][/ROW]
[ROW][C]60[/C][C]11[/C][C]13.1625[/C][C]-2.16254[/C][/ROW]
[ROW][C]61[/C][C]16[/C][C]13.6086[/C][C]2.39142[/C][/ROW]
[ROW][C]62[/C][C]14[/C][C]13.6982[/C][C]0.30181[/C][/ROW]
[ROW][C]63[/C][C]14[/C][C]13.1691[/C][C]0.830919[/C][/ROW]
[ROW][C]64[/C][C]15[/C][C]13.8946[/C][C]1.10541[/C][/ROW]
[ROW][C]65[/C][C]15[/C][C]13.7879[/C][C]1.21209[/C][/ROW]
[ROW][C]66[/C][C]14[/C][C]12.9998[/C][C]1.00025[/C][/ROW]
[ROW][C]67[/C][C]13[/C][C]13.8551[/C][C]-0.855147[/C][/ROW]
[ROW][C]68[/C][C]11[/C][C]13.8826[/C][C]-2.88255[/C][/ROW]
[ROW][C]69[/C][C]16[/C][C]13.915[/C][C]2.08496[/C][/ROW]
[ROW][C]70[/C][C]12[/C][C]13.2563[/C][C]-1.25629[/C][/ROW]
[ROW][C]71[/C][C]15[/C][C]13.8531[/C][C]1.14689[/C][/ROW]
[ROW][C]72[/C][C]14[/C][C]13.3914[/C][C]0.608645[/C][/ROW]
[ROW][C]73[/C][C]15[/C][C]13.0092[/C][C]1.99083[/C][/ROW]
[ROW][C]74[/C][C]14[/C][C]13.2748[/C][C]0.725234[/C][/ROW]
[ROW][C]75[/C][C]13[/C][C]13.4633[/C][C]-0.463289[/C][/ROW]
[ROW][C]76[/C][C]6[/C][C]13.1601[/C][C]-7.16013[/C][/ROW]
[ROW][C]77[/C][C]12[/C][C]13.6381[/C][C]-1.63806[/C][/ROW]
[ROW][C]78[/C][C]12[/C][C]13.3033[/C][C]-1.30329[/C][/ROW]
[ROW][C]79[/C][C]14[/C][C]13.5733[/C][C]0.42672[/C][/ROW]
[ROW][C]80[/C][C]14[/C][C]13.0735[/C][C]0.926501[/C][/ROW]
[ROW][C]81[/C][C]15[/C][C]13.2724[/C][C]1.72763[/C][/ROW]
[ROW][C]82[/C][C]11[/C][C]13.207[/C][C]-2.20699[/C][/ROW]
[ROW][C]83[/C][C]13[/C][C]13.3013[/C][C]-0.301315[/C][/ROW]
[ROW][C]84[/C][C]14[/C][C]13.1158[/C][C]0.884218[/C][/ROW]
[ROW][C]85[/C][C]16[/C][C]13.1535[/C][C]2.84645[/C][/ROW]
[ROW][C]86[/C][C]13[/C][C]13.4065[/C][C]-0.406485[/C][/ROW]
[ROW][C]87[/C][C]14[/C][C]13.2477[/C][C]0.752316[/C][/ROW]
[ROW][C]88[/C][C]16[/C][C]13.1423[/C][C]2.8577[/C][/ROW]
[ROW][C]89[/C][C]11[/C][C]13.1281[/C][C]-2.1281[/C][/ROW]
[ROW][C]90[/C][C]13[/C][C]13.1725[/C][C]-0.172505[/C][/ROW]
[ROW][C]91[/C][C]13[/C][C]13.4073[/C][C]-0.407278[/C][/ROW]
[ROW][C]92[/C][C]15[/C][C]12.9997[/C][C]2.00035[/C][/ROW]
[ROW][C]93[/C][C]12[/C][C]13.2699[/C][C]-1.26992[/C][/ROW]
[ROW][C]94[/C][C]13[/C][C]13.3569[/C][C]-0.356869[/C][/ROW]
[ROW][C]95[/C][C]12[/C][C]13.1672[/C][C]-1.16716[/C][/ROW]
[ROW][C]96[/C][C]14[/C][C]13.2012[/C][C]0.79878[/C][/ROW]
[ROW][C]97[/C][C]14[/C][C]13.3119[/C][C]0.68814[/C][/ROW]
[ROW][C]98[/C][C]16[/C][C]13.3687[/C][C]2.63134[/C][/ROW]
[ROW][C]99[/C][C]15[/C][C]13.2066[/C][C]1.79345[/C][/ROW]
[ROW][C]100[/C][C]14[/C][C]13.1519[/C][C]0.848071[/C][/ROW]
[ROW][C]101[/C][C]13[/C][C]13.3487[/C][C]-0.34873[/C][/ROW]
[ROW][C]102[/C][C]14[/C][C]12.9753[/C][C]1.02466[/C][/ROW]
[ROW][C]103[/C][C]15[/C][C]13.2115[/C][C]1.78846[/C][/ROW]
[ROW][C]104[/C][C]14[/C][C]13.1009[/C][C]0.899095[/C][/ROW]
[ROW][C]105[/C][C]12[/C][C]13.4232[/C][C]-1.42318[/C][/ROW]
[ROW][C]106[/C][C]7[/C][C]13.1679[/C][C]-6.16787[/C][/ROW]
[ROW][C]107[/C][C]12[/C][C]13.2586[/C][C]-1.25856[/C][/ROW]
[ROW][C]108[/C][C]15[/C][C]13.2222[/C][C]1.77779[/C][/ROW]
[ROW][C]109[/C][C]12[/C][C]13.1295[/C][C]-1.12952[/C][/ROW]
[ROW][C]110[/C][C]13[/C][C]12.8499[/C][C]0.150139[/C][/ROW]
[ROW][C]111[/C][C]11[/C][C]13.1583[/C][C]-2.15827[/C][/ROW]
[ROW][C]112[/C][C]14[/C][C]13.3258[/C][C]0.674244[/C][/ROW]
[/TABLE]
Source: https://freestatistics.org/blog/index.php?pk=270683&T=4

Globally Unique Identifier (entire table): ba.freestatistics.org/blog/index.php?pk=270683&T=4

As an alternative you can also use a QR Code:  

The GUIDs for individual cells are displayed in the table below:

Multiple Linear Regression - Actuals, Interpolation, and Residuals
Time or IndexActualsInterpolationForecastResidualsPrediction Error
11313.4666-0.466562
21313.4719-0.471944
31113.5629-2.5629
41413.61790.382113
51513.40631.59367
61414.1251-0.125131
71113.5906-2.59064
81313.2734-0.273355
91613.70472.29527
101413.67150.328452
111413.63560.364366
121513.59261.40735
131513.37211.62789
141313.7893-0.789318
151412.90611.09391
161113.1509-2.15088
171213.6709-1.67093
181413.39340.606632
191313.4894-0.489442
201213.3231-1.32313
211513.5921.408
221513.79461.2054
231414.0157-0.0157244
241413.80990.190105
251213.5706-1.57057
261214.1405-2.14046
271213.7267-1.72675
281513.13961.86045
291413.48670.513285
301613.53382.46618
311213.1453-1.14531
321213.5863-1.58631
331413.42840.571623
341613.79062.20945
351513.2831.71698
361213.2792-1.27924
371413.50440.495572
381313.4951-0.495118
391413.76090.239089
401613.61172.38828
411213.291-1.29102
421413.5880.411983
431513.65261.3474
441313.5815-0.581542
451612.9293.07103
461613.86472.13527
471213.2554-1.25542
481213.2401-1.24011
491613.16392.83609
501213.1546-1.15455
511513.32661.67342
521212.8058-0.80577
531313.5036-0.503598
541213.5608-1.56077
551413.42610.573886
561413.30110.698938
571113.3963-2.3963
581013.4694-3.46941
591212.8504-0.85035
601113.1625-2.16254
611613.60862.39142
621413.69820.30181
631413.16910.830919
641513.89461.10541
651513.78791.21209
661412.99981.00025
671313.8551-0.855147
681113.8826-2.88255
691613.9152.08496
701213.2563-1.25629
711513.85311.14689
721413.39140.608645
731513.00921.99083
741413.27480.725234
751313.4633-0.463289
76613.1601-7.16013
771213.6381-1.63806
781213.3033-1.30329
791413.57330.42672
801413.07350.926501
811513.27241.72763
821113.207-2.20699
831313.3013-0.301315
841413.11580.884218
851613.15352.84645
861313.4065-0.406485
871413.24770.752316
881613.14232.8577
891113.1281-2.1281
901313.1725-0.172505
911313.4073-0.407278
921512.99972.00035
931213.2699-1.26992
941313.3569-0.356869
951213.1672-1.16716
961413.20120.79878
971413.31190.68814
981613.36872.63134
991513.20661.79345
1001413.15190.848071
1011313.3487-0.34873
1021412.97531.02466
1031513.21151.78846
1041413.10090.899095
1051213.4232-1.42318
106713.1679-6.16787
1071213.2586-1.25856
1081513.22221.77779
1091213.1295-1.12952
1101312.84990.150139
1111113.1583-2.15827
1121413.32580.674244


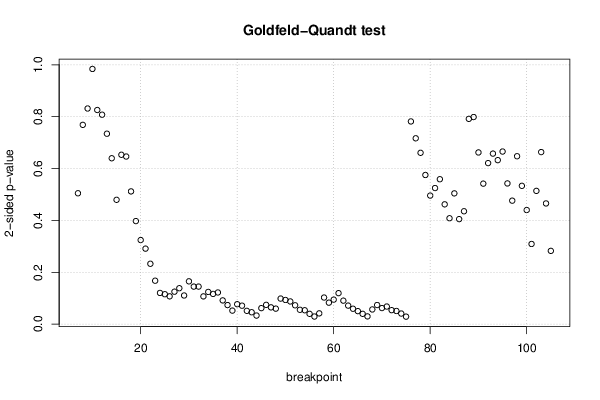
Goldfeld-Quandt test for Heteroskedasticity
p-valuesAlternative Hypothesis
breakpoint indexgreater2-sidedless
70.7476510.5046980.252349
80.6156650.7686710.384335
90.5841530.8316940.415847
100.4921420.9842830.507858
110.4129560.8259130.587044
120.4038240.8076490.596176
130.3672270.7344540.632773
140.3198920.6397840.680108
150.2397140.4794270.760286
160.3266170.6532350.673383
170.3232310.6464610.676769
180.2559540.5119080.744046
190.1987420.3974830.801258
200.1620950.324190.837905
210.1455310.2910620.854469
220.1163630.2327260.883637
230.08367630.1673530.916324
240.06005640.1201130.939944
250.05760870.1152170.942391
260.0535530.1071060.946447
270.06248970.1249790.93751
280.0691810.1383620.930819
290.05519280.1103860.944807
300.08248270.1649650.917517
310.07233440.1446690.927666
320.07233310.1446660.927667
330.05344790.1068960.946552
340.06199180.1239840.938008
350.05815760.1163150.941842
360.06101120.1220220.938989
370.04569080.09138160.954309
380.03669290.07338580.963307
390.02600410.05200830.973996
400.03837860.07675720.961621
410.03547310.07094610.964527
420.02554820.05109650.974452
430.02285290.04570570.977147
440.01648350.0329670.983516
450.03075950.0615190.96924
460.03711310.07422620.962887
470.03229140.06458270.967709
480.02978990.05957990.97021
490.04924760.09849520.950752
500.04650110.09300220.953499
510.04365980.08731950.95634
520.0362970.07259390.963703
530.02757150.05514290.972429
540.02669820.05339640.973302
550.01980930.03961870.980191
560.01459340.02918670.985407
570.02069990.04139990.9793
580.05123590.1024720.948764
590.04134420.08268830.958656
600.04716370.09432740.952836
610.05970370.1194070.940296
620.04520.09040.9548
630.03565780.07131550.964342
640.02957120.05914240.970429
650.02503080.05006160.974969
660.01981430.03962860.980186
670.01488690.02977380.985113
680.02824070.05648130.971759
690.03677040.07354090.96323
700.03095840.06191680.969042
710.03386540.06773080.966135
720.02686040.05372090.97314
730.02527360.05054730.974726
740.02032560.04065130.979674
750.01434660.02869310.985653
760.3908870.7817740.609113
770.3584130.7168260.641587
780.3303970.6607940.669603
790.2875990.5751970.712401
800.2478740.4957480.752126
810.2624520.5249030.737548
820.2794340.5588680.720566
830.2310260.4620520.768974
840.204190.4083790.79581
850.2521580.5043160.747842
860.2024970.4049950.797503
870.2176760.4353520.782324
880.3958720.7917430.604128
890.3993620.7987230.600638
900.3310910.6621810.668909
910.2709190.5418380.729081
920.3105240.6210480.689476
930.3288650.657730.671135
940.316240.6324810.68376
950.3328340.6656670.667166
960.2713160.5426320.728684
970.2380630.4761270.761937
980.3237730.6475450.676227
990.2667120.5334230.733288
1000.2200360.4400720.779964
1010.1545280.3090560.845472
1020.2569610.5139230.743039
1030.3318120.6636250.668188
1040.2327110.4654230.767289
1050.1412570.2825140.858743

\begin{tabular}{lllllllll}
\hline
Goldfeld-Quandt test for Heteroskedasticity \tabularnewline
p-values & Alternative Hypothesis \tabularnewline
breakpoint index & greater & 2-sided & less \tabularnewline
7 & 0.747651 & 0.504698 & 0.252349 \tabularnewline
8 & 0.615665 & 0.768671 & 0.384335 \tabularnewline
9 & 0.584153 & 0.831694 & 0.415847 \tabularnewline
10 & 0.492142 & 0.984283 & 0.507858 \tabularnewline
11 & 0.412956 & 0.825913 & 0.587044 \tabularnewline
12 & 0.403824 & 0.807649 & 0.596176 \tabularnewline
13 & 0.367227 & 0.734454 & 0.632773 \tabularnewline
14 & 0.319892 & 0.639784 & 0.680108 \tabularnewline
15 & 0.239714 & 0.479427 & 0.760286 \tabularnewline
16 & 0.326617 & 0.653235 & 0.673383 \tabularnewline
17 & 0.323231 & 0.646461 & 0.676769 \tabularnewline
18 & 0.255954 & 0.511908 & 0.744046 \tabularnewline
19 & 0.198742 & 0.397483 & 0.801258 \tabularnewline
20 & 0.162095 & 0.32419 & 0.837905 \tabularnewline
21 & 0.145531 & 0.291062 & 0.854469 \tabularnewline
22 & 0.116363 & 0.232726 & 0.883637 \tabularnewline
23 & 0.0836763 & 0.167353 & 0.916324 \tabularnewline
24 & 0.0600564 & 0.120113 & 0.939944 \tabularnewline
25 & 0.0576087 & 0.115217 & 0.942391 \tabularnewline
26 & 0.053553 & 0.107106 & 0.946447 \tabularnewline
27 & 0.0624897 & 0.124979 & 0.93751 \tabularnewline
28 & 0.069181 & 0.138362 & 0.930819 \tabularnewline
29 & 0.0551928 & 0.110386 & 0.944807 \tabularnewline
30 & 0.0824827 & 0.164965 & 0.917517 \tabularnewline
31 & 0.0723344 & 0.144669 & 0.927666 \tabularnewline
32 & 0.0723331 & 0.144666 & 0.927667 \tabularnewline
33 & 0.0534479 & 0.106896 & 0.946552 \tabularnewline
34 & 0.0619918 & 0.123984 & 0.938008 \tabularnewline
35 & 0.0581576 & 0.116315 & 0.941842 \tabularnewline
36 & 0.0610112 & 0.122022 & 0.938989 \tabularnewline
37 & 0.0456908 & 0.0913816 & 0.954309 \tabularnewline
38 & 0.0366929 & 0.0733858 & 0.963307 \tabularnewline
39 & 0.0260041 & 0.0520083 & 0.973996 \tabularnewline
40 & 0.0383786 & 0.0767572 & 0.961621 \tabularnewline
41 & 0.0354731 & 0.0709461 & 0.964527 \tabularnewline
42 & 0.0255482 & 0.0510965 & 0.974452 \tabularnewline
43 & 0.0228529 & 0.0457057 & 0.977147 \tabularnewline
44 & 0.0164835 & 0.032967 & 0.983516 \tabularnewline
45 & 0.0307595 & 0.061519 & 0.96924 \tabularnewline
46 & 0.0371131 & 0.0742262 & 0.962887 \tabularnewline
47 & 0.0322914 & 0.0645827 & 0.967709 \tabularnewline
48 & 0.0297899 & 0.0595799 & 0.97021 \tabularnewline
49 & 0.0492476 & 0.0984952 & 0.950752 \tabularnewline
50 & 0.0465011 & 0.0930022 & 0.953499 \tabularnewline
51 & 0.0436598 & 0.0873195 & 0.95634 \tabularnewline
52 & 0.036297 & 0.0725939 & 0.963703 \tabularnewline
53 & 0.0275715 & 0.0551429 & 0.972429 \tabularnewline
54 & 0.0266982 & 0.0533964 & 0.973302 \tabularnewline
55 & 0.0198093 & 0.0396187 & 0.980191 \tabularnewline
56 & 0.0145934 & 0.0291867 & 0.985407 \tabularnewline
57 & 0.0206999 & 0.0413999 & 0.9793 \tabularnewline
58 & 0.0512359 & 0.102472 & 0.948764 \tabularnewline
59 & 0.0413442 & 0.0826883 & 0.958656 \tabularnewline
60 & 0.0471637 & 0.0943274 & 0.952836 \tabularnewline
61 & 0.0597037 & 0.119407 & 0.940296 \tabularnewline
62 & 0.0452 & 0.0904 & 0.9548 \tabularnewline
63 & 0.0356578 & 0.0713155 & 0.964342 \tabularnewline
64 & 0.0295712 & 0.0591424 & 0.970429 \tabularnewline
65 & 0.0250308 & 0.0500616 & 0.974969 \tabularnewline
66 & 0.0198143 & 0.0396286 & 0.980186 \tabularnewline
67 & 0.0148869 & 0.0297738 & 0.985113 \tabularnewline
68 & 0.0282407 & 0.0564813 & 0.971759 \tabularnewline
69 & 0.0367704 & 0.0735409 & 0.96323 \tabularnewline
70 & 0.0309584 & 0.0619168 & 0.969042 \tabularnewline
71 & 0.0338654 & 0.0677308 & 0.966135 \tabularnewline
72 & 0.0268604 & 0.0537209 & 0.97314 \tabularnewline
73 & 0.0252736 & 0.0505473 & 0.974726 \tabularnewline
74 & 0.0203256 & 0.0406513 & 0.979674 \tabularnewline
75 & 0.0143466 & 0.0286931 & 0.985653 \tabularnewline
76 & 0.390887 & 0.781774 & 0.609113 \tabularnewline
77 & 0.358413 & 0.716826 & 0.641587 \tabularnewline
78 & 0.330397 & 0.660794 & 0.669603 \tabularnewline
79 & 0.287599 & 0.575197 & 0.712401 \tabularnewline
80 & 0.247874 & 0.495748 & 0.752126 \tabularnewline
81 & 0.262452 & 0.524903 & 0.737548 \tabularnewline
82 & 0.279434 & 0.558868 & 0.720566 \tabularnewline
83 & 0.231026 & 0.462052 & 0.768974 \tabularnewline
84 & 0.20419 & 0.408379 & 0.79581 \tabularnewline
85 & 0.252158 & 0.504316 & 0.747842 \tabularnewline
86 & 0.202497 & 0.404995 & 0.797503 \tabularnewline
87 & 0.217676 & 0.435352 & 0.782324 \tabularnewline
88 & 0.395872 & 0.791743 & 0.604128 \tabularnewline
89 & 0.399362 & 0.798723 & 0.600638 \tabularnewline
90 & 0.331091 & 0.662181 & 0.668909 \tabularnewline
91 & 0.270919 & 0.541838 & 0.729081 \tabularnewline
92 & 0.310524 & 0.621048 & 0.689476 \tabularnewline
93 & 0.328865 & 0.65773 & 0.671135 \tabularnewline
94 & 0.31624 & 0.632481 & 0.68376 \tabularnewline
95 & 0.332834 & 0.665667 & 0.667166 \tabularnewline
96 & 0.271316 & 0.542632 & 0.728684 \tabularnewline
97 & 0.238063 & 0.476127 & 0.761937 \tabularnewline
98 & 0.323773 & 0.647545 & 0.676227 \tabularnewline
99 & 0.266712 & 0.533423 & 0.733288 \tabularnewline
100 & 0.220036 & 0.440072 & 0.779964 \tabularnewline
101 & 0.154528 & 0.309056 & 0.845472 \tabularnewline
102 & 0.256961 & 0.513923 & 0.743039 \tabularnewline
103 & 0.331812 & 0.663625 & 0.668188 \tabularnewline
104 & 0.232711 & 0.465423 & 0.767289 \tabularnewline
105 & 0.141257 & 0.282514 & 0.858743 \tabularnewline
\hline
\end{tabular}
%Source: https://freestatistics.org/blog/index.php?pk=270683&T=5

[TABLE]
[ROW][C]Goldfeld-Quandt test for Heteroskedasticity[/C][/ROW]
[ROW][C]p-values[/C][C]Alternative Hypothesis[/C][/ROW]
[ROW][C]breakpoint index[/C][C]greater[/C][C]2-sided[/C][C]less[/C][/ROW]
[ROW][C]7[/C][C]0.747651[/C][C]0.504698[/C][C]0.252349[/C][/ROW]
[ROW][C]8[/C][C]0.615665[/C][C]0.768671[/C][C]0.384335[/C][/ROW]
[ROW][C]9[/C][C]0.584153[/C][C]0.831694[/C][C]0.415847[/C][/ROW]
[ROW][C]10[/C][C]0.492142[/C][C]0.984283[/C][C]0.507858[/C][/ROW]
[ROW][C]11[/C][C]0.412956[/C][C]0.825913[/C][C]0.587044[/C][/ROW]
[ROW][C]12[/C][C]0.403824[/C][C]0.807649[/C][C]0.596176[/C][/ROW]
[ROW][C]13[/C][C]0.367227[/C][C]0.734454[/C][C]0.632773[/C][/ROW]
[ROW][C]14[/C][C]0.319892[/C][C]0.639784[/C][C]0.680108[/C][/ROW]
[ROW][C]15[/C][C]0.239714[/C][C]0.479427[/C][C]0.760286[/C][/ROW]
[ROW][C]16[/C][C]0.326617[/C][C]0.653235[/C][C]0.673383[/C][/ROW]
[ROW][C]17[/C][C]0.323231[/C][C]0.646461[/C][C]0.676769[/C][/ROW]
[ROW][C]18[/C][C]0.255954[/C][C]0.511908[/C][C]0.744046[/C][/ROW]
[ROW][C]19[/C][C]0.198742[/C][C]0.397483[/C][C]0.801258[/C][/ROW]
[ROW][C]20[/C][C]0.162095[/C][C]0.32419[/C][C]0.837905[/C][/ROW]
[ROW][C]21[/C][C]0.145531[/C][C]0.291062[/C][C]0.854469[/C][/ROW]
[ROW][C]22[/C][C]0.116363[/C][C]0.232726[/C][C]0.883637[/C][/ROW]
[ROW][C]23[/C][C]0.0836763[/C][C]0.167353[/C][C]0.916324[/C][/ROW]
[ROW][C]24[/C][C]0.0600564[/C][C]0.120113[/C][C]0.939944[/C][/ROW]
[ROW][C]25[/C][C]0.0576087[/C][C]0.115217[/C][C]0.942391[/C][/ROW]
[ROW][C]26[/C][C]0.053553[/C][C]0.107106[/C][C]0.946447[/C][/ROW]
[ROW][C]27[/C][C]0.0624897[/C][C]0.124979[/C][C]0.93751[/C][/ROW]
[ROW][C]28[/C][C]0.069181[/C][C]0.138362[/C][C]0.930819[/C][/ROW]
[ROW][C]29[/C][C]0.0551928[/C][C]0.110386[/C][C]0.944807[/C][/ROW]
[ROW][C]30[/C][C]0.0824827[/C][C]0.164965[/C][C]0.917517[/C][/ROW]
[ROW][C]31[/C][C]0.0723344[/C][C]0.144669[/C][C]0.927666[/C][/ROW]
[ROW][C]32[/C][C]0.0723331[/C][C]0.144666[/C][C]0.927667[/C][/ROW]
[ROW][C]33[/C][C]0.0534479[/C][C]0.106896[/C][C]0.946552[/C][/ROW]
[ROW][C]34[/C][C]0.0619918[/C][C]0.123984[/C][C]0.938008[/C][/ROW]
[ROW][C]35[/C][C]0.0581576[/C][C]0.116315[/C][C]0.941842[/C][/ROW]
[ROW][C]36[/C][C]0.0610112[/C][C]0.122022[/C][C]0.938989[/C][/ROW]
[ROW][C]37[/C][C]0.0456908[/C][C]0.0913816[/C][C]0.954309[/C][/ROW]
[ROW][C]38[/C][C]0.0366929[/C][C]0.0733858[/C][C]0.963307[/C][/ROW]
[ROW][C]39[/C][C]0.0260041[/C][C]0.0520083[/C][C]0.973996[/C][/ROW]
[ROW][C]40[/C][C]0.0383786[/C][C]0.0767572[/C][C]0.961621[/C][/ROW]
[ROW][C]41[/C][C]0.0354731[/C][C]0.0709461[/C][C]0.964527[/C][/ROW]
[ROW][C]42[/C][C]0.0255482[/C][C]0.0510965[/C][C]0.974452[/C][/ROW]
[ROW][C]43[/C][C]0.0228529[/C][C]0.0457057[/C][C]0.977147[/C][/ROW]
[ROW][C]44[/C][C]0.0164835[/C][C]0.032967[/C][C]0.983516[/C][/ROW]
[ROW][C]45[/C][C]0.0307595[/C][C]0.061519[/C][C]0.96924[/C][/ROW]
[ROW][C]46[/C][C]0.0371131[/C][C]0.0742262[/C][C]0.962887[/C][/ROW]
[ROW][C]47[/C][C]0.0322914[/C][C]0.0645827[/C][C]0.967709[/C][/ROW]
[ROW][C]48[/C][C]0.0297899[/C][C]0.0595799[/C][C]0.97021[/C][/ROW]
[ROW][C]49[/C][C]0.0492476[/C][C]0.0984952[/C][C]0.950752[/C][/ROW]
[ROW][C]50[/C][C]0.0465011[/C][C]0.0930022[/C][C]0.953499[/C][/ROW]
[ROW][C]51[/C][C]0.0436598[/C][C]0.0873195[/C][C]0.95634[/C][/ROW]
[ROW][C]52[/C][C]0.036297[/C][C]0.0725939[/C][C]0.963703[/C][/ROW]
[ROW][C]53[/C][C]0.0275715[/C][C]0.0551429[/C][C]0.972429[/C][/ROW]
[ROW][C]54[/C][C]0.0266982[/C][C]0.0533964[/C][C]0.973302[/C][/ROW]
[ROW][C]55[/C][C]0.0198093[/C][C]0.0396187[/C][C]0.980191[/C][/ROW]
[ROW][C]56[/C][C]0.0145934[/C][C]0.0291867[/C][C]0.985407[/C][/ROW]
[ROW][C]57[/C][C]0.0206999[/C][C]0.0413999[/C][C]0.9793[/C][/ROW]
[ROW][C]58[/C][C]0.0512359[/C][C]0.102472[/C][C]0.948764[/C][/ROW]
[ROW][C]59[/C][C]0.0413442[/C][C]0.0826883[/C][C]0.958656[/C][/ROW]
[ROW][C]60[/C][C]0.0471637[/C][C]0.0943274[/C][C]0.952836[/C][/ROW]
[ROW][C]61[/C][C]0.0597037[/C][C]0.119407[/C][C]0.940296[/C][/ROW]
[ROW][C]62[/C][C]0.0452[/C][C]0.0904[/C][C]0.9548[/C][/ROW]
[ROW][C]63[/C][C]0.0356578[/C][C]0.0713155[/C][C]0.964342[/C][/ROW]
[ROW][C]64[/C][C]0.0295712[/C][C]0.0591424[/C][C]0.970429[/C][/ROW]
[ROW][C]65[/C][C]0.0250308[/C][C]0.0500616[/C][C]0.974969[/C][/ROW]
[ROW][C]66[/C][C]0.0198143[/C][C]0.0396286[/C][C]0.980186[/C][/ROW]
[ROW][C]67[/C][C]0.0148869[/C][C]0.0297738[/C][C]0.985113[/C][/ROW]
[ROW][C]68[/C][C]0.0282407[/C][C]0.0564813[/C][C]0.971759[/C][/ROW]
[ROW][C]69[/C][C]0.0367704[/C][C]0.0735409[/C][C]0.96323[/C][/ROW]
[ROW][C]70[/C][C]0.0309584[/C][C]0.0619168[/C][C]0.969042[/C][/ROW]
[ROW][C]71[/C][C]0.0338654[/C][C]0.0677308[/C][C]0.966135[/C][/ROW]
[ROW][C]72[/C][C]0.0268604[/C][C]0.0537209[/C][C]0.97314[/C][/ROW]
[ROW][C]73[/C][C]0.0252736[/C][C]0.0505473[/C][C]0.974726[/C][/ROW]
[ROW][C]74[/C][C]0.0203256[/C][C]0.0406513[/C][C]0.979674[/C][/ROW]
[ROW][C]75[/C][C]0.0143466[/C][C]0.0286931[/C][C]0.985653[/C][/ROW]
[ROW][C]76[/C][C]0.390887[/C][C]0.781774[/C][C]0.609113[/C][/ROW]
[ROW][C]77[/C][C]0.358413[/C][C]0.716826[/C][C]0.641587[/C][/ROW]
[ROW][C]78[/C][C]0.330397[/C][C]0.660794[/C][C]0.669603[/C][/ROW]
[ROW][C]79[/C][C]0.287599[/C][C]0.575197[/C][C]0.712401[/C][/ROW]
[ROW][C]80[/C][C]0.247874[/C][C]0.495748[/C][C]0.752126[/C][/ROW]
[ROW][C]81[/C][C]0.262452[/C][C]0.524903[/C][C]0.737548[/C][/ROW]
[ROW][C]82[/C][C]0.279434[/C][C]0.558868[/C][C]0.720566[/C][/ROW]
[ROW][C]83[/C][C]0.231026[/C][C]0.462052[/C][C]0.768974[/C][/ROW]
[ROW][C]84[/C][C]0.20419[/C][C]0.408379[/C][C]0.79581[/C][/ROW]
[ROW][C]85[/C][C]0.252158[/C][C]0.504316[/C][C]0.747842[/C][/ROW]
[ROW][C]86[/C][C]0.202497[/C][C]0.404995[/C][C]0.797503[/C][/ROW]
[ROW][C]87[/C][C]0.217676[/C][C]0.435352[/C][C]0.782324[/C][/ROW]
[ROW][C]88[/C][C]0.395872[/C][C]0.791743[/C][C]0.604128[/C][/ROW]
[ROW][C]89[/C][C]0.399362[/C][C]0.798723[/C][C]0.600638[/C][/ROW]
[ROW][C]90[/C][C]0.331091[/C][C]0.662181[/C][C]0.668909[/C][/ROW]
[ROW][C]91[/C][C]0.270919[/C][C]0.541838[/C][C]0.729081[/C][/ROW]
[ROW][C]92[/C][C]0.310524[/C][C]0.621048[/C][C]0.689476[/C][/ROW]
[ROW][C]93[/C][C]0.328865[/C][C]0.65773[/C][C]0.671135[/C][/ROW]
[ROW][C]94[/C][C]0.31624[/C][C]0.632481[/C][C]0.68376[/C][/ROW]
[ROW][C]95[/C][C]0.332834[/C][C]0.665667[/C][C]0.667166[/C][/ROW]
[ROW][C]96[/C][C]0.271316[/C][C]0.542632[/C][C]0.728684[/C][/ROW]
[ROW][C]97[/C][C]0.238063[/C][C]0.476127[/C][C]0.761937[/C][/ROW]
[ROW][C]98[/C][C]0.323773[/C][C]0.647545[/C][C]0.676227[/C][/ROW]
[ROW][C]99[/C][C]0.266712[/C][C]0.533423[/C][C]0.733288[/C][/ROW]
[ROW][C]100[/C][C]0.220036[/C][C]0.440072[/C][C]0.779964[/C][/ROW]
[ROW][C]101[/C][C]0.154528[/C][C]0.309056[/C][C]0.845472[/C][/ROW]
[ROW][C]102[/C][C]0.256961[/C][C]0.513923[/C][C]0.743039[/C][/ROW]
[ROW][C]103[/C][C]0.331812[/C][C]0.663625[/C][C]0.668188[/C][/ROW]
[ROW][C]104[/C][C]0.232711[/C][C]0.465423[/C][C]0.767289[/C][/ROW]
[ROW][C]105[/C][C]0.141257[/C][C]0.282514[/C][C]0.858743[/C][/ROW]
[/TABLE]
Source: https://freestatistics.org/blog/index.php?pk=270683&T=5

Globally Unique Identifier (entire table): ba.freestatistics.org/blog/index.php?pk=270683&T=5

As an alternative you can also use a QR Code:  

The GUIDs for individual cells are displayed in the table below:

Goldfeld-Quandt test for Heteroskedasticity
p-valuesAlternative Hypothesis
breakpoint indexgreater2-sidedless
70.7476510.5046980.252349
80.6156650.7686710.384335
90.5841530.8316940.415847
100.4921420.9842830.507858
110.4129560.8259130.587044
120.4038240.8076490.596176
130.3672270.7344540.632773
140.3198920.6397840.680108
150.2397140.4794270.760286
160.3266170.6532350.673383
170.3232310.6464610.676769
180.2559540.5119080.744046
190.1987420.3974830.801258
200.1620950.324190.837905
210.1455310.2910620.854469
220.1163630.2327260.883637
230.08367630.1673530.916324
240.06005640.1201130.939944
250.05760870.1152170.942391
260.0535530.1071060.946447
270.06248970.1249790.93751
280.0691810.1383620.930819
290.05519280.1103860.944807
300.08248270.1649650.917517
310.07233440.1446690.927666
320.07233310.1446660.927667
330.05344790.1068960.946552
340.06199180.1239840.938008
350.05815760.1163150.941842
360.06101120.1220220.938989
370.04569080.09138160.954309
380.03669290.07338580.963307
390.02600410.05200830.973996
400.03837860.07675720.961621
410.03547310.07094610.964527
420.02554820.05109650.974452
430.02285290.04570570.977147
440.01648350.0329670.983516
450.03075950.0615190.96924
460.03711310.07422620.962887
470.03229140.06458270.967709
480.02978990.05957990.97021
490.04924760.09849520.950752
500.04650110.09300220.953499
510.04365980.08731950.95634
520.0362970.07259390.963703
530.02757150.05514290.972429
540.02669820.05339640.973302
550.01980930.03961870.980191
560.01459340.02918670.985407
570.02069990.04139990.9793
580.05123590.1024720.948764
590.04134420.08268830.958656
600.04716370.09432740.952836
610.05970370.1194070.940296
620.04520.09040.9548
630.03565780.07131550.964342
640.02957120.05914240.970429
650.02503080.05006160.974969
660.01981430.03962860.980186
670.01488690.02977380.985113
680.02824070.05648130.971759
690.03677040.07354090.96323
700.03095840.06191680.969042
710.03386540.06773080.966135
720.02686040.05372090.97314
730.02527360.05054730.974726
740.02032560.04065130.979674
750.01434660.02869310.985653
760.3908870.7817740.609113
770.3584130.7168260.641587
780.3303970.6607940.669603
790.2875990.5751970.712401
800.2478740.4957480.752126
810.2624520.5249030.737548
820.2794340.5588680.720566
830.2310260.4620520.768974
840.204190.4083790.79581
850.2521580.5043160.747842
860.2024970.4049950.797503
870.2176760.4353520.782324
880.3958720.7917430.604128
890.3993620.7987230.600638
900.3310910.6621810.668909
910.2709190.5418380.729081
920.3105240.6210480.689476
930.3288650.657730.671135
940.316240.6324810.68376
950.3328340.6656670.667166
960.2713160.5426320.728684
970.2380630.4761270.761937
980.3237730.6475450.676227
990.2667120.5334230.733288
1000.2200360.4400720.779964
1010.1545280.3090560.845472
1020.2569610.5139230.743039
1030.3318120.6636250.668188
1040.2327110.4654230.767289
1050.1412570.2825140.858743


Meta Analysis of Goldfeld-Quandt test for Heteroskedasticity
Description# significant tests% significant testsOK/NOK
1% type I error level00OK
5% type I error level90.0909091NOK
10% type I error level370.373737NOK

\begin{tabular}{lllllllll}
\hline
Meta Analysis of Goldfeld-Quandt test for Heteroskedasticity \tabularnewline
Description & # significant tests & % significant tests & OK/NOK \tabularnewline
1% type I error level & 0 & 0 & OK \tabularnewline
5% type I error level & 9 & 0.0909091 & NOK \tabularnewline
10% type I error level & 37 & 0.373737 & NOK \tabularnewline
\hline
\end{tabular}
%Source: https://freestatistics.org/blog/index.php?pk=270683&T=6

[TABLE]
[ROW][C]Meta Analysis of Goldfeld-Quandt test for Heteroskedasticity[/C][/ROW]
[ROW][C]Description[/C][C]# significant tests[/C][C]% significant tests[/C][C]OK/NOK[/C][/ROW]
[ROW][C]1% type I error level[/C][C]0[/C][C]0[/C][C]OK[/C][/ROW]
[ROW][C]5% type I error level[/C][C]9[/C][C]0.0909091[/C][C]NOK[/C][/ROW]
[ROW][C]10% type I error level[/C][C]37[/C][C]0.373737[/C][C]NOK[/C][/ROW]
[/TABLE]
Source: https://freestatistics.org/blog/index.php?pk=270683&T=6

Globally Unique Identifier (entire table): ba.freestatistics.org/blog/index.php?pk=270683&T=6

As an alternative you can also use a QR Code:  

The GUIDs for individual cells are displayed in the table below:

Meta Analysis of Goldfeld-Quandt test for Heteroskedasticity
Description# significant tests% significant testsOK/NOK
1% type I error level00OK
5% type I error level90.0909091NOK
10% type I error level370.373737NOK


Parameters (Session):
par1 = 1 ; par2 = Do not include Seasonal Dummies ; par3 = No Linear Trend ;
Parameters (R input):
par1 = 1 ; par2 = Do not include Seasonal Dummies ; par3 = No Linear Trend ;
R code (references can be found in the software module):
library(lattice)
library(lmtest)
n25 <- 25 #minimum number of obs. for Goldfeld-Quandt test
par1 <- as.numeric(par1)
x <- t(y)
k <- length(x[1,])
n <- length(x[,1])
x1 <- cbind(x[,par1], x[,1:k!=par1])
mycolnames <- c(colnames(x)[par1], colnames(x)[1:k!=par1])
colnames(x1) <- mycolnames #colnames(x)[par1]
x <- x1
if (par3 == 'First Differences'){
x2 <- array(0, dim=c(n-1,k), dimnames=list(1:(n-1), paste('(1-B)',colnames(x),sep='')))
for (i in 1:n-1) {
for (j in 1:k) {
x2[i,j] <- x[i+1,j] - x[i,j]
}
}
x <- x2
}
if (par2 == 'Include Monthly Dummies'){
x2 <- array(0, dim=c(n,11), dimnames=list(1:n, paste('M', seq(1:11), sep ='')))
for (i in 1:11){
x2[seq(i,n,12),i] <- 1
}
x <- cbind(x, x2)
}
if (par2 == 'Include Quarterly Dummies'){
x2 <- array(0, dim=c(n,3), dimnames=list(1:n, paste('Q', seq(1:3), sep ='')))
for (i in 1:3){
x2[seq(i,n,4),i] <- 1
}
x <- cbind(x, x2)
}
k <- length(x[1,])
if (par3 == 'Linear Trend'){
x <- cbind(x, c(1:n))
colnames(x)[k+1] <- 't'
}
x
k <- length(x[1,])
df <- as.data.frame(x)
(mylm <- lm(df))
(mysum <- summary(mylm))
if (n > n25) {
kp3 <- k + 3
nmkm3 <- n - k - 3
gqarr <- array(NA, dim=c(nmkm3-kp3+1,3))
numgqtests <- 0
numsignificant1 <- 0
numsignificant5 <- 0
numsignificant10 <- 0
for (mypoint in kp3:nmkm3) {
j <- 0
numgqtests <- numgqtests + 1
for (myalt in c('greater', 'two.sided', 'less')) {
j <- j + 1
gqarr[mypoint-kp3+1,j] <- gqtest(mylm, point=mypoint, alternative=myalt)$p.value
}
if (gqarr[mypoint-kp3+1,2] < 0.01) numsignificant1 <- numsignificant1 + 1
if (gqarr[mypoint-kp3+1,2] < 0.05) numsignificant5 <- numsignificant5 + 1
if (gqarr[mypoint-kp3+1,2] < 0.10) numsignificant10 <- numsignificant10 + 1
}
gqarr
}
bitmap(file='test0.png')
plot(x[,1], type='l', main='Actuals and Interpolation', ylab='value of Actuals and Interpolation (dots)', xlab='time or index')
points(x[,1]-mysum$resid)
grid()
dev.off()
bitmap(file='test1.png')
plot(mysum$resid, type='b', pch=19, main='Residuals', ylab='value of Residuals', xlab='time or index')
grid()
dev.off()
bitmap(file='test2.png')
hist(mysum$resid, main='Residual Histogram', xlab='values of Residuals')
grid()
dev.off()
bitmap(file='test3.png')
densityplot(~mysum$resid,col='black',main='Residual Density Plot', xlab='values of Residuals')
dev.off()
bitmap(file='test4.png')
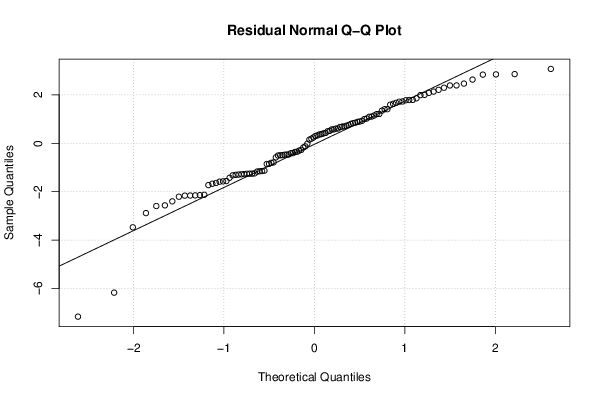
qqnorm(mysum$resid, main='Residual Normal Q-Q Plot')
qqline(mysum$resid)
grid()
dev.off()
(myerror <- as.ts(mysum$resid))
bitmap(file='test5.png')
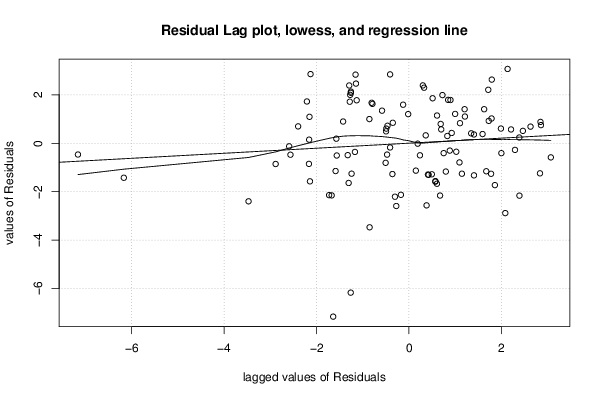
dum <- cbind(lag(myerror,k=1),myerror)
dum
dum1 <- dum[2:length(myerror),]
dum1
z <- as.data.frame(dum1)
z
plot(z,main=paste('Residual Lag plot, lowess, and regression line'), ylab='values of Residuals', xlab='lagged values of Residuals')
lines(lowess(z))
abline(lm(z))
grid()
dev.off()
bitmap(file='test6.png')
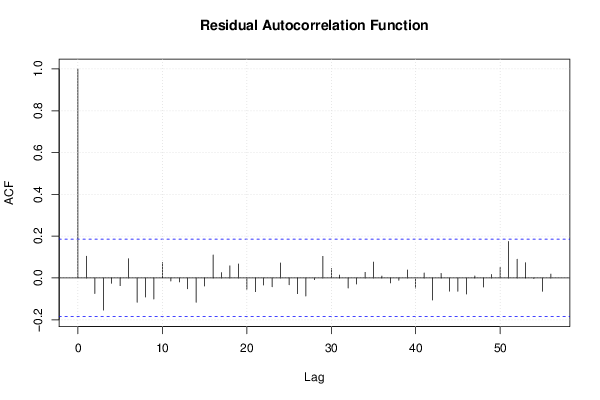
acf(mysum$resid, lag.max=length(mysum$resid)/2, main='Residual Autocorrelation Function')
grid()
dev.off()
bitmap(file='test7.png')
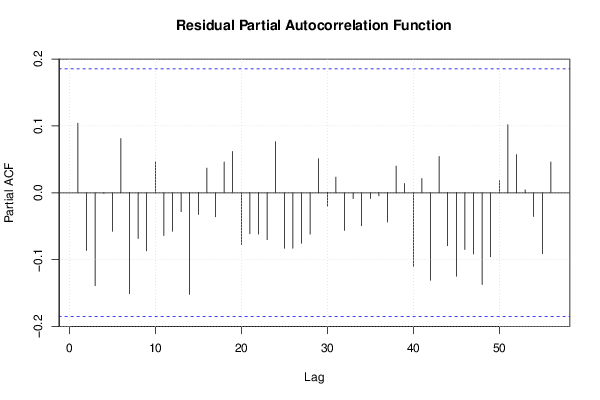
pacf(mysum$resid, lag.max=length(mysum$resid)/2, main='Residual Partial Autocorrelation Function')
grid()
dev.off()
bitmap(file='test8.png')
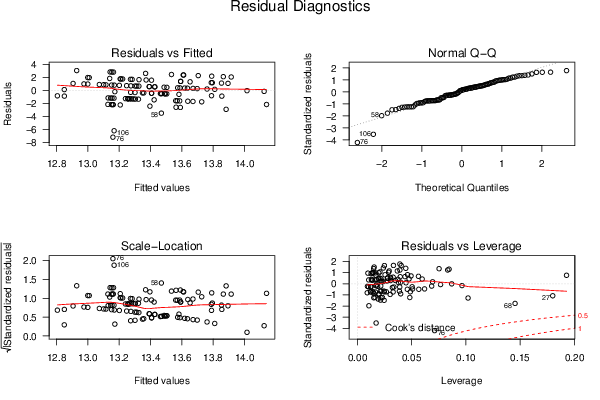
opar <- par(mfrow = c(2,2), oma = c(0, 0, 1.1, 0))
plot(mylm, las = 1, sub='Residual Diagnostics')
par(opar)
dev.off()
if (n > n25) {
bitmap(file='test9.png')
plot(kp3:nmkm3,gqarr[,2], main='Goldfeld-Quandt test',ylab='2-sided p-value',xlab='breakpoint')
grid()
dev.off()
}
load(file='createtable')
a<-table.start()
a<-table.row.start(a)
a<-table.element(a, 'Multiple Linear Regression - Estimated Regression Equation', 1, TRUE)
a<-table.row.end(a)
myeq <- colnames(x)[1]
myeq <- paste(myeq, '[t] = ', sep='')
for (i in 1:k){
if (mysum$coefficients[i,1] > 0) myeq <- paste(myeq, '+', '')
myeq <- paste(myeq, signif(mysum$coefficients[i,1],6), sep=' ')
if (rownames(mysum$coefficients)[i] != '(Intercept)') {
myeq <- paste(myeq, rownames(mysum$coefficients)[i], sep='')
if (rownames(mysum$coefficients)[i] != 't') myeq <- paste(myeq, '[t]', sep='')
}
}
myeq <- paste(myeq, ' + e[t]')
a<-table.row.start(a)
a<-table.element(a, myeq)
a<-table.row.end(a)
a<-table.end(a)
table.save(a,file='mytable1.tab')
a<-table.start()
a<-table.row.start(a)
a<-table.element(a,hyperlink('ols1.htm','Multiple Linear Regression - Ordinary Least Squares',''), 6, TRUE)
a<-table.row.end(a)
a<-table.row.start(a)
a<-table.element(a,'Variable',header=TRUE)
a<-table.element(a,'Parameter',header=TRUE)
a<-table.element(a,'S.D.',header=TRUE)
a<-table.element(a,'T-STAT
H0: parameter = 0',header=TRUE)
a<-table.element(a,'2-tail p-value',header=TRUE)
a<-table.element(a,'1-tail p-value',header=TRUE)
a<-table.row.end(a)
for (i in 1:k){
a<-table.row.start(a)
a<-table.element(a,rownames(mysum$coefficients)[i],header=TRUE)
a<-table.element(a,signif(mysum$coefficients[i,1],6))
a<-table.element(a, signif(mysum$coefficients[i,2],6))
a<-table.element(a, signif(mysum$coefficients[i,3],4))
a<-table.element(a, signif(mysum$coefficients[i,4],6))
a<-table.element(a, signif(mysum$coefficients[i,4]/2,6))
a<-table.row.end(a)
}
a<-table.end(a)
table.save(a,file='mytable2.tab')
a<-table.start()
a<-table.row.start(a)
a<-table.element(a, 'Multiple Linear Regression - Regression Statistics', 2, TRUE)
a<-table.row.end(a)
a<-table.row.start(a)
a<-table.element(a, 'Multiple R',1,TRUE)
a<-table.element(a, signif(sqrt(mysum$r.squared),6))
a<-table.row.end(a)
a<-table.row.start(a)
a<-table.element(a, 'R-squared',1,TRUE)
a<-table.element(a, signif(mysum$r.squared,6))
a<-table.row.end(a)
a<-table.row.start(a)
a<-table.element(a, 'Adjusted R-squared',1,TRUE)
a<-table.element(a, signif(mysum$adj.r.squared,6))
a<-table.row.end(a)
a<-table.row.start(a)
a<-table.element(a, 'F-TEST (value)',1,TRUE)
a<-table.element(a, signif(mysum$fstatistic[1],6))
a<-table.row.end(a)
a<-table.row.start(a)
a<-table.element(a, 'F-TEST (DF numerator)',1,TRUE)
a<-table.element(a, signif(mysum$fstatistic[2],6))
a<-table.row.end(a)
a<-table.row.start(a)
a<-table.element(a, 'F-TEST (DF denominator)',1,TRUE)
a<-table.element(a, signif(mysum$fstatistic[3],6))
a<-table.row.end(a)
a<-table.row.start(a)
a<-table.element(a, 'p-value',1,TRUE)
a<-table.element(a, signif(1-pf(mysum$fstatistic[1],mysum$fstatistic[2],mysum$fstatistic[3]),6))
a<-table.row.end(a)
a<-table.row.start(a)
a<-table.element(a, 'Multiple Linear Regression - Residual Statistics', 2, TRUE)
a<-table.row.end(a)
a<-table.row.start(a)
a<-table.element(a, 'Residual Standard Deviation',1,TRUE)
a<-table.element(a, signif(mysum$sigma,6))
a<-table.row.end(a)
a<-table.row.start(a)
a<-table.element(a, 'Sum Squared Residuals',1,TRUE)
a<-table.element(a, signif(sum(myerror*myerror),6))
a<-table.row.end(a)
a<-table.end(a)
table.save(a,file='mytable3.tab')
a<-table.start()
a<-table.row.start(a)
a<-table.element(a, 'Multiple Linear Regression - Actuals, Interpolation, and Residuals', 4, TRUE)
a<-table.row.end(a)
a<-table.row.start(a)
a<-table.element(a, 'Time or Index', 1, TRUE)
a<-table.element(a, 'Actuals', 1, TRUE)
a<-table.element(a, 'Interpolation
Forecast', 1, TRUE)
a<-table.element(a, 'Residuals
Prediction Error', 1, TRUE)
a<-table.row.end(a)
for (i in 1:n) {
a<-table.row.start(a)
a<-table.element(a,i, 1, TRUE)
a<-table.element(a,signif(x[i],6))
a<-table.element(a,signif(x[i]-mysum$resid[i],6))
a<-table.element(a,signif(mysum$resid[i],6))
a<-table.row.end(a)
}
a<-table.end(a)
table.save(a,file='mytable4.tab')
if (n > n25) {
a<-table.start()
a<-table.row.start(a)
a<-table.element(a,'Goldfeld-Quandt test for Heteroskedasticity',4,TRUE)
a<-table.row.end(a)
a<-table.row.start(a)
a<-table.element(a,'p-values',header=TRUE)
a<-table.element(a,'Alternative Hypothesis',3,header=TRUE)
a<-table.row.end(a)
a<-table.row.start(a)
a<-table.element(a,'breakpoint index',header=TRUE)
a<-table.element(a,'greater',header=TRUE)
a<-table.element(a,'2-sided',header=TRUE)
a<-table.element(a,'less',header=TRUE)
a<-table.row.end(a)
for (mypoint in kp3:nmkm3) {
a<-table.row.start(a)
a<-table.element(a,mypoint,header=TRUE)
a<-table.element(a,signif(gqarr[mypoint-kp3+1,1],6))
a<-table.element(a,signif(gqarr[mypoint-kp3+1,2],6))
a<-table.element(a,signif(gqarr[mypoint-kp3+1,3],6))
a<-table.row.end(a)
}
a<-table.end(a)
table.save(a,file='mytable5.tab')
a<-table.start()
a<-table.row.start(a)
a<-table.element(a,'Meta Analysis of Goldfeld-Quandt test for Heteroskedasticity',4,TRUE)
a<-table.row.end(a)
a<-table.row.start(a)
a<-table.element(a,'Description',header=TRUE)
a<-table.element(a,'# significant tests',header=TRUE)
a<-table.element(a,'% significant tests',header=TRUE)
a<-table.element(a,'OK/NOK',header=TRUE)
a<-table.row.end(a)
a<-table.row.start(a)
a<-table.element(a,'1% type I error level',header=TRUE)
a<-table.element(a,signif(numsignificant1,6))
a<-table.element(a,signif(numsignificant1/numgqtests,6))
if (numsignificant1/numgqtests < 0.01) dum <- 'OK' else dum <- 'NOK'
a<-table.element(a,dum)
a<-table.row.end(a)
a<-table.row.start(a)
a<-table.element(a,'5% type I error level',header=TRUE)
a<-table.element(a,signif(numsignificant5,6))
a<-table.element(a,signif(numsignificant5/numgqtests,6))
if (numsignificant5/numgqtests < 0.05) dum <- 'OK' else dum <- 'NOK'
a<-table.element(a,dum)
a<-table.row.end(a)
a<-table.row.start(a)
a<-table.element(a,'10% type I error level',header=TRUE)
a<-table.element(a,signif(numsignificant10,6))
a<-table.element(a,signif(numsignificant10/numgqtests,6))
if (numsignificant10/numgqtests < 0.1) dum <- 'OK' else dum <- 'NOK'
a<-table.element(a,dum)
a<-table.row.end(a)
a<-table.end(a)
table.save(a,file='mytable6.tab')
}