Free Statistics
of Irreproducible Research!
Description of Statistical Computation | |||||||||||||||||||||||||||||||||||||||||
|---|---|---|---|---|---|---|---|---|---|---|---|---|---|---|---|---|---|---|---|---|---|---|---|---|---|---|---|---|---|---|---|---|---|---|---|---|---|---|---|---|---|
| Author's title | |||||||||||||||||||||||||||||||||||||||||
| Author | *Unverified author* | ||||||||||||||||||||||||||||||||||||||||
| R Software Module | rwasp_univariatedataseries.wasp | ||||||||||||||||||||||||||||||||||||||||
| Title produced by software | Univariate Data Series | ||||||||||||||||||||||||||||||||||||||||
| Date of computation | Sat, 11 Jan 2014 10:33:10 -0500 | ||||||||||||||||||||||||||||||||||||||||
| Cite this page as follows | Statistical Computations at FreeStatistics.org, Office for Research Development and Education, URL https://freestatistics.org/blog/index.php?v=date/2014/Jan/11/t1389454438q90wm0tt2gucf7x.htm/, Retrieved Wed, 22 May 2024 17:21:32 +0000 | ||||||||||||||||||||||||||||||||||||||||
| Statistical Computations at FreeStatistics.org, Office for Research Development and Education, URL https://freestatistics.org/blog/index.php?pk=232916, Retrieved Wed, 22 May 2024 17:21:32 +0000 | |||||||||||||||||||||||||||||||||||||||||
| QR Codes: | |||||||||||||||||||||||||||||||||||||||||
|
| |||||||||||||||||||||||||||||||||||||||||
| Original text written by user: | |||||||||||||||||||||||||||||||||||||||||
| IsPrivate? | No (this computation is public) | ||||||||||||||||||||||||||||||||||||||||
| User-defined keywords | |||||||||||||||||||||||||||||||||||||||||
| Estimated Impact | 156 | ||||||||||||||||||||||||||||||||||||||||
Tree of Dependent Computations | |||||||||||||||||||||||||||||||||||||||||
| Family? (F = Feedback message, R = changed R code, M = changed R Module, P = changed Parameters, D = changed Data) | |||||||||||||||||||||||||||||||||||||||||
| - [Univariate Data Series] [Gemiddelde consum...] [2013-09-16 14:43:10] [f7b841fbfb9aee7107966c768cf3d1a3] - P [Univariate Data Series] [Gemiddelde consum...] [2013-09-16 14:58:30] [f7b841fbfb9aee7107966c768cf3d1a3] - R D [Univariate Data Series] [Gemiddelde prijs ...] [2014-01-11 15:33:10] [45baafc513cf820e9f0a314ccf5f72d1] [Current] | |||||||||||||||||||||||||||||||||||||||||
| Feedback Forum | |||||||||||||||||||||||||||||||||||||||||
Post a new message | |||||||||||||||||||||||||||||||||||||||||
Dataset | |||||||||||||||||||||||||||||||||||||||||
| Dataseries X: | |||||||||||||||||||||||||||||||||||||||||
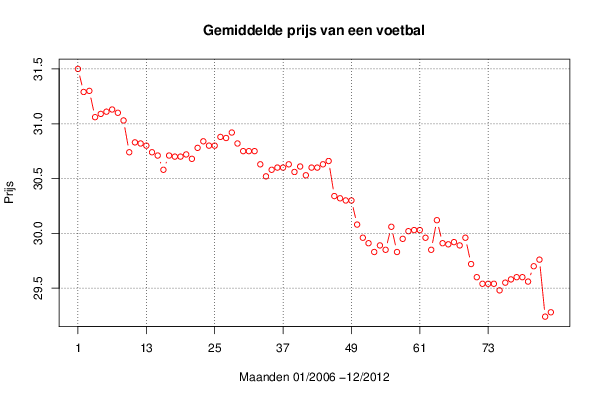
31.5 31.29 31.3 31.06 31.09 31.11 31.13 31.1 31.03 30.74 30.83 30.82 30.8 30.74 30.71 30.58 30.71 30.7 30.7 30.72 30.68 30.78 30.84 30.8 30.8 30.88 30.87 30.92 30.82 30.75 30.75 30.75 30.63 30.52 30.58 30.6 30.6 30.63 30.56 30.61 30.53 30.6 30.6 30.63 30.66 30.34 30.32 30.3 30.3 30.08 29.96 29.91 29.83 29.89 29.85 30.06 29.83 29.95 30.02 30.03 30.03 29.96 29.85 30.12 29.91 29.9 29.92 29.89 29.96 29.72 29.6 29.54 29.54 29.54 29.48 29.55 29.58 29.6 29.6 29.56 29.7 29.76 29.24 29.28 | |||||||||||||||||||||||||||||||||||||||||
Tables (Output of Computation) | |||||||||||||||||||||||||||||||||||||||||
| |||||||||||||||||||||||||||||||||||||||||
Figures (Output of Computation) | |||||||||||||||||||||||||||||||||||||||||
Input Parameters & R Code | |||||||||||||||||||||||||||||||||||||||||
| Parameters (Session): | |||||||||||||||||||||||||||||||||||||||||
| par1 = Gemiddelde consumptieprijs van een voetbal ; par2 = Belgostat ; par3 = Gemiddelde consumptieprijs van een voetbal ; par4 = 12 ; | |||||||||||||||||||||||||||||||||||||||||
| Parameters (R input): | |||||||||||||||||||||||||||||||||||||||||
| par1 = Gemiddelde consumptieprijs van een voetbal ; par2 = Belgostat ; par3 = Gemiddelde consumptieprijs van een voetbal ; par4 = 12 ; | |||||||||||||||||||||||||||||||||||||||||
| R code (references can be found in the software module): | |||||||||||||||||||||||||||||||||||||||||
if (par4 != 'No season') { | |||||||||||||||||||||||||||||||||||||||||