Free Statistics

of Irreproducible Research!

Author's title

Author*Unverified author*
R Software Modulerwasp_autocorrelation.wasp
Title produced by software(Partial) Autocorrelation Function
Date of computationSun, 12 Jan 2014 14:08:59 -0500
Cite this page as followsStatistical Computations at FreeStatistics.org, Office for Research Development and Education, URL https://freestatistics.org/blog/index.php?v=date/2014/Jan/12/t1389553754dfwaskvlsjnlzqd.htm/, Retrieved Sat, 25 May 2024 09:16:18 +0000
Statistical Computations at FreeStatistics.org, Office for Research Development and Education, URL https://freestatistics.org/blog/index.php?pk=233042, Retrieved Sat, 25 May 2024 09:16:18 +0000
QR Codes:

Original text written by user:
IsPrivate?No (this computation is public)
User-defined keywords
Estimated Impact83
Family? (F = Feedback message, R = changed R code, M = changed R Module, P = changed Parameters, D = changed Data)
-     [(Partial) Autocorrelation Function] [] [2013-11-21 18:35:05] [41b8d88384d696c671e043f0c3bb96a9]
- R PD    [(Partial) Autocorrelation Function] [] [2014-01-12 19:08:59] [ef6034d7f955a1620c5a7f0f2c706f38] [Current]
Feedback Forum

Post a new message
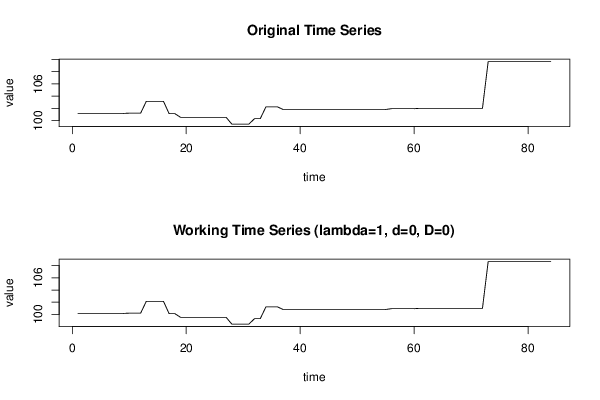
Dataseries X:
101.16
101.16
101.16
101.16
101.16
101.16
101.16
101.16
101.16
101.21
101.21
101.21
103.16
103.16
103.16
103.16
101.13
101.13
100.53
100.53
100.53
100.53
100.53
100.53
100.53
100.53
100.53
99.42
99.42
99.42
99.42
100.31
100.31
102.25
102.25
102.25
101.81
101.81
101.81
101.81
101.81
101.81
101.81
101.81
101.81
101.81
101.81
101.81
101.81
101.81
101.81
101.81
101.81
101.81
101.81
101.94
101.94
101.94
101.94
101.94
102
102
102
102
102
102
102
102
102
102
102
102
109.67
109.67
109.67
109.67
109.67
109.67
109.67
109.67
109.67
109.67
109.67
109.67


Summary of computational transaction
Raw Inputview raw input (R code)
Raw Outputview raw output of R engine
Computing time4 seconds
R Server'Gwilym Jenkins' @ jenkins.wessa.net

\begin{tabular}{lllllllll}
\hline
Summary of computational transaction \tabularnewline
Raw Input & view raw input (R code)  \tabularnewline
Raw Output & view raw output of R engine  \tabularnewline
Computing time & 4 seconds \tabularnewline
R Server & 'Gwilym Jenkins' @ jenkins.wessa.net \tabularnewline
\hline
\end{tabular}
%Source: https://freestatistics.org/blog/index.php?pk=233042&T=0

[TABLE]
[ROW][C]Summary of computational transaction[/C][/ROW]
[ROW][C]Raw Input[/C][C]view raw input (R code) [/C][/ROW]
[ROW][C]Raw Output[/C][C]view raw output of R engine [/C][/ROW]
[ROW][C]Computing time[/C][C]4 seconds[/C][/ROW]
[ROW][C]R Server[/C][C]'Gwilym Jenkins' @ jenkins.wessa.net[/C][/ROW]
[/TABLE]
Source: https://freestatistics.org/blog/index.php?pk=233042&T=0

Globally Unique Identifier (entire table): ba.freestatistics.org/blog/index.php?pk=233042&T=0

As an alternative you can also use a QR Code:  

The GUIDs for individual cells are displayed in the table below:

Summary of computational transaction
Raw Inputview raw input (R code)
Raw Outputview raw output of R engine
Computing time4 seconds
R Server'Gwilym Jenkins' @ jenkins.wessa.net


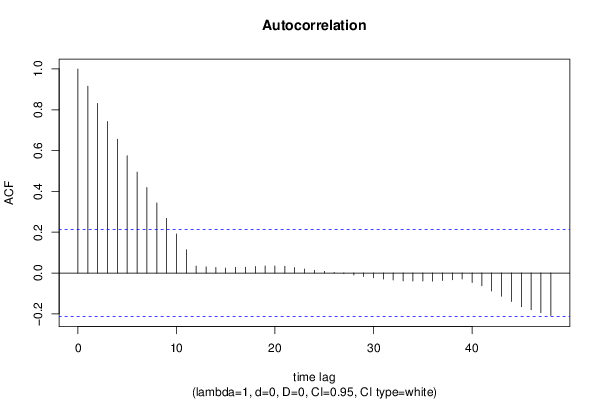
Autocorrelation Function
Time lag kACF(k)T-STATP-value
10.9155818.39140
20.8311617.61770
30.7427516.80740
40.6553666.00650
50.5746855.26711e-06
60.4945234.53241e-05
70.4188663.8390.000119
80.3433473.14680.001142
90.2678272.45470.008083
100.1908851.74950.041929
110.1139431.04430.14967
120.0339470.31110.378236
130.030210.27690.391275
140.0271970.24930.401881
150.0241850.22170.41256
160.0281310.25780.398585
170.0279680.25630.39916
180.0317920.29140.385742
190.0341170.31270.377646
200.0341680.31320.377468
210.0330090.30250.381497
220.0267220.24490.40356
230.0200340.18360.42738
240.0133450.12230.451473
250.0081370.07460.470364
260.0029290.02680.489322
27-0.002278-0.02090.491695
28-0.009861-0.09040.4641
29-0.017249-0.15810.437383
30-0.023472-0.21510.415094
31-0.029696-0.27220.39308
32-0.034118-0.31270.377644
33-0.03854-0.35320.362404
34-0.038943-0.35690.361023
35-0.039347-0.36060.359643
36-0.039751-0.36430.358266
37-0.036472-0.33430.369505
38-0.033087-0.30320.381227
39-0.029702-0.27220.39306
40-0.046126-0.42280.336779
41-0.06255-0.57330.283993
42-0.088226-0.80860.210514
43-0.113853-1.04350.14986
44-0.139824-1.28150.101771
45-0.165629-1.5180.066382
46-0.179896-1.64880.051464
47-0.194172-1.77960.039378
48-0.208448-1.91050.029743

\begin{tabular}{lllllllll}
\hline
Autocorrelation Function \tabularnewline
Time lag k & ACF(k) & T-STAT & P-value \tabularnewline
1 & 0.915581 & 8.3914 & 0 \tabularnewline
2 & 0.831161 & 7.6177 & 0 \tabularnewline
3 & 0.742751 & 6.8074 & 0 \tabularnewline
4 & 0.655366 & 6.0065 & 0 \tabularnewline
5 & 0.574685 & 5.2671 & 1e-06 \tabularnewline
6 & 0.494523 & 4.5324 & 1e-05 \tabularnewline
7 & 0.418866 & 3.839 & 0.000119 \tabularnewline
8 & 0.343347 & 3.1468 & 0.001142 \tabularnewline
9 & 0.267827 & 2.4547 & 0.008083 \tabularnewline
10 & 0.190885 & 1.7495 & 0.041929 \tabularnewline
11 & 0.113943 & 1.0443 & 0.14967 \tabularnewline
12 & 0.033947 & 0.3111 & 0.378236 \tabularnewline
13 & 0.03021 & 0.2769 & 0.391275 \tabularnewline
14 & 0.027197 & 0.2493 & 0.401881 \tabularnewline
15 & 0.024185 & 0.2217 & 0.41256 \tabularnewline
16 & 0.028131 & 0.2578 & 0.398585 \tabularnewline
17 & 0.027968 & 0.2563 & 0.39916 \tabularnewline
18 & 0.031792 & 0.2914 & 0.385742 \tabularnewline
19 & 0.034117 & 0.3127 & 0.377646 \tabularnewline
20 & 0.034168 & 0.3132 & 0.377468 \tabularnewline
21 & 0.033009 & 0.3025 & 0.381497 \tabularnewline
22 & 0.026722 & 0.2449 & 0.40356 \tabularnewline
23 & 0.020034 & 0.1836 & 0.42738 \tabularnewline
24 & 0.013345 & 0.1223 & 0.451473 \tabularnewline
25 & 0.008137 & 0.0746 & 0.470364 \tabularnewline
26 & 0.002929 & 0.0268 & 0.489322 \tabularnewline
27 & -0.002278 & -0.0209 & 0.491695 \tabularnewline
28 & -0.009861 & -0.0904 & 0.4641 \tabularnewline
29 & -0.017249 & -0.1581 & 0.437383 \tabularnewline
30 & -0.023472 & -0.2151 & 0.415094 \tabularnewline
31 & -0.029696 & -0.2722 & 0.39308 \tabularnewline
32 & -0.034118 & -0.3127 & 0.377644 \tabularnewline
33 & -0.03854 & -0.3532 & 0.362404 \tabularnewline
34 & -0.038943 & -0.3569 & 0.361023 \tabularnewline
35 & -0.039347 & -0.3606 & 0.359643 \tabularnewline
36 & -0.039751 & -0.3643 & 0.358266 \tabularnewline
37 & -0.036472 & -0.3343 & 0.369505 \tabularnewline
38 & -0.033087 & -0.3032 & 0.381227 \tabularnewline
39 & -0.029702 & -0.2722 & 0.39306 \tabularnewline
40 & -0.046126 & -0.4228 & 0.336779 \tabularnewline
41 & -0.06255 & -0.5733 & 0.283993 \tabularnewline
42 & -0.088226 & -0.8086 & 0.210514 \tabularnewline
43 & -0.113853 & -1.0435 & 0.14986 \tabularnewline
44 & -0.139824 & -1.2815 & 0.101771 \tabularnewline
45 & -0.165629 & -1.518 & 0.066382 \tabularnewline
46 & -0.179896 & -1.6488 & 0.051464 \tabularnewline
47 & -0.194172 & -1.7796 & 0.039378 \tabularnewline
48 & -0.208448 & -1.9105 & 0.029743 \tabularnewline
\hline
\end{tabular}
%Source: https://freestatistics.org/blog/index.php?pk=233042&T=1

[TABLE]
[ROW][C]Autocorrelation Function[/C][/ROW]
[ROW][C]Time lag k[/C][C]ACF(k)[/C][C]T-STAT[/C][C]P-value[/C][/ROW]
[ROW][C]1[/C][C]0.915581[/C][C]8.3914[/C][C]0[/C][/ROW]
[ROW][C]2[/C][C]0.831161[/C][C]7.6177[/C][C]0[/C][/ROW]
[ROW][C]3[/C][C]0.742751[/C][C]6.8074[/C][C]0[/C][/ROW]
[ROW][C]4[/C][C]0.655366[/C][C]6.0065[/C][C]0[/C][/ROW]
[ROW][C]5[/C][C]0.574685[/C][C]5.2671[/C][C]1e-06[/C][/ROW]
[ROW][C]6[/C][C]0.494523[/C][C]4.5324[/C][C]1e-05[/C][/ROW]
[ROW][C]7[/C][C]0.418866[/C][C]3.839[/C][C]0.000119[/C][/ROW]
[ROW][C]8[/C][C]0.343347[/C][C]3.1468[/C][C]0.001142[/C][/ROW]
[ROW][C]9[/C][C]0.267827[/C][C]2.4547[/C][C]0.008083[/C][/ROW]
[ROW][C]10[/C][C]0.190885[/C][C]1.7495[/C][C]0.041929[/C][/ROW]
[ROW][C]11[/C][C]0.113943[/C][C]1.0443[/C][C]0.14967[/C][/ROW]
[ROW][C]12[/C][C]0.033947[/C][C]0.3111[/C][C]0.378236[/C][/ROW]
[ROW][C]13[/C][C]0.03021[/C][C]0.2769[/C][C]0.391275[/C][/ROW]
[ROW][C]14[/C][C]0.027197[/C][C]0.2493[/C][C]0.401881[/C][/ROW]
[ROW][C]15[/C][C]0.024185[/C][C]0.2217[/C][C]0.41256[/C][/ROW]
[ROW][C]16[/C][C]0.028131[/C][C]0.2578[/C][C]0.398585[/C][/ROW]
[ROW][C]17[/C][C]0.027968[/C][C]0.2563[/C][C]0.39916[/C][/ROW]
[ROW][C]18[/C][C]0.031792[/C][C]0.2914[/C][C]0.385742[/C][/ROW]
[ROW][C]19[/C][C]0.034117[/C][C]0.3127[/C][C]0.377646[/C][/ROW]
[ROW][C]20[/C][C]0.034168[/C][C]0.3132[/C][C]0.377468[/C][/ROW]
[ROW][C]21[/C][C]0.033009[/C][C]0.3025[/C][C]0.381497[/C][/ROW]
[ROW][C]22[/C][C]0.026722[/C][C]0.2449[/C][C]0.40356[/C][/ROW]
[ROW][C]23[/C][C]0.020034[/C][C]0.1836[/C][C]0.42738[/C][/ROW]
[ROW][C]24[/C][C]0.013345[/C][C]0.1223[/C][C]0.451473[/C][/ROW]
[ROW][C]25[/C][C]0.008137[/C][C]0.0746[/C][C]0.470364[/C][/ROW]
[ROW][C]26[/C][C]0.002929[/C][C]0.0268[/C][C]0.489322[/C][/ROW]
[ROW][C]27[/C][C]-0.002278[/C][C]-0.0209[/C][C]0.491695[/C][/ROW]
[ROW][C]28[/C][C]-0.009861[/C][C]-0.0904[/C][C]0.4641[/C][/ROW]
[ROW][C]29[/C][C]-0.017249[/C][C]-0.1581[/C][C]0.437383[/C][/ROW]
[ROW][C]30[/C][C]-0.023472[/C][C]-0.2151[/C][C]0.415094[/C][/ROW]
[ROW][C]31[/C][C]-0.029696[/C][C]-0.2722[/C][C]0.39308[/C][/ROW]
[ROW][C]32[/C][C]-0.034118[/C][C]-0.3127[/C][C]0.377644[/C][/ROW]
[ROW][C]33[/C][C]-0.03854[/C][C]-0.3532[/C][C]0.362404[/C][/ROW]
[ROW][C]34[/C][C]-0.038943[/C][C]-0.3569[/C][C]0.361023[/C][/ROW]
[ROW][C]35[/C][C]-0.039347[/C][C]-0.3606[/C][C]0.359643[/C][/ROW]
[ROW][C]36[/C][C]-0.039751[/C][C]-0.3643[/C][C]0.358266[/C][/ROW]
[ROW][C]37[/C][C]-0.036472[/C][C]-0.3343[/C][C]0.369505[/C][/ROW]
[ROW][C]38[/C][C]-0.033087[/C][C]-0.3032[/C][C]0.381227[/C][/ROW]
[ROW][C]39[/C][C]-0.029702[/C][C]-0.2722[/C][C]0.39306[/C][/ROW]
[ROW][C]40[/C][C]-0.046126[/C][C]-0.4228[/C][C]0.336779[/C][/ROW]
[ROW][C]41[/C][C]-0.06255[/C][C]-0.5733[/C][C]0.283993[/C][/ROW]
[ROW][C]42[/C][C]-0.088226[/C][C]-0.8086[/C][C]0.210514[/C][/ROW]
[ROW][C]43[/C][C]-0.113853[/C][C]-1.0435[/C][C]0.14986[/C][/ROW]
[ROW][C]44[/C][C]-0.139824[/C][C]-1.2815[/C][C]0.101771[/C][/ROW]
[ROW][C]45[/C][C]-0.165629[/C][C]-1.518[/C][C]0.066382[/C][/ROW]
[ROW][C]46[/C][C]-0.179896[/C][C]-1.6488[/C][C]0.051464[/C][/ROW]
[ROW][C]47[/C][C]-0.194172[/C][C]-1.7796[/C][C]0.039378[/C][/ROW]
[ROW][C]48[/C][C]-0.208448[/C][C]-1.9105[/C][C]0.029743[/C][/ROW]
[/TABLE]
Source: https://freestatistics.org/blog/index.php?pk=233042&T=1

Globally Unique Identifier (entire table): ba.freestatistics.org/blog/index.php?pk=233042&T=1

As an alternative you can also use a QR Code:  

The GUIDs for individual cells are displayed in the table below:

Autocorrelation Function
Time lag kACF(k)T-STATP-value
10.9155818.39140
20.8311617.61770
30.7427516.80740
40.6553666.00650
50.5746855.26711e-06
60.4945234.53241e-05
70.4188663.8390.000119
80.3433473.14680.001142
90.2678272.45470.008083
100.1908851.74950.041929
110.1139431.04430.14967
120.0339470.31110.378236
130.030210.27690.391275
140.0271970.24930.401881
150.0241850.22170.41256
160.0281310.25780.398585
170.0279680.25630.39916
180.0317920.29140.385742
190.0341170.31270.377646
200.0341680.31320.377468
210.0330090.30250.381497
220.0267220.24490.40356
230.0200340.18360.42738
240.0133450.12230.451473
250.0081370.07460.470364
260.0029290.02680.489322
27-0.002278-0.02090.491695
28-0.009861-0.09040.4641
29-0.017249-0.15810.437383
30-0.023472-0.21510.415094
31-0.029696-0.27220.39308
32-0.034118-0.31270.377644
33-0.03854-0.35320.362404
34-0.038943-0.35690.361023
35-0.039347-0.36060.359643
36-0.039751-0.36430.358266
37-0.036472-0.33430.369505
38-0.033087-0.30320.381227
39-0.029702-0.27220.39306
40-0.046126-0.42280.336779
41-0.06255-0.57330.283993
42-0.088226-0.80860.210514
43-0.113853-1.04350.14986
44-0.139824-1.28150.101771
45-0.165629-1.5180.066382
46-0.179896-1.64880.051464
47-0.194172-1.77960.039378
48-0.208448-1.91050.029743


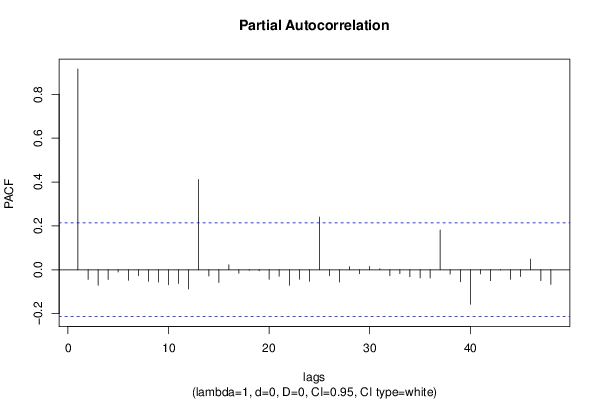
Partial Autocorrelation Function
Time lag kPACF(k)T-STATP-value
10.9155818.39140
2-0.04407-0.40390.343654
3-0.070828-0.64920.259005
4-0.044407-0.4070.342522
5-0.01041-0.09540.46211
6-0.048289-0.44260.329605
7-0.027504-0.25210.400798
8-0.052592-0.4820.315525
9-0.056328-0.51630.303515
10-0.068536-0.62810.265806
11-0.062856-0.57610.283049
12-0.088002-0.80660.211101
130.4114333.77080.000151
14-0.028379-0.26010.397713
15-0.058039-0.53190.298087
160.023060.21130.416563
17-0.016061-0.14720.441663
18-0.002115-0.01940.492292
19-0.004443-0.04070.483808
20-0.043034-0.39440.347138
21-0.02992-0.27420.392294
22-0.070453-0.64570.260112
23-0.043404-0.39780.345891
24-0.052708-0.48310.315148
250.2400792.20040.015263
26-0.027641-0.25330.400315
27-0.056273-0.51570.303693
280.0142040.13020.448365
29-0.018426-0.16890.433151
300.0148810.13640.445919
310.0048570.04450.482299
32-0.027493-0.2520.400836
33-0.017617-0.16150.43606
34-0.031332-0.28720.387346
35-0.037237-0.34130.366872
36-0.037586-0.34450.365671
370.1810391.65930.050397
38-0.019842-0.18190.428067
39-0.054812-0.50240.308365
40-0.157471-1.44320.076335
41-0.018758-0.17190.431957
42-0.049606-0.45460.325267
43-0.001331-0.01220.49515
44-0.04338-0.39760.345973
45-0.030952-0.28370.388676
460.0486390.44580.328451
47-0.049479-0.45350.325686
48-0.066818-0.61240.270964

\begin{tabular}{lllllllll}
\hline
Partial Autocorrelation Function \tabularnewline
Time lag k & PACF(k) & T-STAT & P-value \tabularnewline
1 & 0.915581 & 8.3914 & 0 \tabularnewline
2 & -0.04407 & -0.4039 & 0.343654 \tabularnewline
3 & -0.070828 & -0.6492 & 0.259005 \tabularnewline
4 & -0.044407 & -0.407 & 0.342522 \tabularnewline
5 & -0.01041 & -0.0954 & 0.46211 \tabularnewline
6 & -0.048289 & -0.4426 & 0.329605 \tabularnewline
7 & -0.027504 & -0.2521 & 0.400798 \tabularnewline
8 & -0.052592 & -0.482 & 0.315525 \tabularnewline
9 & -0.056328 & -0.5163 & 0.303515 \tabularnewline
10 & -0.068536 & -0.6281 & 0.265806 \tabularnewline
11 & -0.062856 & -0.5761 & 0.283049 \tabularnewline
12 & -0.088002 & -0.8066 & 0.211101 \tabularnewline
13 & 0.411433 & 3.7708 & 0.000151 \tabularnewline
14 & -0.028379 & -0.2601 & 0.397713 \tabularnewline
15 & -0.058039 & -0.5319 & 0.298087 \tabularnewline
16 & 0.02306 & 0.2113 & 0.416563 \tabularnewline
17 & -0.016061 & -0.1472 & 0.441663 \tabularnewline
18 & -0.002115 & -0.0194 & 0.492292 \tabularnewline
19 & -0.004443 & -0.0407 & 0.483808 \tabularnewline
20 & -0.043034 & -0.3944 & 0.347138 \tabularnewline
21 & -0.02992 & -0.2742 & 0.392294 \tabularnewline
22 & -0.070453 & -0.6457 & 0.260112 \tabularnewline
23 & -0.043404 & -0.3978 & 0.345891 \tabularnewline
24 & -0.052708 & -0.4831 & 0.315148 \tabularnewline
25 & 0.240079 & 2.2004 & 0.015263 \tabularnewline
26 & -0.027641 & -0.2533 & 0.400315 \tabularnewline
27 & -0.056273 & -0.5157 & 0.303693 \tabularnewline
28 & 0.014204 & 0.1302 & 0.448365 \tabularnewline
29 & -0.018426 & -0.1689 & 0.433151 \tabularnewline
30 & 0.014881 & 0.1364 & 0.445919 \tabularnewline
31 & 0.004857 & 0.0445 & 0.482299 \tabularnewline
32 & -0.027493 & -0.252 & 0.400836 \tabularnewline
33 & -0.017617 & -0.1615 & 0.43606 \tabularnewline
34 & -0.031332 & -0.2872 & 0.387346 \tabularnewline
35 & -0.037237 & -0.3413 & 0.366872 \tabularnewline
36 & -0.037586 & -0.3445 & 0.365671 \tabularnewline
37 & 0.181039 & 1.6593 & 0.050397 \tabularnewline
38 & -0.019842 & -0.1819 & 0.428067 \tabularnewline
39 & -0.054812 & -0.5024 & 0.308365 \tabularnewline
40 & -0.157471 & -1.4432 & 0.076335 \tabularnewline
41 & -0.018758 & -0.1719 & 0.431957 \tabularnewline
42 & -0.049606 & -0.4546 & 0.325267 \tabularnewline
43 & -0.001331 & -0.0122 & 0.49515 \tabularnewline
44 & -0.04338 & -0.3976 & 0.345973 \tabularnewline
45 & -0.030952 & -0.2837 & 0.388676 \tabularnewline
46 & 0.048639 & 0.4458 & 0.328451 \tabularnewline
47 & -0.049479 & -0.4535 & 0.325686 \tabularnewline
48 & -0.066818 & -0.6124 & 0.270964 \tabularnewline
\hline
\end{tabular}
%Source: https://freestatistics.org/blog/index.php?pk=233042&T=2

[TABLE]
[ROW][C]Partial Autocorrelation Function[/C][/ROW]
[ROW][C]Time lag k[/C][C]PACF(k)[/C][C]T-STAT[/C][C]P-value[/C][/ROW]
[ROW][C]1[/C][C]0.915581[/C][C]8.3914[/C][C]0[/C][/ROW]
[ROW][C]2[/C][C]-0.04407[/C][C]-0.4039[/C][C]0.343654[/C][/ROW]
[ROW][C]3[/C][C]-0.070828[/C][C]-0.6492[/C][C]0.259005[/C][/ROW]
[ROW][C]4[/C][C]-0.044407[/C][C]-0.407[/C][C]0.342522[/C][/ROW]
[ROW][C]5[/C][C]-0.01041[/C][C]-0.0954[/C][C]0.46211[/C][/ROW]
[ROW][C]6[/C][C]-0.048289[/C][C]-0.4426[/C][C]0.329605[/C][/ROW]
[ROW][C]7[/C][C]-0.027504[/C][C]-0.2521[/C][C]0.400798[/C][/ROW]
[ROW][C]8[/C][C]-0.052592[/C][C]-0.482[/C][C]0.315525[/C][/ROW]
[ROW][C]9[/C][C]-0.056328[/C][C]-0.5163[/C][C]0.303515[/C][/ROW]
[ROW][C]10[/C][C]-0.068536[/C][C]-0.6281[/C][C]0.265806[/C][/ROW]
[ROW][C]11[/C][C]-0.062856[/C][C]-0.5761[/C][C]0.283049[/C][/ROW]
[ROW][C]12[/C][C]-0.088002[/C][C]-0.8066[/C][C]0.211101[/C][/ROW]
[ROW][C]13[/C][C]0.411433[/C][C]3.7708[/C][C]0.000151[/C][/ROW]
[ROW][C]14[/C][C]-0.028379[/C][C]-0.2601[/C][C]0.397713[/C][/ROW]
[ROW][C]15[/C][C]-0.058039[/C][C]-0.5319[/C][C]0.298087[/C][/ROW]
[ROW][C]16[/C][C]0.02306[/C][C]0.2113[/C][C]0.416563[/C][/ROW]
[ROW][C]17[/C][C]-0.016061[/C][C]-0.1472[/C][C]0.441663[/C][/ROW]
[ROW][C]18[/C][C]-0.002115[/C][C]-0.0194[/C][C]0.492292[/C][/ROW]
[ROW][C]19[/C][C]-0.004443[/C][C]-0.0407[/C][C]0.483808[/C][/ROW]
[ROW][C]20[/C][C]-0.043034[/C][C]-0.3944[/C][C]0.347138[/C][/ROW]
[ROW][C]21[/C][C]-0.02992[/C][C]-0.2742[/C][C]0.392294[/C][/ROW]
[ROW][C]22[/C][C]-0.070453[/C][C]-0.6457[/C][C]0.260112[/C][/ROW]
[ROW][C]23[/C][C]-0.043404[/C][C]-0.3978[/C][C]0.345891[/C][/ROW]
[ROW][C]24[/C][C]-0.052708[/C][C]-0.4831[/C][C]0.315148[/C][/ROW]
[ROW][C]25[/C][C]0.240079[/C][C]2.2004[/C][C]0.015263[/C][/ROW]
[ROW][C]26[/C][C]-0.027641[/C][C]-0.2533[/C][C]0.400315[/C][/ROW]
[ROW][C]27[/C][C]-0.056273[/C][C]-0.5157[/C][C]0.303693[/C][/ROW]
[ROW][C]28[/C][C]0.014204[/C][C]0.1302[/C][C]0.448365[/C][/ROW]
[ROW][C]29[/C][C]-0.018426[/C][C]-0.1689[/C][C]0.433151[/C][/ROW]
[ROW][C]30[/C][C]0.014881[/C][C]0.1364[/C][C]0.445919[/C][/ROW]
[ROW][C]31[/C][C]0.004857[/C][C]0.0445[/C][C]0.482299[/C][/ROW]
[ROW][C]32[/C][C]-0.027493[/C][C]-0.252[/C][C]0.400836[/C][/ROW]
[ROW][C]33[/C][C]-0.017617[/C][C]-0.1615[/C][C]0.43606[/C][/ROW]
[ROW][C]34[/C][C]-0.031332[/C][C]-0.2872[/C][C]0.387346[/C][/ROW]
[ROW][C]35[/C][C]-0.037237[/C][C]-0.3413[/C][C]0.366872[/C][/ROW]
[ROW][C]36[/C][C]-0.037586[/C][C]-0.3445[/C][C]0.365671[/C][/ROW]
[ROW][C]37[/C][C]0.181039[/C][C]1.6593[/C][C]0.050397[/C][/ROW]
[ROW][C]38[/C][C]-0.019842[/C][C]-0.1819[/C][C]0.428067[/C][/ROW]
[ROW][C]39[/C][C]-0.054812[/C][C]-0.5024[/C][C]0.308365[/C][/ROW]
[ROW][C]40[/C][C]-0.157471[/C][C]-1.4432[/C][C]0.076335[/C][/ROW]
[ROW][C]41[/C][C]-0.018758[/C][C]-0.1719[/C][C]0.431957[/C][/ROW]
[ROW][C]42[/C][C]-0.049606[/C][C]-0.4546[/C][C]0.325267[/C][/ROW]
[ROW][C]43[/C][C]-0.001331[/C][C]-0.0122[/C][C]0.49515[/C][/ROW]
[ROW][C]44[/C][C]-0.04338[/C][C]-0.3976[/C][C]0.345973[/C][/ROW]
[ROW][C]45[/C][C]-0.030952[/C][C]-0.2837[/C][C]0.388676[/C][/ROW]
[ROW][C]46[/C][C]0.048639[/C][C]0.4458[/C][C]0.328451[/C][/ROW]
[ROW][C]47[/C][C]-0.049479[/C][C]-0.4535[/C][C]0.325686[/C][/ROW]
[ROW][C]48[/C][C]-0.066818[/C][C]-0.6124[/C][C]0.270964[/C][/ROW]
[/TABLE]
Source: https://freestatistics.org/blog/index.php?pk=233042&T=2

Globally Unique Identifier (entire table): ba.freestatistics.org/blog/index.php?pk=233042&T=2

As an alternative you can also use a QR Code:  

The GUIDs for individual cells are displayed in the table below:

Partial Autocorrelation Function
Time lag kPACF(k)T-STATP-value
10.9155818.39140
2-0.04407-0.40390.343654
3-0.070828-0.64920.259005
4-0.044407-0.4070.342522
5-0.01041-0.09540.46211
6-0.048289-0.44260.329605
7-0.027504-0.25210.400798
8-0.052592-0.4820.315525
9-0.056328-0.51630.303515
10-0.068536-0.62810.265806
11-0.062856-0.57610.283049
12-0.088002-0.80660.211101
130.4114333.77080.000151
14-0.028379-0.26010.397713
15-0.058039-0.53190.298087
160.023060.21130.416563
17-0.016061-0.14720.441663
18-0.002115-0.01940.492292
19-0.004443-0.04070.483808
20-0.043034-0.39440.347138
21-0.02992-0.27420.392294
22-0.070453-0.64570.260112
23-0.043404-0.39780.345891
24-0.052708-0.48310.315148
250.2400792.20040.015263
26-0.027641-0.25330.400315
27-0.056273-0.51570.303693
280.0142040.13020.448365
29-0.018426-0.16890.433151
300.0148810.13640.445919
310.0048570.04450.482299
32-0.027493-0.2520.400836
33-0.017617-0.16150.43606
34-0.031332-0.28720.387346
35-0.037237-0.34130.366872
36-0.037586-0.34450.365671
370.1810391.65930.050397
38-0.019842-0.18190.428067
39-0.054812-0.50240.308365
40-0.157471-1.44320.076335
41-0.018758-0.17190.431957
42-0.049606-0.45460.325267
43-0.001331-0.01220.49515
44-0.04338-0.39760.345973
45-0.030952-0.28370.388676
460.0486390.44580.328451
47-0.049479-0.45350.325686
48-0.066818-0.61240.270964


Parameters (Session):
par1 = 48 ; par2 = 1 ; par3 = 0 ; par4 = 0 ; par5 = 12 ; par6 = White Noise ; par7 = 0.95 ;
Parameters (R input):
par1 = 48 ; par2 = 1 ; par3 = 0 ; par4 = 0 ; par5 = 12 ; par6 = White Noise ; par7 = 0.95 ; par8 = ;
R code (references can be found in the software module):
if (par1 == 'Default') {
par1 = 10*log10(length(x))
} else {
par1 <- as.numeric(par1)
}
par2 <- as.numeric(par2)
par3 <- as.numeric(par3)
par4 <- as.numeric(par4)
par5 <- as.numeric(par5)
if (par6 == 'White Noise') par6 <- 'white' else par6 <- 'ma'
par7 <- as.numeric(par7)
if (par8 != '') par8 <- as.numeric(par8)
ox <- x
if (par8 == '') {
if (par2 == 0) {
x <- log(x)
} else {
x <- (x ^ par2 - 1) / par2
}
} else {
x <- log(x,base=par8)
}
if (par3 > 0) x <- diff(x,lag=1,difference=par3)
if (par4 > 0) x <- diff(x,lag=par5,difference=par4)
bitmap(file='picts.png')
op <- par(mfrow=c(2,1))
plot(ox,type='l',main='Original Time Series',xlab='time',ylab='value')
if (par8=='') {
mytitle <- paste('Working Time Series (lambda=',par2,', d=',par3,', D=',par4,')',sep='')
mysub <- paste('(lambda=',par2,', d=',par3,', D=',par4,', CI=', par7, ', CI type=',par6,')',sep='')
} else {
mytitle <- paste('Working Time Series (base=',par8,', d=',par3,', D=',par4,')',sep='')
mysub <- paste('(base=',par8,', d=',par3,', D=',par4,', CI=', par7, ', CI type=',par6,')',sep='')
}
plot(x,type='l', main=mytitle,xlab='time',ylab='value')
par(op)
dev.off()
bitmap(file='pic1.png')
racf <- acf(x, par1, main='Autocorrelation', xlab='time lag', ylab='ACF', ci.type=par6, ci=par7, sub=mysub)
dev.off()
bitmap(file='pic2.png')
rpacf <- pacf(x,par1,main='Partial Autocorrelation',xlab='lags',ylab='PACF',sub=mysub)
dev.off()
(myacf <- c(racf$acf))
(mypacf <- c(rpacf$acf))
lengthx <- length(x)
sqrtn <- sqrt(lengthx)
load(file='createtable')
a<-table.start()
a<-table.row.start(a)
a<-table.element(a,'Autocorrelation Function',4,TRUE)
a<-table.row.end(a)
a<-table.row.start(a)
a<-table.element(a,'Time lag k',header=TRUE)
a<-table.element(a,hyperlink('basics.htm','ACF(k)','click here for more information about the Autocorrelation Function'),header=TRUE)
a<-table.element(a,'T-STAT',header=TRUE)
a<-table.element(a,'P-value',header=TRUE)
a<-table.row.end(a)
for (i in 2:(par1+1)) {
a<-table.row.start(a)
a<-table.element(a,i-1,header=TRUE)
a<-table.element(a,round(myacf[i],6))
mytstat <- myacf[i]*sqrtn
a<-table.element(a,round(mytstat,4))
a<-table.element(a,round(1-pt(abs(mytstat),lengthx),6))
a<-table.row.end(a)
}
a<-table.end(a)
table.save(a,file='mytable.tab')
a<-table.start()
a<-table.row.start(a)
a<-table.element(a,'Partial Autocorrelation Function',4,TRUE)
a<-table.row.end(a)
a<-table.row.start(a)
a<-table.element(a,'Time lag k',header=TRUE)
a<-table.element(a,hyperlink('basics.htm','PACF(k)','click here for more information about the Partial Autocorrelation Function'),header=TRUE)
a<-table.element(a,'T-STAT',header=TRUE)
a<-table.element(a,'P-value',header=TRUE)
a<-table.row.end(a)
for (i in 1:par1) {
a<-table.row.start(a)
a<-table.element(a,i,header=TRUE)
a<-table.element(a,round(mypacf[i],6))
mytstat <- mypacf[i]*sqrtn
a<-table.element(a,round(mytstat,4))
a<-table.element(a,round(1-pt(abs(mytstat),lengthx),6))
a<-table.row.end(a)
}
a<-table.end(a)
table.save(a,file='mytable1.tab')