Free Statistics
of Irreproducible Research!
Description of Statistical Computation | ||||||||||||||||||||||||||||||
|---|---|---|---|---|---|---|---|---|---|---|---|---|---|---|---|---|---|---|---|---|---|---|---|---|---|---|---|---|---|---|
| Author's title | ||||||||||||||||||||||||||||||
| Author | *The author of this computation has been verified* | |||||||||||||||||||||||||||||
| R Software Module | rwasp_Distributional Plots.wasp | |||||||||||||||||||||||||||||
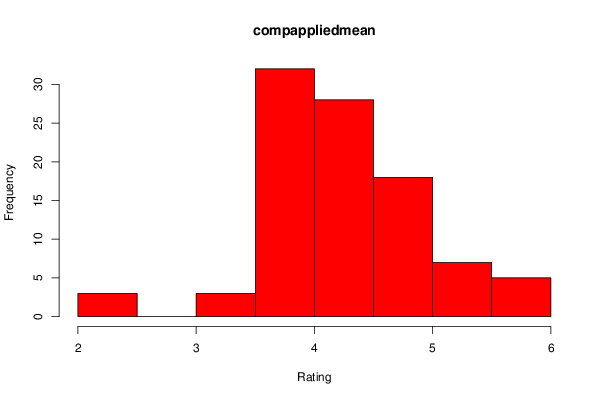
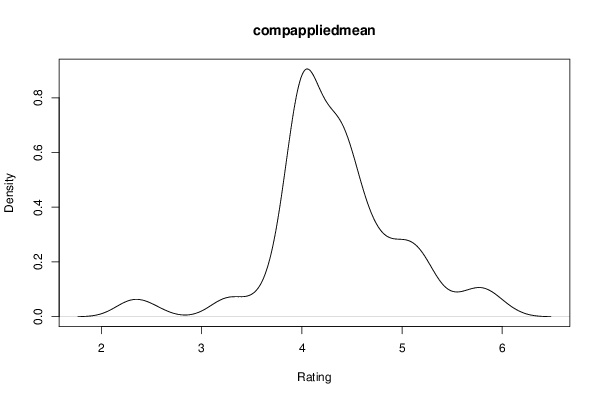
| Title produced by software | Histogram, QQplot and Density | |||||||||||||||||||||||||||||
| Date of computation | Thu, 27 Nov 2014 11:57:17 +0000 | |||||||||||||||||||||||||||||
| Cite this page as follows | Statistical Computations at FreeStatistics.org, Office for Research Development and Education, URL https://freestatistics.org/blog/index.php?v=date/2014/Nov/27/t1417089450mhq56wcvlbbkebk.htm/, Retrieved Mon, 10 Jun 2024 11:07:41 +0000 | |||||||||||||||||||||||||||||
| Statistical Computations at FreeStatistics.org, Office for Research Development and Education, URL https://freestatistics.org/blog/index.php?pk=259807, Retrieved Mon, 10 Jun 2024 11:07:41 +0000 | ||||||||||||||||||||||||||||||
| QR Codes: | ||||||||||||||||||||||||||||||
|
| ||||||||||||||||||||||||||||||
| Original text written by user: | ||||||||||||||||||||||||||||||
| IsPrivate? | No (this computation is public) | |||||||||||||||||||||||||||||
| User-defined keywords | ||||||||||||||||||||||||||||||
| Estimated Impact | 74 | |||||||||||||||||||||||||||||
Tree of Dependent Computations | ||||||||||||||||||||||||||||||
| Family? (F = Feedback message, R = changed R code, M = changed R Module, P = changed Parameters, D = changed Data) | ||||||||||||||||||||||||||||||
| - [Histogram, QQplot and Density] [] [2014-10-11 09:05:01] [32b17a345b130fdf5cc88718ed94a974] - R D [Histogram, QQplot and Density] [compmemomean] [2014-11-27 11:52:35] [e273bcf7b3dec37eefee009dbdabc093] - D [Histogram, QQplot and Density] [compattenmean] [2014-11-27 11:55:32] [e273bcf7b3dec37eefee009dbdabc093] - D [Histogram, QQplot and Density] [compappliedmean] [2014-11-27 11:57:17] [6e0899e1e75808c0c236bc4ec9bab18e] [Current] - D [Histogram, QQplot and Density] [Specmemmean] [2014-11-27 11:59:15] [e273bcf7b3dec37eefee009dbdabc093] - D [Histogram, QQplot and Density] [specattenmean] [2014-11-27 12:00:53] [e273bcf7b3dec37eefee009dbdabc093] - D [Histogram, QQplot and Density] [specappliedmean] [2014-11-27 12:02:12] [e273bcf7b3dec37eefee009dbdabc093] | ||||||||||||||||||||||||||||||
| Feedback Forum | ||||||||||||||||||||||||||||||
Post a new message | ||||||||||||||||||||||||||||||
Dataset | ||||||||||||||||||||||||||||||
| Dataseries X: | ||||||||||||||||||||||||||||||
4.4 4.2 5.2 5.2 4.4 5.5 4 4 4 3.8 4 5.25 3.6 4.4 4 4.4 4.333333333 4.6 4 4.4 5 5.2 5.2 4.6 4.6 2.333333333 4 3.8 4 4.6 4.75 4.4 4 4 5.2 3.8 2.5 3.2 4.2 4 3.25 4.2 4.75 4.4 4 4.2 4 4.2 4.4 4 4.6 4.4 4 4.8 2.25 4.8 3.75 5.6 4.2 4.2 5 5.8 5 4 4.4 4.4 4.4 4.4 5.8 6 4 4 5 4 4.2 4.4 4 4 4 4.2 4.6 4.4 4.4 4 5 4.2 5 4 4.8 4 4.6 4 4.4 4 3.4 5.8 | ||||||||||||||||||||||||||||||
Tables (Output of Computation) | ||||||||||||||||||||||||||||||
| ||||||||||||||||||||||||||||||
Figures (Output of Computation) | ||||||||||||||||||||||||||||||
Input Parameters & R Code | ||||||||||||||||||||||||||||||
| Parameters (Session): | ||||||||||||||||||||||||||||||
| par1 = 10 ; | ||||||||||||||||||||||||||||||
| Parameters (R input): | ||||||||||||||||||||||||||||||
| par1 = 10 ; | ||||||||||||||||||||||||||||||
| R code (references can be found in the software module): | ||||||||||||||||||||||||||||||
x <- x[!is.na(x)] | ||||||||||||||||||||||||||||||