Free Statistics
of Irreproducible Research!
Description of Statistical Computation | |||||||||||||||||||||
|---|---|---|---|---|---|---|---|---|---|---|---|---|---|---|---|---|---|---|---|---|---|
| Author's title | |||||||||||||||||||||
| Author | *The author of this computation has been verified* | ||||||||||||||||||||
| R Software Module | rwasp_skewness_kurtosis_plot.wasp | ||||||||||||||||||||
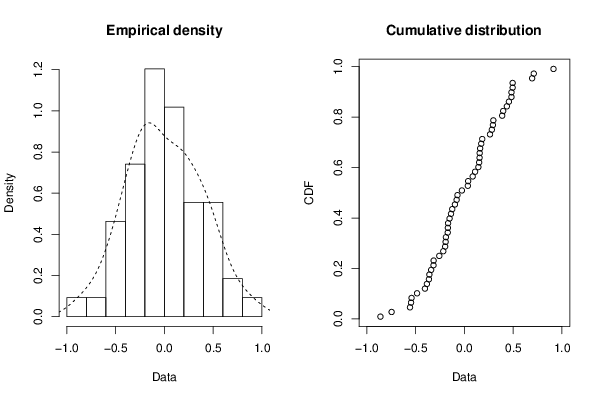
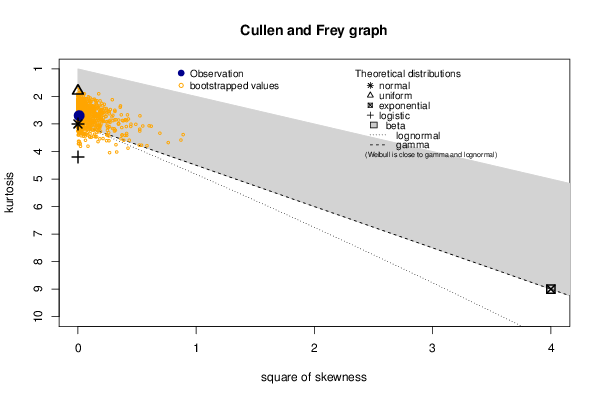
| Title produced by software | Skewness-Kurtosis Plot | ||||||||||||||||||||
| Date of computation | Wed, 09 Dec 2015 14:15:07 +0000 | ||||||||||||||||||||
| Cite this page as follows | Statistical Computations at FreeStatistics.org, Office for Research Development and Education, URL https://freestatistics.org/blog/index.php?v=date/2015/Dec/09/t1449670516ih5gv40xuy7avht.htm/, Retrieved Sat, 01 Jun 2024 03:54:58 +0000 | ||||||||||||||||||||
| Statistical Computations at FreeStatistics.org, Office for Research Development and Education, URL https://freestatistics.org/blog/index.php?pk=285692, Retrieved Sat, 01 Jun 2024 03:54:58 +0000 | |||||||||||||||||||||
| QR Codes: | |||||||||||||||||||||
|
| |||||||||||||||||||||
| Original text written by user: | |||||||||||||||||||||
| IsPrivate? | No (this computation is public) | ||||||||||||||||||||
| User-defined keywords | |||||||||||||||||||||
| Estimated Impact | 54 | ||||||||||||||||||||
Tree of Dependent Computations | |||||||||||||||||||||
| Family? (F = Feedback message, R = changed R code, M = changed R Module, P = changed Parameters, D = changed Data) | |||||||||||||||||||||
| - [Skewness-Kurtosis Plot] [] [2015-12-09 14:15:07] [fcea341501fb11a5fe375242ab163178] [Current] | |||||||||||||||||||||
| Feedback Forum | |||||||||||||||||||||
Post a new message | |||||||||||||||||||||
Dataset | |||||||||||||||||||||
| Dataseries X: | |||||||||||||||||||||
0.1612 -0.1676 -0.1925 -0.3593 0.4947 -0.07116 -0.4046 0.1431 0.4565 0.08523 -0.07941 0.1555 -0.02549 -0.341 -0.3167 0.1567 -0.1972 0.9132 0.1091 0.2624 0.4351 0.4824 -0.8608 0.2812 0.1513 -0.1374 -0.152 0.3974 -0.3842 -0.2577 -0.1894 -0.3635 -0.4854 0.4824 0.03833 -0.1694 -0.1708 -0.5577 0.2964 0.3872 0.7112 -0.09716 -0.3154 -0.1247 0.2924 -0.2167 -0.7461 -0.547 0.6943 -0.5418 0.1828 0.03512 0.1725 0.4946 | |||||||||||||||||||||
Tables (Output of Computation) | |||||||||||||||||||||
| |||||||||||||||||||||
Figures (Output of Computation) | |||||||||||||||||||||
Input Parameters & R Code | |||||||||||||||||||||
| Parameters (Session): | |||||||||||||||||||||
| Parameters (R input): | |||||||||||||||||||||
| R code (references can be found in the software module): | |||||||||||||||||||||
library(fitdistrplus) | |||||||||||||||||||||