Free Statistics

of Irreproducible Research!

Author's title

Author*Unverified author*
R Software Modulerwasp_spectrum.wasp
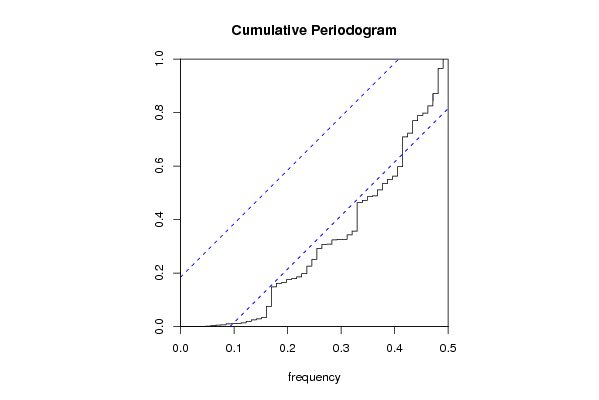
Title produced by softwareSpectral Analysis
Date of computationSat, 01 Dec 2007 05:34:10 -0700
Cite this page as followsStatistical Computations at FreeStatistics.org, Office for Research Development and Education, URL https://freestatistics.org/blog/index.php?v=date/2007/Dec/01/t11965118205dy3d1muj8588eb.htm/, Retrieved Sat, 18 May 2024 22:30:50 +0000
Statistical Computations at FreeStatistics.org, Office for Research Development and Education, URL https://freestatistics.org/blog/index.php?pk=2234, Retrieved Sat, 18 May 2024 22:30:50 +0000
QR Codes:

Original text written by user:
IsPrivate?No (this computation is public)
User-defined keywords
Estimated Impact230
Family? (F = Feedback message, R = changed R code, M = changed R Module, P = changed Parameters, D = changed Data)
-       [Spectral Analysis] [cumulatief period...] [2007-12-01 12:34:10] [bd02e85be52eb1cb060a2c60779eb820] [Current]
Feedback Forum

Post a new message
Dataseries X:
33259
33250
32875
32424
31867
31871
33140
33555
33324
32358
31857
32101
32810
32057
31663
31325
31103
31012
32511
33677
32213
31635
31043
31303
31899
31384
30650
30400
30003
29896
31557
31883
30830
30354
29756
29934
30599
30378
29925
29471
29567
29419
30796
31475
31708
31917
30871
31512
32362
31928
31699
30363
30386
30364
32806
33423
33071
33888
34805
35489
37259
37722
38764
39594
40004
40715
44028
45564
44277
44976
45406
47379
49200
50221
51573
53091
53337
54978
57885
67099
67169
69796
70600
71982
73957
75273
76322
77078
77954
79238
82179
83834
83744
84861
86478
88290
90287
91230
92380
92506
94172
94728
96581
97344
98346
98214
98366
98768


Summary of compuational transaction
Raw Inputview raw input (R code)
Raw Outputview raw output of R engine
Computing time1 seconds
R Server'Gwilym Jenkins' @ 72.249.127.135

\begin{tabular}{lllllllll}
\hline
Summary of compuational transaction \tabularnewline
Raw Input & view raw input (R code)  \tabularnewline
Raw Output & view raw output of R engine  \tabularnewline
Computing time & 1 seconds \tabularnewline
R Server & 'Gwilym Jenkins' @ 72.249.127.135 \tabularnewline
\hline
\end{tabular}
%Source: https://freestatistics.org/blog/index.php?pk=2234&T=0

[TABLE]
[ROW][C]Summary of compuational transaction[/C][/ROW]
[ROW][C]Raw Input[/C][C]view raw input (R code) [/C][/ROW]
[ROW][C]Raw Output[/C][C]view raw output of R engine [/C][/ROW]
[ROW][C]Computing time[/C][C]1 seconds[/C][/ROW]
[ROW][C]R Server[/C][C]'Gwilym Jenkins' @ 72.249.127.135[/C][/ROW]
[/TABLE]
Source: https://freestatistics.org/blog/index.php?pk=2234&T=0

Globally Unique Identifier (entire table): ba.freestatistics.org/blog/index.php?pk=2234&T=0

As an alternative you can also use a QR Code:  

The GUIDs for individual cells are displayed in the table below:

Summary of compuational transaction
Raw Inputview raw input (R code)
Raw Outputview raw output of R engine
Computing time1 seconds
R Server'Gwilym Jenkins' @ 72.249.127.135


Raw Periodogram
ParameterValue
Box-Cox transformation parameter (lambda)1
Degree of non-seasonal differencing (d)1
Degree of seasonal differencing (D)1
Seasonal Period (s)1
Frequency (Period)Spectrum
0.0093 (108)53248.620352
0.0185 (54)19401.862418
0.0278 (36)17478.485795
0.037 (27)20844.699359
0.0463 (21.6)104759.447944
0.0556 (18)251934.915627
0.0648 (15.4286)225816.683814
0.0741 (13.5)78669.50592
0.0833 (12)641367.502928
0.0926 (10.8)88325.575412
0.1019 (9.8182)56179.703702
0.1111 (9)253311.719529
0.1204 (8.3077)713473.569526
0.1296 (7.7143)698832.392533
0.1389 (7.2)353967.982367
0.1481 (6.75)926607.500062
0.1574 (6.3529)1146056.198806
0.1667 (6)14762591.454058
0.1759 (5.6842)174365.919655
0.1852 (5.4)924056.170277
0.1944 (5.1429)2253520.020732
0.2037 (4.9091)588908.517836
0.213 (4.6957)354817.192009
0.2222 (4.5)1160288.718848
0.2315 (4.32)3404009.211084
0.2407 (4.1538)1495361.157345
0.25 (4)8136476.811081
0.2593 (3.8571)875364.572492
0.2685 (3.7241)2194969.429429
0.2778 (3.6)1071560.531436
0.287 (3.4839)914001.962066
0.2963 (3.375)364940.852328
0.3056 (3.2727)372038.944173
0.3148 (3.1765)2956094.555322
0.3241 (3.0857)4459208.934764
0.3333 (3)12555119.989486
0.3426 (2.9189)48501.079093
0.3519 (2.8421)1206077.047553
0.3611 (2.7692)1207251.73052
0.3704 (2.7)2757080.613859
0.3796 (2.6341)3804495.196508
0.3889 (2.5714)1056823.372189
0.3981 (2.5116)2244994.871641
0.4074 (2.4545)6303761.52983
0.4167 (2.4)14215446.297514
0.4259 (2.3478)1545393.788917
0.4352 (2.2979)5609105.711852
0.4444 (2.25)2843150.13103
0.4537 (2.2041)865443.52634
0.463 (2.16)4136016.731415
0.4722 (2.1176)6496815.049239
0.4815 (2.0769)12172427.79051
0.4907 (2.0377)4594145.928046
0.5 (2)267700.809748

\begin{tabular}{lllllllll}
\hline
Raw Periodogram \tabularnewline
Parameter & Value \tabularnewline
Box-Cox transformation parameter (lambda) & 1 \tabularnewline
Degree of non-seasonal differencing (d) & 1 \tabularnewline
Degree of seasonal differencing (D) & 1 \tabularnewline
Seasonal Period (s) & 1 \tabularnewline
Frequency (Period) & Spectrum \tabularnewline
0.0093 (108) & 53248.620352 \tabularnewline
0.0185 (54) & 19401.862418 \tabularnewline
0.0278 (36) & 17478.485795 \tabularnewline
0.037 (27) & 20844.699359 \tabularnewline
0.0463 (21.6) & 104759.447944 \tabularnewline
0.0556 (18) & 251934.915627 \tabularnewline
0.0648 (15.4286) & 225816.683814 \tabularnewline
0.0741 (13.5) & 78669.50592 \tabularnewline
0.0833 (12) & 641367.502928 \tabularnewline
0.0926 (10.8) & 88325.575412 \tabularnewline
0.1019 (9.8182) & 56179.703702 \tabularnewline
0.1111 (9) & 253311.719529 \tabularnewline
0.1204 (8.3077) & 713473.569526 \tabularnewline
0.1296 (7.7143) & 698832.392533 \tabularnewline
0.1389 (7.2) & 353967.982367 \tabularnewline
0.1481 (6.75) & 926607.500062 \tabularnewline
0.1574 (6.3529) & 1146056.198806 \tabularnewline
0.1667 (6) & 14762591.454058 \tabularnewline
0.1759 (5.6842) & 174365.919655 \tabularnewline
0.1852 (5.4) & 924056.170277 \tabularnewline
0.1944 (5.1429) & 2253520.020732 \tabularnewline
0.2037 (4.9091) & 588908.517836 \tabularnewline
0.213 (4.6957) & 354817.192009 \tabularnewline
0.2222 (4.5) & 1160288.718848 \tabularnewline
0.2315 (4.32) & 3404009.211084 \tabularnewline
0.2407 (4.1538) & 1495361.157345 \tabularnewline
0.25 (4) & 8136476.811081 \tabularnewline
0.2593 (3.8571) & 875364.572492 \tabularnewline
0.2685 (3.7241) & 2194969.429429 \tabularnewline
0.2778 (3.6) & 1071560.531436 \tabularnewline
0.287 (3.4839) & 914001.962066 \tabularnewline
0.2963 (3.375) & 364940.852328 \tabularnewline
0.3056 (3.2727) & 372038.944173 \tabularnewline
0.3148 (3.1765) & 2956094.555322 \tabularnewline
0.3241 (3.0857) & 4459208.934764 \tabularnewline
0.3333 (3) & 12555119.989486 \tabularnewline
0.3426 (2.9189) & 48501.079093 \tabularnewline
0.3519 (2.8421) & 1206077.047553 \tabularnewline
0.3611 (2.7692) & 1207251.73052 \tabularnewline
0.3704 (2.7) & 2757080.613859 \tabularnewline
0.3796 (2.6341) & 3804495.196508 \tabularnewline
0.3889 (2.5714) & 1056823.372189 \tabularnewline
0.3981 (2.5116) & 2244994.871641 \tabularnewline
0.4074 (2.4545) & 6303761.52983 \tabularnewline
0.4167 (2.4) & 14215446.297514 \tabularnewline
0.4259 (2.3478) & 1545393.788917 \tabularnewline
0.4352 (2.2979) & 5609105.711852 \tabularnewline
0.4444 (2.25) & 2843150.13103 \tabularnewline
0.4537 (2.2041) & 865443.52634 \tabularnewline
0.463 (2.16) & 4136016.731415 \tabularnewline
0.4722 (2.1176) & 6496815.049239 \tabularnewline
0.4815 (2.0769) & 12172427.79051 \tabularnewline
0.4907 (2.0377) & 4594145.928046 \tabularnewline
0.5 (2) & 267700.809748 \tabularnewline
\hline
\end{tabular}
%Source: https://freestatistics.org/blog/index.php?pk=2234&T=1

[TABLE]
[ROW][C]Raw Periodogram[/C][/ROW]
[ROW][C]Parameter[/C][C]Value[/C][/ROW]
[ROW][C]Box-Cox transformation parameter (lambda)[/C][C]1[/C][/ROW]
[ROW][C]Degree of non-seasonal differencing (d)[/C][C]1[/C][/ROW]
[ROW][C]Degree of seasonal differencing (D)[/C][C]1[/C][/ROW]
[ROW][C]Seasonal Period (s)[/C][C]1[/C][/ROW]
[ROW][C]Frequency (Period)[/C][C]Spectrum[/C][/ROW]
[ROW][C]0.0093 (108)[/C][C]53248.620352[/C][/ROW]
[ROW][C]0.0185 (54)[/C][C]19401.862418[/C][/ROW]
[ROW][C]0.0278 (36)[/C][C]17478.485795[/C][/ROW]
[ROW][C]0.037 (27)[/C][C]20844.699359[/C][/ROW]
[ROW][C]0.0463 (21.6)[/C][C]104759.447944[/C][/ROW]
[ROW][C]0.0556 (18)[/C][C]251934.915627[/C][/ROW]
[ROW][C]0.0648 (15.4286)[/C][C]225816.683814[/C][/ROW]
[ROW][C]0.0741 (13.5)[/C][C]78669.50592[/C][/ROW]
[ROW][C]0.0833 (12)[/C][C]641367.502928[/C][/ROW]
[ROW][C]0.0926 (10.8)[/C][C]88325.575412[/C][/ROW]
[ROW][C]0.1019 (9.8182)[/C][C]56179.703702[/C][/ROW]
[ROW][C]0.1111 (9)[/C][C]253311.719529[/C][/ROW]
[ROW][C]0.1204 (8.3077)[/C][C]713473.569526[/C][/ROW]
[ROW][C]0.1296 (7.7143)[/C][C]698832.392533[/C][/ROW]
[ROW][C]0.1389 (7.2)[/C][C]353967.982367[/C][/ROW]
[ROW][C]0.1481 (6.75)[/C][C]926607.500062[/C][/ROW]
[ROW][C]0.1574 (6.3529)[/C][C]1146056.198806[/C][/ROW]
[ROW][C]0.1667 (6)[/C][C]14762591.454058[/C][/ROW]
[ROW][C]0.1759 (5.6842)[/C][C]174365.919655[/C][/ROW]
[ROW][C]0.1852 (5.4)[/C][C]924056.170277[/C][/ROW]
[ROW][C]0.1944 (5.1429)[/C][C]2253520.020732[/C][/ROW]
[ROW][C]0.2037 (4.9091)[/C][C]588908.517836[/C][/ROW]
[ROW][C]0.213 (4.6957)[/C][C]354817.192009[/C][/ROW]
[ROW][C]0.2222 (4.5)[/C][C]1160288.718848[/C][/ROW]
[ROW][C]0.2315 (4.32)[/C][C]3404009.211084[/C][/ROW]
[ROW][C]0.2407 (4.1538)[/C][C]1495361.157345[/C][/ROW]
[ROW][C]0.25 (4)[/C][C]8136476.811081[/C][/ROW]
[ROW][C]0.2593 (3.8571)[/C][C]875364.572492[/C][/ROW]
[ROW][C]0.2685 (3.7241)[/C][C]2194969.429429[/C][/ROW]
[ROW][C]0.2778 (3.6)[/C][C]1071560.531436[/C][/ROW]
[ROW][C]0.287 (3.4839)[/C][C]914001.962066[/C][/ROW]
[ROW][C]0.2963 (3.375)[/C][C]364940.852328[/C][/ROW]
[ROW][C]0.3056 (3.2727)[/C][C]372038.944173[/C][/ROW]
[ROW][C]0.3148 (3.1765)[/C][C]2956094.555322[/C][/ROW]
[ROW][C]0.3241 (3.0857)[/C][C]4459208.934764[/C][/ROW]
[ROW][C]0.3333 (3)[/C][C]12555119.989486[/C][/ROW]
[ROW][C]0.3426 (2.9189)[/C][C]48501.079093[/C][/ROW]
[ROW][C]0.3519 (2.8421)[/C][C]1206077.047553[/C][/ROW]
[ROW][C]0.3611 (2.7692)[/C][C]1207251.73052[/C][/ROW]
[ROW][C]0.3704 (2.7)[/C][C]2757080.613859[/C][/ROW]
[ROW][C]0.3796 (2.6341)[/C][C]3804495.196508[/C][/ROW]
[ROW][C]0.3889 (2.5714)[/C][C]1056823.372189[/C][/ROW]
[ROW][C]0.3981 (2.5116)[/C][C]2244994.871641[/C][/ROW]
[ROW][C]0.4074 (2.4545)[/C][C]6303761.52983[/C][/ROW]
[ROW][C]0.4167 (2.4)[/C][C]14215446.297514[/C][/ROW]
[ROW][C]0.4259 (2.3478)[/C][C]1545393.788917[/C][/ROW]
[ROW][C]0.4352 (2.2979)[/C][C]5609105.711852[/C][/ROW]
[ROW][C]0.4444 (2.25)[/C][C]2843150.13103[/C][/ROW]
[ROW][C]0.4537 (2.2041)[/C][C]865443.52634[/C][/ROW]
[ROW][C]0.463 (2.16)[/C][C]4136016.731415[/C][/ROW]
[ROW][C]0.4722 (2.1176)[/C][C]6496815.049239[/C][/ROW]
[ROW][C]0.4815 (2.0769)[/C][C]12172427.79051[/C][/ROW]
[ROW][C]0.4907 (2.0377)[/C][C]4594145.928046[/C][/ROW]
[ROW][C]0.5 (2)[/C][C]267700.809748[/C][/ROW]
[/TABLE]
Source: https://freestatistics.org/blog/index.php?pk=2234&T=1

Globally Unique Identifier (entire table): ba.freestatistics.org/blog/index.php?pk=2234&T=1

As an alternative you can also use a QR Code:  

The GUIDs for individual cells are displayed in the table below:

Raw Periodogram
ParameterValue
Box-Cox transformation parameter (lambda)1
Degree of non-seasonal differencing (d)1
Degree of seasonal differencing (D)1
Seasonal Period (s)1
Frequency (Period)Spectrum
0.0093 (108)53248.620352
0.0185 (54)19401.862418
0.0278 (36)17478.485795
0.037 (27)20844.699359
0.0463 (21.6)104759.447944
0.0556 (18)251934.915627
0.0648 (15.4286)225816.683814
0.0741 (13.5)78669.50592
0.0833 (12)641367.502928
0.0926 (10.8)88325.575412
0.1019 (9.8182)56179.703702
0.1111 (9)253311.719529
0.1204 (8.3077)713473.569526
0.1296 (7.7143)698832.392533
0.1389 (7.2)353967.982367
0.1481 (6.75)926607.500062
0.1574 (6.3529)1146056.198806
0.1667 (6)14762591.454058
0.1759 (5.6842)174365.919655
0.1852 (5.4)924056.170277
0.1944 (5.1429)2253520.020732
0.2037 (4.9091)588908.517836
0.213 (4.6957)354817.192009
0.2222 (4.5)1160288.718848
0.2315 (4.32)3404009.211084
0.2407 (4.1538)1495361.157345
0.25 (4)8136476.811081
0.2593 (3.8571)875364.572492
0.2685 (3.7241)2194969.429429
0.2778 (3.6)1071560.531436
0.287 (3.4839)914001.962066
0.2963 (3.375)364940.852328
0.3056 (3.2727)372038.944173
0.3148 (3.1765)2956094.555322
0.3241 (3.0857)4459208.934764
0.3333 (3)12555119.989486
0.3426 (2.9189)48501.079093
0.3519 (2.8421)1206077.047553
0.3611 (2.7692)1207251.73052
0.3704 (2.7)2757080.613859
0.3796 (2.6341)3804495.196508
0.3889 (2.5714)1056823.372189
0.3981 (2.5116)2244994.871641
0.4074 (2.4545)6303761.52983
0.4167 (2.4)14215446.297514
0.4259 (2.3478)1545393.788917
0.4352 (2.2979)5609105.711852
0.4444 (2.25)2843150.13103
0.4537 (2.2041)865443.52634
0.463 (2.16)4136016.731415
0.4722 (2.1176)6496815.049239
0.4815 (2.0769)12172427.79051
0.4907 (2.0377)4594145.928046
0.5 (2)267700.809748


Parameters (Session):
par1 = Default ; par2 = 1 ; par3 = 1 ; par4 = 0 ; par5 = 12 ;
Parameters (R input):
par1 = 1 ; par2 = 1 ; par3 = 1 ; par4 = 1 ;
R code (references can be found in the software module):
par1 <- as.numeric(par1)
par2 <- as.numeric(par2)
par3 <- as.numeric(par3)
par4 <- as.numeric(par4)
if (par1 == 0) {
x <- log(x)
} else {
x <- (x ^ par1 - 1) / par1
}
if (par2 > 0) x <- diff(x,lag=1,difference=par2)
if (par3 > 0) x <- diff(x,lag=par4,difference=par3)
bitmap(file='test1.png')
r <- spectrum(x,main='Raw Periodogram')
dev.off()
bitmap(file='test2.png')
cpgram(x,main='Cumulative Periodogram')
dev.off()
load(file='createtable')
a<-table.start()
a<-table.row.start(a)
a<-table.element(a,'Raw Periodogram',2,TRUE)
a<-table.row.end(a)
a<-table.row.start(a)
a<-table.element(a,'Parameter',header=TRUE)
a<-table.element(a,'Value',header=TRUE)
a<-table.row.end(a)
a<-table.row.start(a)
a<-table.element(a,'Box-Cox transformation parameter (lambda)',header=TRUE)
a<-table.element(a,par1)
a<-table.row.end(a)
a<-table.row.start(a)
a<-table.element(a,'Degree of non-seasonal differencing (d)',header=TRUE)
a<-table.element(a,par2)
a<-table.row.end(a)
a<-table.row.start(a)
a<-table.element(a,'Degree of seasonal differencing (D)',header=TRUE)
a<-table.element(a,par3)
a<-table.row.end(a)
a<-table.row.start(a)
a<-table.element(a,'Seasonal Period (s)',header=TRUE)
a<-table.element(a,par4)
a<-table.row.end(a)
a<-table.row.start(a)
a<-table.element(a,'Frequency (Period)',header=TRUE)
a<-table.element(a,'Spectrum',header=TRUE)
a<-table.row.end(a)
for (i in 1:length(r$freq)) {
a<-table.row.start(a)
mylab <- round(r$freq[i],4)
mylab <- paste(mylab,' (',sep='')
mylab <- paste(mylab,round(1/r$freq[i],4),sep='')
mylab <- paste(mylab,')',sep='')
a<-table.element(a,mylab,header=TRUE)
a<-table.element(a,round(r$spec[i],6))
a<-table.row.end(a)
}
a<-table.end(a)
table.save(a,file='mytable.tab')