Free Statistics

of Irreproducible Research!

Author's title

Author*Unverified author*
R Software Modulerwasp_insce.wasp
Title produced by softwareInsurance Experiment
Date of computationThu, 17 Apr 2008 18:42:42 -0600
Cite this page as followsStatistical Computations at FreeStatistics.org, Office for Research Development and Education, URL https://freestatistics.org/blog/index.php?v=date/2008/Apr/18/t1208479405vre057lgg9df8z0.htm/, Retrieved Sun, 12 May 2024 17:34:15 +0000
Statistical Computations at FreeStatistics.org, Office for Research Development and Education, URL https://freestatistics.org/blog/index.php?pk=10185, Retrieved Sun, 12 May 2024 17:34:15 +0000
QR Codes:

Original text written by user:
IsPrivate?No (this computation is public)
User-defined keywords
Estimated Impact307
Family? (F = Feedback message, R = changed R code, M = changed R Module, P = changed Parameters, D = changed Data)
-       [Insurance Experiment] [Insurance experim...] [2008-04-18 00:42:42] [d41d8cd98f00b204e9800998ecf8427e] [Current]
Feedback Forum

Post a new message


Summary of compuational transaction
Raw Inputview raw input (R code)
Raw Outputview raw output of R engine
Computing time2 seconds
R Server'Sir Ronald Aylmer Fisher' @ 193.190.124.24

\begin{tabular}{lllllllll}
\hline
Summary of compuational transaction \tabularnewline
Raw Input & view raw input (R code)  \tabularnewline
Raw Output & view raw output of R engine  \tabularnewline
Computing time & 2 seconds \tabularnewline
R Server & 'Sir Ronald Aylmer Fisher' @ 193.190.124.24 \tabularnewline
\hline
\end{tabular}
%Source: https://freestatistics.org/blog/index.php?pk=10185&T=0

[TABLE]
[ROW][C]Summary of compuational transaction[/C][/ROW]
[ROW][C]Raw Input[/C][C]view raw input (R code) [/C][/ROW]
[ROW][C]Raw Output[/C][C]view raw output of R engine [/C][/ROW]
[ROW][C]Computing time[/C][C]2 seconds[/C][/ROW]
[ROW][C]R Server[/C][C]'Sir Ronald Aylmer Fisher' @ 193.190.124.24[/C][/ROW]
[/TABLE]
Source: https://freestatistics.org/blog/index.php?pk=10185&T=0

Globally Unique Identifier (entire table): ba.freestatistics.org/blog/index.php?pk=10185&T=0

As an alternative you can also use a QR Code:  

The GUIDs for individual cells are displayed in the table below:

Summary of compuational transaction
Raw Inputview raw input (R code)
Raw Outputview raw output of R engine
Computing time2 seconds
R Server'Sir Ronald Aylmer Fisher' @ 193.190.124.24


Summary Statistics
Number of policies300
Number of simulations325
Mean of gross profit per policy in USD270.03
Risk of loss in percent5
SD of gross profit per policy162.30

\begin{tabular}{lllllllll}
\hline
Summary Statistics \tabularnewline
Number of policies & 300 \tabularnewline
Number of simulations & 325 \tabularnewline
Mean of gross profit per policy in USD & 270.03 \tabularnewline
Risk of loss in percent & 5 \tabularnewline
SD of gross profit per policy & 162.30 \tabularnewline
\hline
\end{tabular}
%Source: https://freestatistics.org/blog/index.php?pk=10185&T=1

[TABLE]
[ROW][C]Summary Statistics[/C][/ROW]
[ROW][C]Number of policies[/C][C]300[/C][/ROW]
[ROW][C]Number of simulations[/C][C]325[/C][/ROW]
[ROW][C]Mean of gross profit per policy in USD[/C][C]270.03[/C][/ROW]
[ROW][C]Risk of loss in percent[/C][C]5[/C][/ROW]
[ROW][C]SD of gross profit per policy[/C][C]162.30[/C][/ROW]
[/TABLE]
Source: https://freestatistics.org/blog/index.php?pk=10185&T=1

Globally Unique Identifier (entire table): ba.freestatistics.org/blog/index.php?pk=10185&T=1

As an alternative you can also use a QR Code:  

The GUIDs for individual cells are displayed in the table below:

Summary Statistics
Number of policies300
Number of simulations325
Mean of gross profit per policy in USD270.03
Risk of loss in percent5
SD of gross profit per policy162.30


Parameters (Session):
par1 = 325 ; par2 = 300 ; par3 = 1460 ; par4 = 6000 ; par5 = 0.2 ; par6 = TRUE ;
Parameters (R input):
par1 = 325 ; par2 = 300 ; par3 = 1460 ; par4 = 6000 ; par5 = 0.2 ; par6 = TRUE ;
R code (references can be found in the software module):
par1 <- as.numeric(par1)
par2 <- as.numeric(par2)
par3 <- as.numeric(par3)
par4 <- as.numeric(par4)
par5 <- as.numeric(par5)
if (par6 == 'TRUE') par6 <- TRUE
if (par6 == 'FALSE') par6 <- FALSE
reps = par1
policies = par2
prem = par3
cost = par4
prob = par5
Poisson = par6
gross.profit <- 1:policies
gross.profit.rate <- 1:reps
if (Poisson==T) {
for (j in 1:reps) {
totalcost=cost*rpois(policies,prob)
gross.profit=prem-totalcost
gross.profit.rate[j]=sum(gross.profit)/policies
}
}
if (Poisson==F){
for (j in 1:reps) {
totalcost=cost*rbinom(policies,1,prob)
gross.profit = prem-totalcost
gross.profit.rate[j] = sum(gross.profit)/policies
}
}
risk <- 100 * (length (gross.profit.rate[gross.profit.rate < 0]))/reps
print(risk)
avgprofit <- format(mean(gross.profit.rate), digits = 5)
sdprofit <- format(sd(gross.profit.rate), digits = 5)
bitmap(file='test1.png')
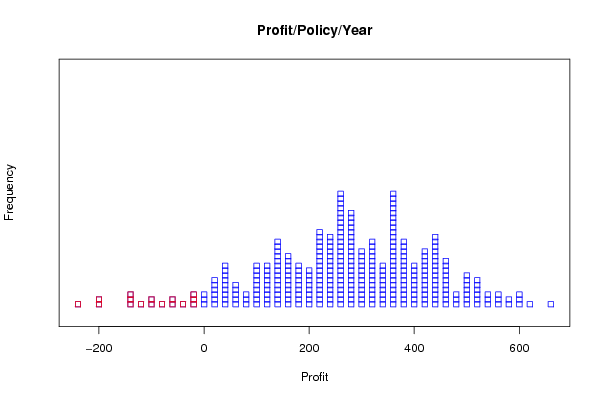
stripchart(gross.profit.rate, method = 'stack', main = main, xlab = xlab, ylab = ylab, col = 'blue',at=0.1)
stripchart(gross.profit.rate[gross.profit.rate<0], method = 'stack', col = 'red', add = TRUE, at=0.1)
dev.off()
x<-rnorm(100)
load(file='createtable')
a<-table.start()
a<-table.row.start(a)
a<-table.element(a,'Summary Statistics',2,TRUE)
a<-table.row.end(a)
a<-table.row.start(a)
a<-table.element(a,'Number of policies',header=TRUE)
a<-table.element(a,policies)
a<-table.row.end(a)
a<-table.row.start(a)
a<-table.element(a,'Number of simulations',header=TRUE)
a<-table.element(a,reps)
a<-table.row.end(a)
a<-table.row.start(a)
a<-table.element(a,'Mean of gross profit per policy in USD',header=TRUE)
a<-table.element(a,avgprofit)
a<-table.row.end(a)
a<-table.row.start(a)
a<-table.element(a,'Risk of loss in percent',header=TRUE)
a<-table.element(a, round(risk,0) )
a<-table.row.end(a)
a<-table.row.start(a)
a<-table.element(a,'SD of gross profit per policy',header=TRUE)
a<-table.element(a,sdprofit)
a<-table.row.end(a)
a<-table.end(a)
table.save(a,file='mytable.tab')