Free Statistics

of Irreproducible Research!

Author's title

Author*Unverified author*
R Software Modulerwasp_centraltendency.wasp
Title produced by softwareCentral Tendency
Date of computationSat, 19 Apr 2008 05:41:24 -0600
Cite this page as followsStatistical Computations at FreeStatistics.org, Office for Research Development and Education, URL https://freestatistics.org/blog/index.php?v=date/2008/Apr/19/t1208605380rusnpclsxtjsup0.htm/, Retrieved Tue, 14 May 2024 16:39:44 +0000
Statistical Computations at FreeStatistics.org, Office for Research Development and Education, URL https://freestatistics.org/blog/index.php?pk=10244, Retrieved Tue, 14 May 2024 16:39:44 +0000
QR Codes:

Original text written by user:
IsPrivate?No (this computation is public)
User-defined keywords
Estimated Impact225
Family? (F = Feedback message, R = changed R code, M = changed R Module, P = changed Parameters, D = changed Data)
-       [Central Tendency] [Centrummaten insc...] [2008-04-19 11:41:24] [d41d8cd98f00b204e9800998ecf8427e] [Current]
Feedback Forum

Post a new message
Dataseries X:
56421
53152
53536
52408
41454
38271
35306
26414
31917
38030
27534
18387
50556
43901
48572
43899
37532
40357
35489
29027
34485
42598
30306
26451
47460
50104
61465
53726
39477
43895
31481
29896
33842
39120
33702
25094
51442
45594
52518
48564
41745
49585
32747
33379
35645
37034
35681
20972
58552
54955
65540
51570
51145
46641
35704
33253
35193
41668
34865
21210
56126
49231
59723
48103
47472
50497
40059
34149
36860
46356
36577


Summary of compuational transaction
Raw Inputview raw input (R code)
Raw Outputview raw output of R engine
Computing time3 seconds
R Server'Sir Ronald Aylmer Fisher' @ 193.190.124.24

\begin{tabular}{lllllllll}
\hline
Summary of compuational transaction \tabularnewline
Raw Input & view raw input (R code)  \tabularnewline
Raw Output & view raw output of R engine  \tabularnewline
Computing time & 3 seconds \tabularnewline
R Server & 'Sir Ronald Aylmer Fisher' @ 193.190.124.24 \tabularnewline
\hline
\end{tabular}
%Source: https://freestatistics.org/blog/index.php?pk=10244&T=0

[TABLE]
[ROW][C]Summary of compuational transaction[/C][/ROW]
[ROW][C]Raw Input[/C][C]view raw input (R code) [/C][/ROW]
[ROW][C]Raw Output[/C][C]view raw output of R engine [/C][/ROW]
[ROW][C]Computing time[/C][C]3 seconds[/C][/ROW]
[ROW][C]R Server[/C][C]'Sir Ronald Aylmer Fisher' @ 193.190.124.24[/C][/ROW]
[/TABLE]
Source: https://freestatistics.org/blog/index.php?pk=10244&T=0

Globally Unique Identifier (entire table): ba.freestatistics.org/blog/index.php?pk=10244&T=0

As an alternative you can also use a QR Code:  

The GUIDs for individual cells are displayed in the table below:

Summary of compuational transaction
Raw Inputview raw input (R code)
Raw Outputview raw output of R engine
Computing time3 seconds
R Server'Sir Ronald Aylmer Fisher' @ 193.190.124.24


Central Tendency - Ungrouped Data
MeasureValueS.E.Value/S.E.
Arithmetic Mean41487.60563380281232.2418743138233.6683945730261
Geometric Mean40122.713537077
Harmonic Mean38657.5977773246
Quadratic Mean42749.3955957604
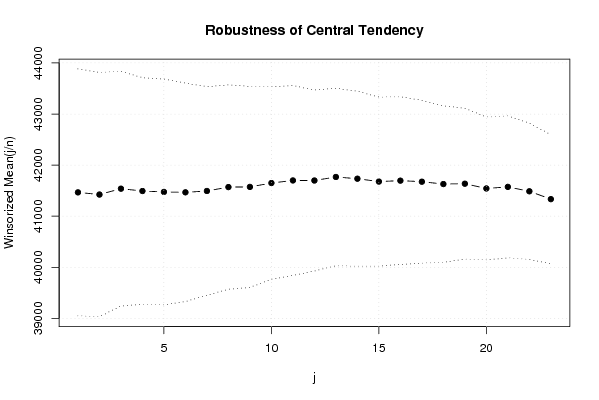
Winsorized Mean ( 1 / 23 )41466.61971830991208.1503080109534.3224013132759
Winsorized Mean ( 2 / 23 )41424.25352112681195.3584281367834.6542531060707
Winsorized Mean ( 3 / 23 )41538.88732394371148.0312546221336.182714674973
Winsorized Mean ( 4 / 23 )41493.19718309861108.9201161453637.4176611813394
Winsorized Mean ( 5 / 23 )41475.02816901411104.4477680828937.5527293979750
Winsorized Mean ( 6 / 23 )41467.59154929581068.7215084420438.8011200502051
Winsorized Mean ( 7 / 23 )41493.61971830991020.8478143715340.6462345651932
Winsorized Mean ( 8 / 23 )41570.12676056341000.4807272936141.5501524682183
Winsorized Mean ( 9 / 23 )41573.4225352113983.64448184533542.2646833307282
Winsorized Mean ( 10 / 23 )41649.6197183099942.46652196063644.1921476761478
Winsorized Mean ( 11 / 23 )41700.1267605634929.37448814085344.8690245887656
Winsorized Mean ( 12 / 23 )41698.7746478873885.75009469964847.0773583851855
Winsorized Mean ( 13 / 23 )41767.9859154930868.84482676433948.0730098503791
Winsorized Mean ( 14 / 23 )41734.2676056338856.1173434862848.7483029320298
Winsorized Mean ( 15 / 23 )41678.0704225352827.34828411555450.375484209881
Winsorized Mean ( 16 / 23 )41696.323943662820.98263662987850.7883140072545
Winsorized Mean ( 17 / 23 )41675.7323943662796.68096307408252.3116960565441
Winsorized Mean ( 18 / 23 )41629.338028169765.53954670078454.3790823185783
Winsorized Mean ( 19 / 23 )41636.2957746479738.09938979315356.4101479426994
Winsorized Mean ( 20 / 23 )41543.0563380282699.06434676677159.4266558295644
Winsorized Mean ( 21 / 23 )41574.1126760563694.40071539491159.8704922883221
Winsorized Mean ( 22 / 23 )41487.9718309859666.70269784410562.228594492184
Winsorized Mean ( 23 / 23 )41334.0985915493631.51754219385265.4520196667178
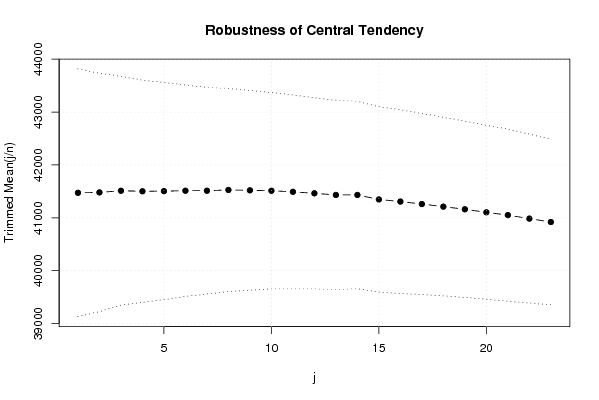
Trimmed Mean ( 1 / 23 )41473.81159420291171.0469589573635.4160106705961
Trimmed Mean ( 2 / 23 )41481.43283582091126.7885440431336.8138574492227
Trimmed Mean ( 3 / 23 )41512.66153846151082.0491002822438.3648593466171
Trimmed Mean ( 4 / 23 )41502.80952380951050.5327746081739.5064395199755
Trimmed Mean ( 5 / 23 )41505.60655737701027.0270092592140.4133544523964
Trimmed Mean ( 6 / 23 )41512.9661016949999.7239405531341.5244293126825
Trimmed Mean ( 7 / 23 )41512.9661016949976.54287723283142.5101314745417
Trimmed Mean ( 8 / 23 )41527.6909090909960.31379371842743.2438763045272
Trimmed Mean ( 9 / 23 )41520.5849056604944.66711733767543.952609489231
Trimmed Mean ( 10 / 23 )41512.4117647059928.4993446845244.7091449254718
Trimmed Mean ( 11 / 23 )41492.5306122449916.73119103550845.2613928902935
Trimmed Mean ( 12 / 23 )41464.0212765957903.72216044722845.8813815698359
Trimmed Mean ( 13 / 23 )41433.1555555556895.43595158417146.27148986173
Trimmed Mean ( 14 / 23 )41433.1555555556886.8440735994546.7197749739591
Trimmed Mean ( 15 / 23 )41348.1219512195876.86986978150747.1542282112195
Trimmed Mean ( 16 / 23 )41308.0769230769868.43217378507347.5662673148498
Trimmed Mean ( 17 / 23 )41261.5135135135856.6239373274848.1675934042216
Trimmed Mean ( 18 / 23 )41212.0857142857844.4404257003748.8040179745123
Trimmed Mean ( 19 / 23 )41162.2121212121833.2139896636249.401729485879
Trimmed Mean ( 20 / 23 )41105.064516129821.91871237594450.011106812869
Trimmed Mean ( 21 / 23 )41051.4482758621813.5784583233550.4578849843963
Trimmed Mean ( 22 / 23 )40986798.77629165027451.3109871041901
Trimmed Mean ( 23 / 23 )40921.2782.0197226839452.3275805110847
Median40357
Midrange41963.5
Midmean - Weighted Average at Xnp41015.8888888889
Midmean - Weighted Average at X(n+1)p41261.5135135135
Midmean - Empirical Distribution Function41261.5135135135
Midmean - Empirical Distribution Function - Averaging41261.5135135135
Midmean - Empirical Distribution Function - Interpolation41212.0857142857
Midmean - Closest Observation41015.8888888889
Midmean - True Basic - Statistics Graphics Toolkit41261.5135135135
Midmean - MS Excel (old versions)41261.5135135135
Number of observations71

\begin{tabular}{lllllllll}
\hline
Central Tendency - Ungrouped Data \tabularnewline
Measure & Value & S.E. & Value/S.E. \tabularnewline
Arithmetic Mean & 41487.6056338028 & 1232.24187431382 & 33.6683945730261 \tabularnewline
Geometric Mean & 40122.713537077 &  &  \tabularnewline
Harmonic Mean & 38657.5977773246 &  &  \tabularnewline
Quadratic Mean & 42749.3955957604 &  &  \tabularnewline
Winsorized Mean ( 1 / 23 ) & 41466.6197183099 & 1208.15030801095 & 34.3224013132759 \tabularnewline
Winsorized Mean ( 2 / 23 ) & 41424.2535211268 & 1195.35842813678 & 34.6542531060707 \tabularnewline
Winsorized Mean ( 3 / 23 ) & 41538.8873239437 & 1148.03125462213 & 36.182714674973 \tabularnewline
Winsorized Mean ( 4 / 23 ) & 41493.1971830986 & 1108.92011614536 & 37.4176611813394 \tabularnewline
Winsorized Mean ( 5 / 23 ) & 41475.0281690141 & 1104.44776808289 & 37.5527293979750 \tabularnewline
Winsorized Mean ( 6 / 23 ) & 41467.5915492958 & 1068.72150844204 & 38.8011200502051 \tabularnewline
Winsorized Mean ( 7 / 23 ) & 41493.6197183099 & 1020.84781437153 & 40.6462345651932 \tabularnewline
Winsorized Mean ( 8 / 23 ) & 41570.1267605634 & 1000.48072729361 & 41.5501524682183 \tabularnewline
Winsorized Mean ( 9 / 23 ) & 41573.4225352113 & 983.644481845335 & 42.2646833307282 \tabularnewline
Winsorized Mean ( 10 / 23 ) & 41649.6197183099 & 942.466521960636 & 44.1921476761478 \tabularnewline
Winsorized Mean ( 11 / 23 ) & 41700.1267605634 & 929.374488140853 & 44.8690245887656 \tabularnewline
Winsorized Mean ( 12 / 23 ) & 41698.7746478873 & 885.750094699648 & 47.0773583851855 \tabularnewline
Winsorized Mean ( 13 / 23 ) & 41767.9859154930 & 868.844826764339 & 48.0730098503791 \tabularnewline
Winsorized Mean ( 14 / 23 ) & 41734.2676056338 & 856.11734348628 & 48.7483029320298 \tabularnewline
Winsorized Mean ( 15 / 23 ) & 41678.0704225352 & 827.348284115554 & 50.375484209881 \tabularnewline
Winsorized Mean ( 16 / 23 ) & 41696.323943662 & 820.982636629878 & 50.7883140072545 \tabularnewline
Winsorized Mean ( 17 / 23 ) & 41675.7323943662 & 796.680963074082 & 52.3116960565441 \tabularnewline
Winsorized Mean ( 18 / 23 ) & 41629.338028169 & 765.539546700784 & 54.3790823185783 \tabularnewline
Winsorized Mean ( 19 / 23 ) & 41636.2957746479 & 738.099389793153 & 56.4101479426994 \tabularnewline
Winsorized Mean ( 20 / 23 ) & 41543.0563380282 & 699.064346766771 & 59.4266558295644 \tabularnewline
Winsorized Mean ( 21 / 23 ) & 41574.1126760563 & 694.400715394911 & 59.8704922883221 \tabularnewline
Winsorized Mean ( 22 / 23 ) & 41487.9718309859 & 666.702697844105 & 62.228594492184 \tabularnewline
Winsorized Mean ( 23 / 23 ) & 41334.0985915493 & 631.517542193852 & 65.4520196667178 \tabularnewline
Trimmed Mean ( 1 / 23 ) & 41473.8115942029 & 1171.04695895736 & 35.4160106705961 \tabularnewline
Trimmed Mean ( 2 / 23 ) & 41481.4328358209 & 1126.78854404313 & 36.8138574492227 \tabularnewline
Trimmed Mean ( 3 / 23 ) & 41512.6615384615 & 1082.04910028224 & 38.3648593466171 \tabularnewline
Trimmed Mean ( 4 / 23 ) & 41502.8095238095 & 1050.53277460817 & 39.5064395199755 \tabularnewline
Trimmed Mean ( 5 / 23 ) & 41505.6065573770 & 1027.02700925921 & 40.4133544523964 \tabularnewline
Trimmed Mean ( 6 / 23 ) & 41512.9661016949 & 999.72394055313 & 41.5244293126825 \tabularnewline
Trimmed Mean ( 7 / 23 ) & 41512.9661016949 & 976.542877232831 & 42.5101314745417 \tabularnewline
Trimmed Mean ( 8 / 23 ) & 41527.6909090909 & 960.313793718427 & 43.2438763045272 \tabularnewline
Trimmed Mean ( 9 / 23 ) & 41520.5849056604 & 944.667117337675 & 43.952609489231 \tabularnewline
Trimmed Mean ( 10 / 23 ) & 41512.4117647059 & 928.49934468452 & 44.7091449254718 \tabularnewline
Trimmed Mean ( 11 / 23 ) & 41492.5306122449 & 916.731191035508 & 45.2613928902935 \tabularnewline
Trimmed Mean ( 12 / 23 ) & 41464.0212765957 & 903.722160447228 & 45.8813815698359 \tabularnewline
Trimmed Mean ( 13 / 23 ) & 41433.1555555556 & 895.435951584171 & 46.27148986173 \tabularnewline
Trimmed Mean ( 14 / 23 ) & 41433.1555555556 & 886.84407359945 & 46.7197749739591 \tabularnewline
Trimmed Mean ( 15 / 23 ) & 41348.1219512195 & 876.869869781507 & 47.1542282112195 \tabularnewline
Trimmed Mean ( 16 / 23 ) & 41308.0769230769 & 868.432173785073 & 47.5662673148498 \tabularnewline
Trimmed Mean ( 17 / 23 ) & 41261.5135135135 & 856.62393732748 & 48.1675934042216 \tabularnewline
Trimmed Mean ( 18 / 23 ) & 41212.0857142857 & 844.44042570037 & 48.8040179745123 \tabularnewline
Trimmed Mean ( 19 / 23 ) & 41162.2121212121 & 833.21398966362 & 49.401729485879 \tabularnewline
Trimmed Mean ( 20 / 23 ) & 41105.064516129 & 821.918712375944 & 50.011106812869 \tabularnewline
Trimmed Mean ( 21 / 23 ) & 41051.4482758621 & 813.57845832335 & 50.4578849843963 \tabularnewline
Trimmed Mean ( 22 / 23 ) & 40986 & 798.776291650274 & 51.3109871041901 \tabularnewline
Trimmed Mean ( 23 / 23 ) & 40921.2 & 782.01972268394 & 52.3275805110847 \tabularnewline
Median & 40357 &  &  \tabularnewline
Midrange & 41963.5 &  &  \tabularnewline
Midmean - Weighted Average at Xnp & 41015.8888888889 &  &  \tabularnewline
Midmean - Weighted Average at X(n+1)p & 41261.5135135135 &  &  \tabularnewline
Midmean - Empirical Distribution Function & 41261.5135135135 &  &  \tabularnewline
Midmean - Empirical Distribution Function - Averaging & 41261.5135135135 &  &  \tabularnewline
Midmean - Empirical Distribution Function - Interpolation & 41212.0857142857 &  &  \tabularnewline
Midmean - Closest Observation & 41015.8888888889 &  &  \tabularnewline
Midmean - True Basic - Statistics Graphics Toolkit & 41261.5135135135 &  &  \tabularnewline
Midmean - MS Excel (old versions) & 41261.5135135135 &  &  \tabularnewline
Number of observations & 71 &  &  \tabularnewline
\hline
\end{tabular}
%Source: https://freestatistics.org/blog/index.php?pk=10244&T=1

[TABLE]
[ROW][C]Central Tendency - Ungrouped Data[/C][/ROW]
[ROW][C]Measure[/C][C]Value[/C][C]S.E.[/C][C]Value/S.E.[/C][/ROW]
[ROW][C]Arithmetic Mean[/C][C]41487.6056338028[/C][C]1232.24187431382[/C][C]33.6683945730261[/C][/ROW]
[ROW][C]Geometric Mean[/C][C]40122.713537077[/C][C][/C][C][/C][/ROW]
[ROW][C]Harmonic Mean[/C][C]38657.5977773246[/C][C][/C][C][/C][/ROW]
[ROW][C]Quadratic Mean[/C][C]42749.3955957604[/C][C][/C][C][/C][/ROW]
[ROW][C]Winsorized Mean ( 1 / 23 )[/C][C]41466.6197183099[/C][C]1208.15030801095[/C][C]34.3224013132759[/C][/ROW]
[ROW][C]Winsorized Mean ( 2 / 23 )[/C][C]41424.2535211268[/C][C]1195.35842813678[/C][C]34.6542531060707[/C][/ROW]
[ROW][C]Winsorized Mean ( 3 / 23 )[/C][C]41538.8873239437[/C][C]1148.03125462213[/C][C]36.182714674973[/C][/ROW]
[ROW][C]Winsorized Mean ( 4 / 23 )[/C][C]41493.1971830986[/C][C]1108.92011614536[/C][C]37.4176611813394[/C][/ROW]
[ROW][C]Winsorized Mean ( 5 / 23 )[/C][C]41475.0281690141[/C][C]1104.44776808289[/C][C]37.5527293979750[/C][/ROW]
[ROW][C]Winsorized Mean ( 6 / 23 )[/C][C]41467.5915492958[/C][C]1068.72150844204[/C][C]38.8011200502051[/C][/ROW]
[ROW][C]Winsorized Mean ( 7 / 23 )[/C][C]41493.6197183099[/C][C]1020.84781437153[/C][C]40.6462345651932[/C][/ROW]
[ROW][C]Winsorized Mean ( 8 / 23 )[/C][C]41570.1267605634[/C][C]1000.48072729361[/C][C]41.5501524682183[/C][/ROW]
[ROW][C]Winsorized Mean ( 9 / 23 )[/C][C]41573.4225352113[/C][C]983.644481845335[/C][C]42.2646833307282[/C][/ROW]
[ROW][C]Winsorized Mean ( 10 / 23 )[/C][C]41649.6197183099[/C][C]942.466521960636[/C][C]44.1921476761478[/C][/ROW]
[ROW][C]Winsorized Mean ( 11 / 23 )[/C][C]41700.1267605634[/C][C]929.374488140853[/C][C]44.8690245887656[/C][/ROW]
[ROW][C]Winsorized Mean ( 12 / 23 )[/C][C]41698.7746478873[/C][C]885.750094699648[/C][C]47.0773583851855[/C][/ROW]
[ROW][C]Winsorized Mean ( 13 / 23 )[/C][C]41767.9859154930[/C][C]868.844826764339[/C][C]48.0730098503791[/C][/ROW]
[ROW][C]Winsorized Mean ( 14 / 23 )[/C][C]41734.2676056338[/C][C]856.11734348628[/C][C]48.7483029320298[/C][/ROW]
[ROW][C]Winsorized Mean ( 15 / 23 )[/C][C]41678.0704225352[/C][C]827.348284115554[/C][C]50.375484209881[/C][/ROW]
[ROW][C]Winsorized Mean ( 16 / 23 )[/C][C]41696.323943662[/C][C]820.982636629878[/C][C]50.7883140072545[/C][/ROW]
[ROW][C]Winsorized Mean ( 17 / 23 )[/C][C]41675.7323943662[/C][C]796.680963074082[/C][C]52.3116960565441[/C][/ROW]
[ROW][C]Winsorized Mean ( 18 / 23 )[/C][C]41629.338028169[/C][C]765.539546700784[/C][C]54.3790823185783[/C][/ROW]
[ROW][C]Winsorized Mean ( 19 / 23 )[/C][C]41636.2957746479[/C][C]738.099389793153[/C][C]56.4101479426994[/C][/ROW]
[ROW][C]Winsorized Mean ( 20 / 23 )[/C][C]41543.0563380282[/C][C]699.064346766771[/C][C]59.4266558295644[/C][/ROW]
[ROW][C]Winsorized Mean ( 21 / 23 )[/C][C]41574.1126760563[/C][C]694.400715394911[/C][C]59.8704922883221[/C][/ROW]
[ROW][C]Winsorized Mean ( 22 / 23 )[/C][C]41487.9718309859[/C][C]666.702697844105[/C][C]62.228594492184[/C][/ROW]
[ROW][C]Winsorized Mean ( 23 / 23 )[/C][C]41334.0985915493[/C][C]631.517542193852[/C][C]65.4520196667178[/C][/ROW]
[ROW][C]Trimmed Mean ( 1 / 23 )[/C][C]41473.8115942029[/C][C]1171.04695895736[/C][C]35.4160106705961[/C][/ROW]
[ROW][C]Trimmed Mean ( 2 / 23 )[/C][C]41481.4328358209[/C][C]1126.78854404313[/C][C]36.8138574492227[/C][/ROW]
[ROW][C]Trimmed Mean ( 3 / 23 )[/C][C]41512.6615384615[/C][C]1082.04910028224[/C][C]38.3648593466171[/C][/ROW]
[ROW][C]Trimmed Mean ( 4 / 23 )[/C][C]41502.8095238095[/C][C]1050.53277460817[/C][C]39.5064395199755[/C][/ROW]
[ROW][C]Trimmed Mean ( 5 / 23 )[/C][C]41505.6065573770[/C][C]1027.02700925921[/C][C]40.4133544523964[/C][/ROW]
[ROW][C]Trimmed Mean ( 6 / 23 )[/C][C]41512.9661016949[/C][C]999.72394055313[/C][C]41.5244293126825[/C][/ROW]
[ROW][C]Trimmed Mean ( 7 / 23 )[/C][C]41512.9661016949[/C][C]976.542877232831[/C][C]42.5101314745417[/C][/ROW]
[ROW][C]Trimmed Mean ( 8 / 23 )[/C][C]41527.6909090909[/C][C]960.313793718427[/C][C]43.2438763045272[/C][/ROW]
[ROW][C]Trimmed Mean ( 9 / 23 )[/C][C]41520.5849056604[/C][C]944.667117337675[/C][C]43.952609489231[/C][/ROW]
[ROW][C]Trimmed Mean ( 10 / 23 )[/C][C]41512.4117647059[/C][C]928.49934468452[/C][C]44.7091449254718[/C][/ROW]
[ROW][C]Trimmed Mean ( 11 / 23 )[/C][C]41492.5306122449[/C][C]916.731191035508[/C][C]45.2613928902935[/C][/ROW]
[ROW][C]Trimmed Mean ( 12 / 23 )[/C][C]41464.0212765957[/C][C]903.722160447228[/C][C]45.8813815698359[/C][/ROW]
[ROW][C]Trimmed Mean ( 13 / 23 )[/C][C]41433.1555555556[/C][C]895.435951584171[/C][C]46.27148986173[/C][/ROW]
[ROW][C]Trimmed Mean ( 14 / 23 )[/C][C]41433.1555555556[/C][C]886.84407359945[/C][C]46.7197749739591[/C][/ROW]
[ROW][C]Trimmed Mean ( 15 / 23 )[/C][C]41348.1219512195[/C][C]876.869869781507[/C][C]47.1542282112195[/C][/ROW]
[ROW][C]Trimmed Mean ( 16 / 23 )[/C][C]41308.0769230769[/C][C]868.432173785073[/C][C]47.5662673148498[/C][/ROW]
[ROW][C]Trimmed Mean ( 17 / 23 )[/C][C]41261.5135135135[/C][C]856.62393732748[/C][C]48.1675934042216[/C][/ROW]
[ROW][C]Trimmed Mean ( 18 / 23 )[/C][C]41212.0857142857[/C][C]844.44042570037[/C][C]48.8040179745123[/C][/ROW]
[ROW][C]Trimmed Mean ( 19 / 23 )[/C][C]41162.2121212121[/C][C]833.21398966362[/C][C]49.401729485879[/C][/ROW]
[ROW][C]Trimmed Mean ( 20 / 23 )[/C][C]41105.064516129[/C][C]821.918712375944[/C][C]50.011106812869[/C][/ROW]
[ROW][C]Trimmed Mean ( 21 / 23 )[/C][C]41051.4482758621[/C][C]813.57845832335[/C][C]50.4578849843963[/C][/ROW]
[ROW][C]Trimmed Mean ( 22 / 23 )[/C][C]40986[/C][C]798.776291650274[/C][C]51.3109871041901[/C][/ROW]
[ROW][C]Trimmed Mean ( 23 / 23 )[/C][C]40921.2[/C][C]782.01972268394[/C][C]52.3275805110847[/C][/ROW]
[ROW][C]Median[/C][C]40357[/C][C][/C][C][/C][/ROW]
[ROW][C]Midrange[/C][C]41963.5[/C][C][/C][C][/C][/ROW]
[ROW][C]Midmean - Weighted Average at Xnp[/C][C]41015.8888888889[/C][C][/C][C][/C][/ROW]
[ROW][C]Midmean - Weighted Average at X(n+1)p[/C][C]41261.5135135135[/C][C][/C][C][/C][/ROW]
[ROW][C]Midmean - Empirical Distribution Function[/C][C]41261.5135135135[/C][C][/C][C][/C][/ROW]
[ROW][C]Midmean - Empirical Distribution Function - Averaging[/C][C]41261.5135135135[/C][C][/C][C][/C][/ROW]
[ROW][C]Midmean - Empirical Distribution Function - Interpolation[/C][C]41212.0857142857[/C][C][/C][C][/C][/ROW]
[ROW][C]Midmean - Closest Observation[/C][C]41015.8888888889[/C][C][/C][C][/C][/ROW]
[ROW][C]Midmean - True Basic - Statistics Graphics Toolkit[/C][C]41261.5135135135[/C][C][/C][C][/C][/ROW]
[ROW][C]Midmean - MS Excel (old versions)[/C][C]41261.5135135135[/C][C][/C][C][/C][/ROW]
[ROW][C]Number of observations[/C][C]71[/C][C][/C][C][/C][/ROW]
[/TABLE]
Source: https://freestatistics.org/blog/index.php?pk=10244&T=1

Globally Unique Identifier (entire table): ba.freestatistics.org/blog/index.php?pk=10244&T=1

As an alternative you can also use a QR Code:  

The GUIDs for individual cells are displayed in the table below:

Central Tendency - Ungrouped Data
MeasureValueS.E.Value/S.E.
Arithmetic Mean41487.60563380281232.2418743138233.6683945730261
Geometric Mean40122.713537077
Harmonic Mean38657.5977773246
Quadratic Mean42749.3955957604
Winsorized Mean ( 1 / 23 )41466.61971830991208.1503080109534.3224013132759
Winsorized Mean ( 2 / 23 )41424.25352112681195.3584281367834.6542531060707
Winsorized Mean ( 3 / 23 )41538.88732394371148.0312546221336.182714674973
Winsorized Mean ( 4 / 23 )41493.19718309861108.9201161453637.4176611813394
Winsorized Mean ( 5 / 23 )41475.02816901411104.4477680828937.5527293979750
Winsorized Mean ( 6 / 23 )41467.59154929581068.7215084420438.8011200502051
Winsorized Mean ( 7 / 23 )41493.61971830991020.8478143715340.6462345651932
Winsorized Mean ( 8 / 23 )41570.12676056341000.4807272936141.5501524682183
Winsorized Mean ( 9 / 23 )41573.4225352113983.64448184533542.2646833307282
Winsorized Mean ( 10 / 23 )41649.6197183099942.46652196063644.1921476761478
Winsorized Mean ( 11 / 23 )41700.1267605634929.37448814085344.8690245887656
Winsorized Mean ( 12 / 23 )41698.7746478873885.75009469964847.0773583851855
Winsorized Mean ( 13 / 23 )41767.9859154930868.84482676433948.0730098503791
Winsorized Mean ( 14 / 23 )41734.2676056338856.1173434862848.7483029320298
Winsorized Mean ( 15 / 23 )41678.0704225352827.34828411555450.375484209881
Winsorized Mean ( 16 / 23 )41696.323943662820.98263662987850.7883140072545
Winsorized Mean ( 17 / 23 )41675.7323943662796.68096307408252.3116960565441
Winsorized Mean ( 18 / 23 )41629.338028169765.53954670078454.3790823185783
Winsorized Mean ( 19 / 23 )41636.2957746479738.09938979315356.4101479426994
Winsorized Mean ( 20 / 23 )41543.0563380282699.06434676677159.4266558295644
Winsorized Mean ( 21 / 23 )41574.1126760563694.40071539491159.8704922883221
Winsorized Mean ( 22 / 23 )41487.9718309859666.70269784410562.228594492184
Winsorized Mean ( 23 / 23 )41334.0985915493631.51754219385265.4520196667178
Trimmed Mean ( 1 / 23 )41473.81159420291171.0469589573635.4160106705961
Trimmed Mean ( 2 / 23 )41481.43283582091126.7885440431336.8138574492227
Trimmed Mean ( 3 / 23 )41512.66153846151082.0491002822438.3648593466171
Trimmed Mean ( 4 / 23 )41502.80952380951050.5327746081739.5064395199755
Trimmed Mean ( 5 / 23 )41505.60655737701027.0270092592140.4133544523964
Trimmed Mean ( 6 / 23 )41512.9661016949999.7239405531341.5244293126825
Trimmed Mean ( 7 / 23 )41512.9661016949976.54287723283142.5101314745417
Trimmed Mean ( 8 / 23 )41527.6909090909960.31379371842743.2438763045272
Trimmed Mean ( 9 / 23 )41520.5849056604944.66711733767543.952609489231
Trimmed Mean ( 10 / 23 )41512.4117647059928.4993446845244.7091449254718
Trimmed Mean ( 11 / 23 )41492.5306122449916.73119103550845.2613928902935
Trimmed Mean ( 12 / 23 )41464.0212765957903.72216044722845.8813815698359
Trimmed Mean ( 13 / 23 )41433.1555555556895.43595158417146.27148986173
Trimmed Mean ( 14 / 23 )41433.1555555556886.8440735994546.7197749739591
Trimmed Mean ( 15 / 23 )41348.1219512195876.86986978150747.1542282112195
Trimmed Mean ( 16 / 23 )41308.0769230769868.43217378507347.5662673148498
Trimmed Mean ( 17 / 23 )41261.5135135135856.6239373274848.1675934042216
Trimmed Mean ( 18 / 23 )41212.0857142857844.4404257003748.8040179745123
Trimmed Mean ( 19 / 23 )41162.2121212121833.2139896636249.401729485879
Trimmed Mean ( 20 / 23 )41105.064516129821.91871237594450.011106812869
Trimmed Mean ( 21 / 23 )41051.4482758621813.5784583233550.4578849843963
Trimmed Mean ( 22 / 23 )40986798.77629165027451.3109871041901
Trimmed Mean ( 23 / 23 )40921.2782.0197226839452.3275805110847
Median40357
Midrange41963.5
Midmean - Weighted Average at Xnp41015.8888888889
Midmean - Weighted Average at X(n+1)p41261.5135135135
Midmean - Empirical Distribution Function41261.5135135135
Midmean - Empirical Distribution Function - Averaging41261.5135135135
Midmean - Empirical Distribution Function - Interpolation41212.0857142857
Midmean - Closest Observation41015.8888888889
Midmean - True Basic - Statistics Graphics Toolkit41261.5135135135
Midmean - MS Excel (old versions)41261.5135135135
Number of observations71


Parameters (Session):
Parameters (R input):
R code (references can be found in the software module):
geomean <- function(x) {
return(exp(mean(log(x))))
}
harmean <- function(x) {
return(1/mean(1/x))
}
quamean <- function(x) {
return(sqrt(mean(x*x)))
}
winmean <- function(x) {
x <-sort(x[!is.na(x)])
n<-length(x)
denom <- 3
nodenom <- n/denom
if (nodenom>40) denom <- n/40
sqrtn = sqrt(n)
roundnodenom = floor(nodenom)
win <- array(NA,dim=c(roundnodenom,2))
for (j in 1:roundnodenom) {
win[j,1] <- (j*x[j+1]+sum(x[(j+1):(n-j)])+j*x[n-j])/n
win[j,2] <- sd(c(rep(x[j+1],j),x[(j+1):(n-j)],rep(x[n-j],j)))/sqrtn
}
return(win)
}
trimean <- function(x) {
x <-sort(x[!is.na(x)])
n<-length(x)
denom <- 3
nodenom <- n/denom
if (nodenom>40) denom <- n/40
sqrtn = sqrt(n)
roundnodenom = floor(nodenom)
tri <- array(NA,dim=c(roundnodenom,2))
for (j in 1:roundnodenom) {
tri[j,1] <- mean(x,trim=j/n)
tri[j,2] <- sd(x[(j+1):(n-j)]) / sqrt(n-j*2)
}
return(tri)
}
midrange <- function(x) {
return((max(x)+min(x))/2)
}
q1 <- function(data,n,p,i,f) {
np <- n*p;
i <<- floor(np)
f <<- np - i
qvalue <- (1-f)*data[i] + f*data[i+1]
}
q2 <- function(data,n,p,i,f) {
np <- (n+1)*p
i <<- floor(np)
f <<- np - i
qvalue <- (1-f)*data[i] + f*data[i+1]
}
q3 <- function(data,n,p,i,f) {
np <- n*p
i <<- floor(np)
f <<- np - i
if (f==0) {
qvalue <- data[i]
} else {
qvalue <- data[i+1]
}
}
q4 <- function(data,n,p,i,f) {
np <- n*p
i <<- floor(np)
f <<- np - i
if (f==0) {
qvalue <- (data[i]+data[i+1])/2
} else {
qvalue <- data[i+1]
}
}
q5 <- function(data,n,p,i,f) {
np <- (n-1)*p
i <<- floor(np)
f <<- np - i
if (f==0) {
qvalue <- data[i+1]
} else {
qvalue <- data[i+1] + f*(data[i+2]-data[i+1])
}
}
q6 <- function(data,n,p,i,f) {
np <- n*p+0.5
i <<- floor(np)
f <<- np - i
qvalue <- data[i]
}
q7 <- function(data,n,p,i,f) {
np <- (n+1)*p
i <<- floor(np)
f <<- np - i
if (f==0) {
qvalue <- data[i]
} else {
qvalue <- f*data[i] + (1-f)*data[i+1]
}
}
q8 <- function(data,n,p,i,f) {
np <- (n+1)*p
i <<- floor(np)
f <<- np - i
if (f==0) {
qvalue <- data[i]
} else {
if (f == 0.5) {
qvalue <- (data[i]+data[i+1])/2
} else {
if (f < 0.5) {
qvalue <- data[i]
} else {
qvalue <- data[i+1]
}
}
}
}
midmean <- function(x,def) {
x <-sort(x[!is.na(x)])
n<-length(x)
if (def==1) {
qvalue1 <- q1(x,n,0.25,i,f)
qvalue3 <- q1(x,n,0.75,i,f)
}
if (def==2) {
qvalue1 <- q2(x,n,0.25,i,f)
qvalue3 <- q2(x,n,0.75,i,f)
}
if (def==3) {
qvalue1 <- q3(x,n,0.25,i,f)
qvalue3 <- q3(x,n,0.75,i,f)
}
if (def==4) {
qvalue1 <- q4(x,n,0.25,i,f)
qvalue3 <- q4(x,n,0.75,i,f)
}
if (def==5) {
qvalue1 <- q5(x,n,0.25,i,f)
qvalue3 <- q5(x,n,0.75,i,f)
}
if (def==6) {
qvalue1 <- q6(x,n,0.25,i,f)
qvalue3 <- q6(x,n,0.75,i,f)
}
if (def==7) {
qvalue1 <- q7(x,n,0.25,i,f)
qvalue3 <- q7(x,n,0.75,i,f)
}
if (def==8) {
qvalue1 <- q8(x,n,0.25,i,f)
qvalue3 <- q8(x,n,0.75,i,f)
}
midm <- 0
myn <- 0
roundno4 <- round(n/4)
round3no4 <- round(3*n/4)
for (i in 1:n) {
if ((x[i]>=qvalue1) & (x[i]<=qvalue3)){
midm = midm + x[i]
myn = myn + 1
}
}
midm = midm / myn
return(midm)
}
(arm <- mean(x))
sqrtn <- sqrt(length(x))
(armse <- sd(x) / sqrtn)
(armose <- arm / armse)
(geo <- geomean(x))
(har <- harmean(x))
(qua <- quamean(x))
(win <- winmean(x))
(tri <- trimean(x))
(midr <- midrange(x))
midm <- array(NA,dim=8)
for (j in 1:8) midm[j] <- midmean(x,j)
midm
bitmap(file='test1.png')
lb <- win[,1] - 2*win[,2]
ub <- win[,1] + 2*win[,2]
if ((ylimmin == '') | (ylimmax == '')) plot(win[,1],type='b',main=main, xlab='j', pch=19, ylab='Winsorized Mean(j/n)', ylim=c(min(lb),max(ub))) else plot(win[,1],type='l',main=main, xlab='j', pch=19, ylab='Winsorized Mean(j/n)', ylim=c(ylimmin,ylimmax))
lines(ub,lty=3)
lines(lb,lty=3)
grid()
dev.off()
bitmap(file='test2.png')
lb <- tri[,1] - 2*tri[,2]
ub <- tri[,1] + 2*tri[,2]
if ((ylimmin == '') | (ylimmax == '')) plot(tri[,1],type='b',main=main, xlab='j', pch=19, ylab='Trimmed Mean(j/n)', ylim=c(min(lb),max(ub))) else plot(tri[,1],type='l',main=main, xlab='j', pch=19, ylab='Trimmed Mean(j/n)', ylim=c(ylimmin,ylimmax))
lines(ub,lty=3)
lines(lb,lty=3)
grid()
dev.off()
load(file='createtable')
a<-table.start()
a<-table.row.start(a)
a<-table.element(a,'Central Tendency - Ungrouped Data',4,TRUE)
a<-table.row.end(a)
a<-table.row.start(a)
a<-table.element(a,'Measure',header=TRUE)
a<-table.element(a,'Value',header=TRUE)
a<-table.element(a,'S.E.',header=TRUE)
a<-table.element(a,'Value/S.E.',header=TRUE)
a<-table.row.end(a)
a<-table.row.start(a)
a<-table.element(a,hyperlink('arithmetic_mean.htm', 'Arithmetic Mean', 'click to view the definition of the Arithmetic Mean'),header=TRUE)
a<-table.element(a,arm)
a<-table.element(a,hyperlink('arithmetic_mean_standard_error.htm', armse, 'click to view the definition of the Standard Error of the Arithmetic Mean'))
a<-table.element(a,armose)
a<-table.row.end(a)
a<-table.row.start(a)
a<-table.element(a,hyperlink('geometric_mean.htm', 'Geometric Mean', 'click to view the definition of the Geometric Mean'),header=TRUE)
a<-table.element(a,geo)
a<-table.element(a,'')
a<-table.row.end(a)
a<-table.row.start(a)
a<-table.element(a,hyperlink('harmonic_mean.htm', 'Harmonic Mean', 'click to view the definition of the Harmonic Mean'),header=TRUE)
a<-table.element(a,har)
a<-table.element(a,'')
a<-table.row.end(a)
a<-table.row.start(a)
a<-table.element(a,hyperlink('quadratic_mean.htm', 'Quadratic Mean', 'click to view the definition of the Quadratic Mean'),header=TRUE)
a<-table.element(a,qua)
a<-table.element(a,'')
a<-table.row.end(a)
for (j in 1:length(win[,1])) {
a<-table.row.start(a)
mylabel <- paste('Winsorized Mean (',j)
mylabel <- paste(mylabel,'/')
mylabel <- paste(mylabel,length(win[,1]))
mylabel <- paste(mylabel,')')
a<-table.element(a,hyperlink('winsorized_mean.htm', mylabel, 'click to view the definition of the Winsorized Mean'),header=TRUE)
a<-table.element(a,win[j,1])
a<-table.element(a,win[j,2])
a<-table.element(a,win[j,1]/win[j,2])
a<-table.row.end(a)
}
for (j in 1:length(tri[,1])) {
a<-table.row.start(a)
mylabel <- paste('Trimmed Mean (',j)
mylabel <- paste(mylabel,'/')
mylabel <- paste(mylabel,length(tri[,1]))
mylabel <- paste(mylabel,')')
a<-table.element(a,hyperlink('arithmetic_mean.htm', mylabel, 'click to view the definition of the Trimmed Mean'),header=TRUE)
a<-table.element(a,tri[j,1])
a<-table.element(a,tri[j,2])
a<-table.element(a,tri[j,1]/tri[j,2])
a<-table.row.end(a)
}
a<-table.row.start(a)
a<-table.element(a,hyperlink('median_1.htm', 'Median', 'click to view the definition of the Median'),header=TRUE)
a<-table.element(a,median(x))
a<-table.element(a,'')
a<-table.row.end(a)
a<-table.row.start(a)
a<-table.element(a,hyperlink('midrange.htm', 'Midrange', 'click to view the definition of the Midrange'),header=TRUE)
a<-table.element(a,midr)
a<-table.element(a,'')
a<-table.row.end(a)
a<-table.row.start(a)
mymid <- hyperlink('midmean.htm', 'Midmean', 'click to view the definition of the Midmean')
mylabel <- paste(mymid,hyperlink('method_1.htm','Weighted Average at Xnp',''),sep=' - ')
a<-table.element(a,mylabel,header=TRUE)
a<-table.element(a,midm[1])
a<-table.element(a,'')
a<-table.row.end(a)
a<-table.row.start(a)
mymid <- hyperlink('midmean.htm', 'Midmean', 'click to view the definition of the Midmean')
mylabel <- paste(mymid,hyperlink('method_2.htm','Weighted Average at X(n+1)p',''),sep=' - ')
a<-table.element(a,mylabel,header=TRUE)
a<-table.element(a,midm[2])
a<-table.element(a,'')
a<-table.row.end(a)
a<-table.row.start(a)
mymid <- hyperlink('midmean.htm', 'Midmean', 'click to view the definition of the Midmean')
mylabel <- paste(mymid,hyperlink('method_3.htm','Empirical Distribution Function',''),sep=' - ')
a<-table.element(a,mylabel,header=TRUE)
a<-table.element(a,midm[3])
a<-table.element(a,'')
a<-table.row.end(a)
a<-table.row.start(a)
mymid <- hyperlink('midmean.htm', 'Midmean', 'click to view the definition of the Midmean')
mylabel <- paste(mymid,hyperlink('method_4.htm','Empirical Distribution Function - Averaging',''),sep=' - ')
a<-table.element(a,mylabel,header=TRUE)
a<-table.element(a,midm[4])
a<-table.element(a,'')
a<-table.row.end(a)
a<-table.row.start(a)
mymid <- hyperlink('midmean.htm', 'Midmean', 'click to view the definition of the Midmean')
mylabel <- paste(mymid,hyperlink('method_5.htm','Empirical Distribution Function - Interpolation',''),sep=' - ')
a<-table.element(a,mylabel,header=TRUE)
a<-table.element(a,midm[5])
a<-table.element(a,'')
a<-table.row.end(a)
a<-table.row.start(a)
mymid <- hyperlink('midmean.htm', 'Midmean', 'click to view the definition of the Midmean')
mylabel <- paste(mymid,hyperlink('method_6.htm','Closest Observation',''),sep=' - ')
a<-table.element(a,mylabel,header=TRUE)
a<-table.element(a,midm[6])
a<-table.element(a,'')
a<-table.row.end(a)
a<-table.row.start(a)
mymid <- hyperlink('midmean.htm', 'Midmean', 'click to view the definition of the Midmean')
mylabel <- paste(mymid,hyperlink('method_7.htm','True Basic - Statistics Graphics Toolkit',''),sep=' - ')
a<-table.element(a,mylabel,header=TRUE)
a<-table.element(a,midm[7])
a<-table.element(a,'')
a<-table.row.end(a)
a<-table.row.start(a)
mymid <- hyperlink('midmean.htm', 'Midmean', 'click to view the definition of the Midmean')
mylabel <- paste(mymid,hyperlink('method_8.htm','MS Excel (old versions)',''),sep=' - ')
a<-table.element(a,mylabel,header=TRUE)
a<-table.element(a,midm[8])
a<-table.element(a,'')
a<-table.row.end(a)
a<-table.row.start(a)
a<-table.element(a,'Number of observations',header=TRUE)
a<-table.element(a,length(x))
a<-table.element(a,'')
a<-table.row.end(a)
a<-table.end(a)
table.save(a,file='mytable.tab')