Free Statistics

of Irreproducible Research!

Author's title

Author*Unverified author*
R Software Modulerwasp_centraltendency.wasp
Title produced by softwareCentral Tendency
Date of computationSat, 19 Apr 2008 05:44:40 -0600
Cite this page as followsStatistical Computations at FreeStatistics.org, Office for Research Development and Education, URL https://freestatistics.org/blog/index.php?v=date/2008/Apr/19/t1208605532x5mn018pyk93hrg.htm/, Retrieved Tue, 14 May 2024 18:17:07 +0000
Statistical Computations at FreeStatistics.org, Office for Research Development and Education, URL https://freestatistics.org/blog/index.php?pk=10245, Retrieved Tue, 14 May 2024 18:17:07 +0000
QR Codes:

Original text written by user:
IsPrivate?No (this computation is public)
User-defined keywords
Estimated Impact220
Family? (F = Feedback message, R = changed R code, M = changed R Module, P = changed Parameters, D = changed Data)
-       [Central Tendency] [centrummaten room...] [2008-04-19 11:44:40] [d41d8cd98f00b204e9800998ecf8427e] [Current]
Feedback Forum

Post a new message
Dataseries X:
2,6900
2,7200
2,6800
2,7200
2,7000
2,7200
2,7200
2,7100
2,6800
2,6500
2,6600
2,6900
2,6700
2,6700
2,6500
2,6600
2,7600
2,7900
2,7900
2,7800
2,8100
2,8100
2,7900
2,7900
2,7900
2,8000
2,8000
2,8000
2,7700
2,7800
2,7500
2,7400
2,7400
2,7200
2,7100
2,7100
2,7000
2,6900
2,7000
2,7100
2,7600
2,7600
2,7500
2,7400
2,7100
2,7300
2,7300
2,7300
2,7200
2,7200
2,7500
2,8200
2,8500
2,8300
2,8500
2,8500
2,7900
2,8100
2,8000
2,7900
2,7900
2,8000
2,8000
2,8600
2,8600
2,8500
2,8100
2,7900
2,7800
2,7700
2,7800
2,8500
2,8200


Summary of compuational transaction
Raw Inputview raw input (R code)
Raw Outputview raw output of R engine
Computing time11 seconds
R Server'George Udny Yule' @ 72.249.76.132

\begin{tabular}{lllllllll}
\hline
Summary of compuational transaction \tabularnewline
Raw Input & view raw input (R code)  \tabularnewline
Raw Output & view raw output of R engine  \tabularnewline
Computing time & 11 seconds \tabularnewline
R Server & 'George Udny Yule' @ 72.249.76.132 \tabularnewline
\hline
\end{tabular}
%Source: https://freestatistics.org/blog/index.php?pk=10245&T=0

[TABLE]
[ROW][C]Summary of compuational transaction[/C][/ROW]
[ROW][C]Raw Input[/C][C]view raw input (R code) [/C][/ROW]
[ROW][C]Raw Output[/C][C]view raw output of R engine [/C][/ROW]
[ROW][C]Computing time[/C][C]11 seconds[/C][/ROW]
[ROW][C]R Server[/C][C]'George Udny Yule' @ 72.249.76.132[/C][/ROW]
[/TABLE]
Source: https://freestatistics.org/blog/index.php?pk=10245&T=0

Globally Unique Identifier (entire table): ba.freestatistics.org/blog/index.php?pk=10245&T=0

As an alternative you can also use a QR Code:  

The GUIDs for individual cells are displayed in the table below:

Summary of compuational transaction
Raw Inputview raw input (R code)
Raw Outputview raw output of R engine
Computing time11 seconds
R Server'George Udny Yule' @ 72.249.76.132


Central Tendency - Ungrouped Data
MeasureValueS.E.Value/S.E.
Arithmetic Mean2.757123287671230.0065876581137532418.528593934637
Geometric Mean2.75655619168462
Harmonic Mean2.75598869082038
Quadratic Mean2.75768987100753
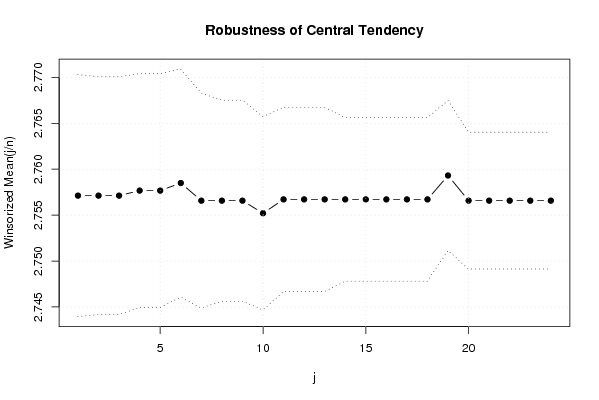
Winsorized Mean ( 1 / 24 )2.757123287671230.0065876581137532418.528593934637
Winsorized Mean ( 2 / 24 )2.757123287671230.00647110264240011426.066999711293
Winsorized Mean ( 3 / 24 )2.757123287671230.00647110264240011426.066999711293
Winsorized Mean ( 4 / 24 )2.757671232876710.0063615107022595433.493137392229
Winsorized Mean ( 5 / 24 )2.757671232876710.0063615107022595433.493137392229
Winsorized Mean ( 6 / 24 )2.758493150684930.00621063319809953444.156507508612
Winsorized Mean ( 7 / 24 )2.756575342465750.0058462647862868471.510518807097
Winsorized Mean ( 8 / 24 )2.756575342465750.00546964495271486503.977016112815
Winsorized Mean ( 9 / 24 )2.756575342465750.00546964495271486503.977016112815
Winsorized Mean ( 10 / 24 )2.755205479452050.00526001830619176523.80150012193
Winsorized Mean ( 11 / 24 )2.756712328767120.00501161054737492550.065154246889
Winsorized Mean ( 12 / 24 )2.756712328767120.00501161054737492550.065154246889
Winsorized Mean ( 13 / 24 )2.756712328767120.00501161054737492550.065154246889
Winsorized Mean ( 14 / 24 )2.756712328767120.00444848235078966619.697261084507
Winsorized Mean ( 15 / 24 )2.756712328767120.00444848235078966619.697261084507
Winsorized Mean ( 16 / 24 )2.756712328767120.00444848235078966619.697261084507
Winsorized Mean ( 17 / 24 )2.756712328767120.00444848235078966619.697261084507
Winsorized Mean ( 18 / 24 )2.756712328767120.00444848235078966619.697261084507
Winsorized Mean ( 19 / 24 )2.759315068493150.00408401479321209675.637873075122
Winsorized Mean ( 20 / 24 )2.756575342465750.00372279159343909740.459215424211
Winsorized Mean ( 21 / 24 )2.756575342465750.00372279159343909740.45921542421
Winsorized Mean ( 22 / 24 )2.756575342465750.00372279159343909740.459215424211
Winsorized Mean ( 23 / 24 )2.756575342465750.00372279159343909740.459215424211
Winsorized Mean ( 24 / 24 )2.756575342465750.00372279159343909740.45921542421
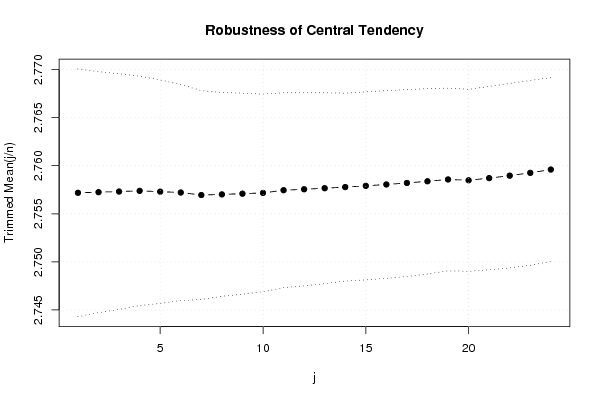
Trimmed Mean ( 1 / 24 )2.757183098591550.00643863807846775428.224581812136
Trimmed Mean ( 2 / 24 )2.757246376811590.00626184830214189440.324684305825
Trimmed Mean ( 3 / 24 )2.757313432835820.00612541210292627450.143335093908
Trimmed Mean ( 4 / 24 )2.757384615384620.00596172456285206462.514593942511
Trimmed Mean ( 5 / 24 )2.757301587301590.00580537010258388474.957072258727
Trimmed Mean ( 6 / 24 )2.75721311475410.0056158010272002490.974146234794
Trimmed Mean ( 7 / 24 )2.756949152542370.00542874913767196507.842429743337
Trimmed Mean ( 8 / 24 )2.757017543859650.0052979219473246520.396029098148
Trimmed Mean ( 9 / 24 )2.757090909090910.00522666516744416527.504789528946
Trimmed Mean ( 10 / 24 )2.757169811320750.00513516405823375536.919518062893
Trimmed Mean ( 11 / 24 )2.757450980392160.00506307770660588544.619525944558
Trimmed Mean ( 12 / 24 )2.757551020408160.00502147270390497549.15184907084
Trimmed Mean ( 13 / 24 )2.757659574468080.00496251225093216555.698290508015
Trimmed Mean ( 14 / 24 )2.757777777777780.00488130725255306564.967053925029
Trimmed Mean ( 15 / 24 )2.757906976744190.00488582984577086564.470532908838
Trimmed Mean ( 16 / 24 )2.758048780487800.00487926814028199565.258702984175
Trimmed Mean ( 17 / 24 )2.758205128205130.00485792471188212567.774366996418
Trimmed Mean ( 18 / 24 )2.758378378378380.00481666142201019572.674335333954
Trimmed Mean ( 19 / 24 )2.758571428571430.0047481594336335580.977001115662
Trimmed Mean ( 20 / 24 )2.758484848484850.00472984584205695583.208193374273
Trimmed Mean ( 21 / 24 )2.758709677419350.00476866870094023578.507304748477
Trimmed Mean ( 22 / 24 )2.758965517241380.00479492824178769575.392451798769
Trimmed Mean ( 23 / 24 )2.759259259259260.00480164756642088574.648434957086
Trimmed Mean ( 24 / 24 )2.75960.0047777260979117577.596945376629
Median2.76
Midrange2.755
Midmean - Weighted Average at Xnp2.75777777777778
Midmean - Weighted Average at X(n+1)p2.75777777777778
Midmean - Empirical Distribution Function2.75777777777778
Midmean - Empirical Distribution Function - Averaging2.75777777777778
Midmean - Empirical Distribution Function - Interpolation2.75777777777778
Midmean - Closest Observation2.75777777777778
Midmean - True Basic - Statistics Graphics Toolkit2.75777777777778
Midmean - MS Excel (old versions)2.75777777777778
Number of observations73

\begin{tabular}{lllllllll}
\hline
Central Tendency - Ungrouped Data \tabularnewline
Measure & Value & S.E. & Value/S.E. \tabularnewline
Arithmetic Mean & 2.75712328767123 & 0.0065876581137532 & 418.528593934637 \tabularnewline
Geometric Mean & 2.75655619168462 &  &  \tabularnewline
Harmonic Mean & 2.75598869082038 &  &  \tabularnewline
Quadratic Mean & 2.75768987100753 &  &  \tabularnewline
Winsorized Mean ( 1 / 24 ) & 2.75712328767123 & 0.0065876581137532 & 418.528593934637 \tabularnewline
Winsorized Mean ( 2 / 24 ) & 2.75712328767123 & 0.00647110264240011 & 426.066999711293 \tabularnewline
Winsorized Mean ( 3 / 24 ) & 2.75712328767123 & 0.00647110264240011 & 426.066999711293 \tabularnewline
Winsorized Mean ( 4 / 24 ) & 2.75767123287671 & 0.0063615107022595 & 433.493137392229 \tabularnewline
Winsorized Mean ( 5 / 24 ) & 2.75767123287671 & 0.0063615107022595 & 433.493137392229 \tabularnewline
Winsorized Mean ( 6 / 24 ) & 2.75849315068493 & 0.00621063319809953 & 444.156507508612 \tabularnewline
Winsorized Mean ( 7 / 24 ) & 2.75657534246575 & 0.0058462647862868 & 471.510518807097 \tabularnewline
Winsorized Mean ( 8 / 24 ) & 2.75657534246575 & 0.00546964495271486 & 503.977016112815 \tabularnewline
Winsorized Mean ( 9 / 24 ) & 2.75657534246575 & 0.00546964495271486 & 503.977016112815 \tabularnewline
Winsorized Mean ( 10 / 24 ) & 2.75520547945205 & 0.00526001830619176 & 523.80150012193 \tabularnewline
Winsorized Mean ( 11 / 24 ) & 2.75671232876712 & 0.00501161054737492 & 550.065154246889 \tabularnewline
Winsorized Mean ( 12 / 24 ) & 2.75671232876712 & 0.00501161054737492 & 550.065154246889 \tabularnewline
Winsorized Mean ( 13 / 24 ) & 2.75671232876712 & 0.00501161054737492 & 550.065154246889 \tabularnewline
Winsorized Mean ( 14 / 24 ) & 2.75671232876712 & 0.00444848235078966 & 619.697261084507 \tabularnewline
Winsorized Mean ( 15 / 24 ) & 2.75671232876712 & 0.00444848235078966 & 619.697261084507 \tabularnewline
Winsorized Mean ( 16 / 24 ) & 2.75671232876712 & 0.00444848235078966 & 619.697261084507 \tabularnewline
Winsorized Mean ( 17 / 24 ) & 2.75671232876712 & 0.00444848235078966 & 619.697261084507 \tabularnewline
Winsorized Mean ( 18 / 24 ) & 2.75671232876712 & 0.00444848235078966 & 619.697261084507 \tabularnewline
Winsorized Mean ( 19 / 24 ) & 2.75931506849315 & 0.00408401479321209 & 675.637873075122 \tabularnewline
Winsorized Mean ( 20 / 24 ) & 2.75657534246575 & 0.00372279159343909 & 740.459215424211 \tabularnewline
Winsorized Mean ( 21 / 24 ) & 2.75657534246575 & 0.00372279159343909 & 740.45921542421 \tabularnewline
Winsorized Mean ( 22 / 24 ) & 2.75657534246575 & 0.00372279159343909 & 740.459215424211 \tabularnewline
Winsorized Mean ( 23 / 24 ) & 2.75657534246575 & 0.00372279159343909 & 740.459215424211 \tabularnewline
Winsorized Mean ( 24 / 24 ) & 2.75657534246575 & 0.00372279159343909 & 740.45921542421 \tabularnewline
Trimmed Mean ( 1 / 24 ) & 2.75718309859155 & 0.00643863807846775 & 428.224581812136 \tabularnewline
Trimmed Mean ( 2 / 24 ) & 2.75724637681159 & 0.00626184830214189 & 440.324684305825 \tabularnewline
Trimmed Mean ( 3 / 24 ) & 2.75731343283582 & 0.00612541210292627 & 450.143335093908 \tabularnewline
Trimmed Mean ( 4 / 24 ) & 2.75738461538462 & 0.00596172456285206 & 462.514593942511 \tabularnewline
Trimmed Mean ( 5 / 24 ) & 2.75730158730159 & 0.00580537010258388 & 474.957072258727 \tabularnewline
Trimmed Mean ( 6 / 24 ) & 2.7572131147541 & 0.0056158010272002 & 490.974146234794 \tabularnewline
Trimmed Mean ( 7 / 24 ) & 2.75694915254237 & 0.00542874913767196 & 507.842429743337 \tabularnewline
Trimmed Mean ( 8 / 24 ) & 2.75701754385965 & 0.0052979219473246 & 520.396029098148 \tabularnewline
Trimmed Mean ( 9 / 24 ) & 2.75709090909091 & 0.00522666516744416 & 527.504789528946 \tabularnewline
Trimmed Mean ( 10 / 24 ) & 2.75716981132075 & 0.00513516405823375 & 536.919518062893 \tabularnewline
Trimmed Mean ( 11 / 24 ) & 2.75745098039216 & 0.00506307770660588 & 544.619525944558 \tabularnewline
Trimmed Mean ( 12 / 24 ) & 2.75755102040816 & 0.00502147270390497 & 549.15184907084 \tabularnewline
Trimmed Mean ( 13 / 24 ) & 2.75765957446808 & 0.00496251225093216 & 555.698290508015 \tabularnewline
Trimmed Mean ( 14 / 24 ) & 2.75777777777778 & 0.00488130725255306 & 564.967053925029 \tabularnewline
Trimmed Mean ( 15 / 24 ) & 2.75790697674419 & 0.00488582984577086 & 564.470532908838 \tabularnewline
Trimmed Mean ( 16 / 24 ) & 2.75804878048780 & 0.00487926814028199 & 565.258702984175 \tabularnewline
Trimmed Mean ( 17 / 24 ) & 2.75820512820513 & 0.00485792471188212 & 567.774366996418 \tabularnewline
Trimmed Mean ( 18 / 24 ) & 2.75837837837838 & 0.00481666142201019 & 572.674335333954 \tabularnewline
Trimmed Mean ( 19 / 24 ) & 2.75857142857143 & 0.0047481594336335 & 580.977001115662 \tabularnewline
Trimmed Mean ( 20 / 24 ) & 2.75848484848485 & 0.00472984584205695 & 583.208193374273 \tabularnewline
Trimmed Mean ( 21 / 24 ) & 2.75870967741935 & 0.00476866870094023 & 578.507304748477 \tabularnewline
Trimmed Mean ( 22 / 24 ) & 2.75896551724138 & 0.00479492824178769 & 575.392451798769 \tabularnewline
Trimmed Mean ( 23 / 24 ) & 2.75925925925926 & 0.00480164756642088 & 574.648434957086 \tabularnewline
Trimmed Mean ( 24 / 24 ) & 2.7596 & 0.0047777260979117 & 577.596945376629 \tabularnewline
Median & 2.76 &  &  \tabularnewline
Midrange & 2.755 &  &  \tabularnewline
Midmean - Weighted Average at Xnp & 2.75777777777778 &  &  \tabularnewline
Midmean - Weighted Average at X(n+1)p & 2.75777777777778 &  &  \tabularnewline
Midmean - Empirical Distribution Function & 2.75777777777778 &  &  \tabularnewline
Midmean - Empirical Distribution Function - Averaging & 2.75777777777778 &  &  \tabularnewline
Midmean - Empirical Distribution Function - Interpolation & 2.75777777777778 &  &  \tabularnewline
Midmean - Closest Observation & 2.75777777777778 &  &  \tabularnewline
Midmean - True Basic - Statistics Graphics Toolkit & 2.75777777777778 &  &  \tabularnewline
Midmean - MS Excel (old versions) & 2.75777777777778 &  &  \tabularnewline
Number of observations & 73 &  &  \tabularnewline
\hline
\end{tabular}
%Source: https://freestatistics.org/blog/index.php?pk=10245&T=1

[TABLE]
[ROW][C]Central Tendency - Ungrouped Data[/C][/ROW]
[ROW][C]Measure[/C][C]Value[/C][C]S.E.[/C][C]Value/S.E.[/C][/ROW]
[ROW][C]Arithmetic Mean[/C][C]2.75712328767123[/C][C]0.0065876581137532[/C][C]418.528593934637[/C][/ROW]
[ROW][C]Geometric Mean[/C][C]2.75655619168462[/C][C][/C][C][/C][/ROW]
[ROW][C]Harmonic Mean[/C][C]2.75598869082038[/C][C][/C][C][/C][/ROW]
[ROW][C]Quadratic Mean[/C][C]2.75768987100753[/C][C][/C][C][/C][/ROW]
[ROW][C]Winsorized Mean ( 1 / 24 )[/C][C]2.75712328767123[/C][C]0.0065876581137532[/C][C]418.528593934637[/C][/ROW]
[ROW][C]Winsorized Mean ( 2 / 24 )[/C][C]2.75712328767123[/C][C]0.00647110264240011[/C][C]426.066999711293[/C][/ROW]
[ROW][C]Winsorized Mean ( 3 / 24 )[/C][C]2.75712328767123[/C][C]0.00647110264240011[/C][C]426.066999711293[/C][/ROW]
[ROW][C]Winsorized Mean ( 4 / 24 )[/C][C]2.75767123287671[/C][C]0.0063615107022595[/C][C]433.493137392229[/C][/ROW]
[ROW][C]Winsorized Mean ( 5 / 24 )[/C][C]2.75767123287671[/C][C]0.0063615107022595[/C][C]433.493137392229[/C][/ROW]
[ROW][C]Winsorized Mean ( 6 / 24 )[/C][C]2.75849315068493[/C][C]0.00621063319809953[/C][C]444.156507508612[/C][/ROW]
[ROW][C]Winsorized Mean ( 7 / 24 )[/C][C]2.75657534246575[/C][C]0.0058462647862868[/C][C]471.510518807097[/C][/ROW]
[ROW][C]Winsorized Mean ( 8 / 24 )[/C][C]2.75657534246575[/C][C]0.00546964495271486[/C][C]503.977016112815[/C][/ROW]
[ROW][C]Winsorized Mean ( 9 / 24 )[/C][C]2.75657534246575[/C][C]0.00546964495271486[/C][C]503.977016112815[/C][/ROW]
[ROW][C]Winsorized Mean ( 10 / 24 )[/C][C]2.75520547945205[/C][C]0.00526001830619176[/C][C]523.80150012193[/C][/ROW]
[ROW][C]Winsorized Mean ( 11 / 24 )[/C][C]2.75671232876712[/C][C]0.00501161054737492[/C][C]550.065154246889[/C][/ROW]
[ROW][C]Winsorized Mean ( 12 / 24 )[/C][C]2.75671232876712[/C][C]0.00501161054737492[/C][C]550.065154246889[/C][/ROW]
[ROW][C]Winsorized Mean ( 13 / 24 )[/C][C]2.75671232876712[/C][C]0.00501161054737492[/C][C]550.065154246889[/C][/ROW]
[ROW][C]Winsorized Mean ( 14 / 24 )[/C][C]2.75671232876712[/C][C]0.00444848235078966[/C][C]619.697261084507[/C][/ROW]
[ROW][C]Winsorized Mean ( 15 / 24 )[/C][C]2.75671232876712[/C][C]0.00444848235078966[/C][C]619.697261084507[/C][/ROW]
[ROW][C]Winsorized Mean ( 16 / 24 )[/C][C]2.75671232876712[/C][C]0.00444848235078966[/C][C]619.697261084507[/C][/ROW]
[ROW][C]Winsorized Mean ( 17 / 24 )[/C][C]2.75671232876712[/C][C]0.00444848235078966[/C][C]619.697261084507[/C][/ROW]
[ROW][C]Winsorized Mean ( 18 / 24 )[/C][C]2.75671232876712[/C][C]0.00444848235078966[/C][C]619.697261084507[/C][/ROW]
[ROW][C]Winsorized Mean ( 19 / 24 )[/C][C]2.75931506849315[/C][C]0.00408401479321209[/C][C]675.637873075122[/C][/ROW]
[ROW][C]Winsorized Mean ( 20 / 24 )[/C][C]2.75657534246575[/C][C]0.00372279159343909[/C][C]740.459215424211[/C][/ROW]
[ROW][C]Winsorized Mean ( 21 / 24 )[/C][C]2.75657534246575[/C][C]0.00372279159343909[/C][C]740.45921542421[/C][/ROW]
[ROW][C]Winsorized Mean ( 22 / 24 )[/C][C]2.75657534246575[/C][C]0.00372279159343909[/C][C]740.459215424211[/C][/ROW]
[ROW][C]Winsorized Mean ( 23 / 24 )[/C][C]2.75657534246575[/C][C]0.00372279159343909[/C][C]740.459215424211[/C][/ROW]
[ROW][C]Winsorized Mean ( 24 / 24 )[/C][C]2.75657534246575[/C][C]0.00372279159343909[/C][C]740.45921542421[/C][/ROW]
[ROW][C]Trimmed Mean ( 1 / 24 )[/C][C]2.75718309859155[/C][C]0.00643863807846775[/C][C]428.224581812136[/C][/ROW]
[ROW][C]Trimmed Mean ( 2 / 24 )[/C][C]2.75724637681159[/C][C]0.00626184830214189[/C][C]440.324684305825[/C][/ROW]
[ROW][C]Trimmed Mean ( 3 / 24 )[/C][C]2.75731343283582[/C][C]0.00612541210292627[/C][C]450.143335093908[/C][/ROW]
[ROW][C]Trimmed Mean ( 4 / 24 )[/C][C]2.75738461538462[/C][C]0.00596172456285206[/C][C]462.514593942511[/C][/ROW]
[ROW][C]Trimmed Mean ( 5 / 24 )[/C][C]2.75730158730159[/C][C]0.00580537010258388[/C][C]474.957072258727[/C][/ROW]
[ROW][C]Trimmed Mean ( 6 / 24 )[/C][C]2.7572131147541[/C][C]0.0056158010272002[/C][C]490.974146234794[/C][/ROW]
[ROW][C]Trimmed Mean ( 7 / 24 )[/C][C]2.75694915254237[/C][C]0.00542874913767196[/C][C]507.842429743337[/C][/ROW]
[ROW][C]Trimmed Mean ( 8 / 24 )[/C][C]2.75701754385965[/C][C]0.0052979219473246[/C][C]520.396029098148[/C][/ROW]
[ROW][C]Trimmed Mean ( 9 / 24 )[/C][C]2.75709090909091[/C][C]0.00522666516744416[/C][C]527.504789528946[/C][/ROW]
[ROW][C]Trimmed Mean ( 10 / 24 )[/C][C]2.75716981132075[/C][C]0.00513516405823375[/C][C]536.919518062893[/C][/ROW]
[ROW][C]Trimmed Mean ( 11 / 24 )[/C][C]2.75745098039216[/C][C]0.00506307770660588[/C][C]544.619525944558[/C][/ROW]
[ROW][C]Trimmed Mean ( 12 / 24 )[/C][C]2.75755102040816[/C][C]0.00502147270390497[/C][C]549.15184907084[/C][/ROW]
[ROW][C]Trimmed Mean ( 13 / 24 )[/C][C]2.75765957446808[/C][C]0.00496251225093216[/C][C]555.698290508015[/C][/ROW]
[ROW][C]Trimmed Mean ( 14 / 24 )[/C][C]2.75777777777778[/C][C]0.00488130725255306[/C][C]564.967053925029[/C][/ROW]
[ROW][C]Trimmed Mean ( 15 / 24 )[/C][C]2.75790697674419[/C][C]0.00488582984577086[/C][C]564.470532908838[/C][/ROW]
[ROW][C]Trimmed Mean ( 16 / 24 )[/C][C]2.75804878048780[/C][C]0.00487926814028199[/C][C]565.258702984175[/C][/ROW]
[ROW][C]Trimmed Mean ( 17 / 24 )[/C][C]2.75820512820513[/C][C]0.00485792471188212[/C][C]567.774366996418[/C][/ROW]
[ROW][C]Trimmed Mean ( 18 / 24 )[/C][C]2.75837837837838[/C][C]0.00481666142201019[/C][C]572.674335333954[/C][/ROW]
[ROW][C]Trimmed Mean ( 19 / 24 )[/C][C]2.75857142857143[/C][C]0.0047481594336335[/C][C]580.977001115662[/C][/ROW]
[ROW][C]Trimmed Mean ( 20 / 24 )[/C][C]2.75848484848485[/C][C]0.00472984584205695[/C][C]583.208193374273[/C][/ROW]
[ROW][C]Trimmed Mean ( 21 / 24 )[/C][C]2.75870967741935[/C][C]0.00476866870094023[/C][C]578.507304748477[/C][/ROW]
[ROW][C]Trimmed Mean ( 22 / 24 )[/C][C]2.75896551724138[/C][C]0.00479492824178769[/C][C]575.392451798769[/C][/ROW]
[ROW][C]Trimmed Mean ( 23 / 24 )[/C][C]2.75925925925926[/C][C]0.00480164756642088[/C][C]574.648434957086[/C][/ROW]
[ROW][C]Trimmed Mean ( 24 / 24 )[/C][C]2.7596[/C][C]0.0047777260979117[/C][C]577.596945376629[/C][/ROW]
[ROW][C]Median[/C][C]2.76[/C][C][/C][C][/C][/ROW]
[ROW][C]Midrange[/C][C]2.755[/C][C][/C][C][/C][/ROW]
[ROW][C]Midmean - Weighted Average at Xnp[/C][C]2.75777777777778[/C][C][/C][C][/C][/ROW]
[ROW][C]Midmean - Weighted Average at X(n+1)p[/C][C]2.75777777777778[/C][C][/C][C][/C][/ROW]
[ROW][C]Midmean - Empirical Distribution Function[/C][C]2.75777777777778[/C][C][/C][C][/C][/ROW]
[ROW][C]Midmean - Empirical Distribution Function - Averaging[/C][C]2.75777777777778[/C][C][/C][C][/C][/ROW]
[ROW][C]Midmean - Empirical Distribution Function - Interpolation[/C][C]2.75777777777778[/C][C][/C][C][/C][/ROW]
[ROW][C]Midmean - Closest Observation[/C][C]2.75777777777778[/C][C][/C][C][/C][/ROW]
[ROW][C]Midmean - True Basic - Statistics Graphics Toolkit[/C][C]2.75777777777778[/C][C][/C][C][/C][/ROW]
[ROW][C]Midmean - MS Excel (old versions)[/C][C]2.75777777777778[/C][C][/C][C][/C][/ROW]
[ROW][C]Number of observations[/C][C]73[/C][C][/C][C][/C][/ROW]
[/TABLE]
Source: https://freestatistics.org/blog/index.php?pk=10245&T=1

Globally Unique Identifier (entire table): ba.freestatistics.org/blog/index.php?pk=10245&T=1

As an alternative you can also use a QR Code:  

The GUIDs for individual cells are displayed in the table below:

Central Tendency - Ungrouped Data
MeasureValueS.E.Value/S.E.
Arithmetic Mean2.757123287671230.0065876581137532418.528593934637
Geometric Mean2.75655619168462
Harmonic Mean2.75598869082038
Quadratic Mean2.75768987100753
Winsorized Mean ( 1 / 24 )2.757123287671230.0065876581137532418.528593934637
Winsorized Mean ( 2 / 24 )2.757123287671230.00647110264240011426.066999711293
Winsorized Mean ( 3 / 24 )2.757123287671230.00647110264240011426.066999711293
Winsorized Mean ( 4 / 24 )2.757671232876710.0063615107022595433.493137392229
Winsorized Mean ( 5 / 24 )2.757671232876710.0063615107022595433.493137392229
Winsorized Mean ( 6 / 24 )2.758493150684930.00621063319809953444.156507508612
Winsorized Mean ( 7 / 24 )2.756575342465750.0058462647862868471.510518807097
Winsorized Mean ( 8 / 24 )2.756575342465750.00546964495271486503.977016112815
Winsorized Mean ( 9 / 24 )2.756575342465750.00546964495271486503.977016112815
Winsorized Mean ( 10 / 24 )2.755205479452050.00526001830619176523.80150012193
Winsorized Mean ( 11 / 24 )2.756712328767120.00501161054737492550.065154246889
Winsorized Mean ( 12 / 24 )2.756712328767120.00501161054737492550.065154246889
Winsorized Mean ( 13 / 24 )2.756712328767120.00501161054737492550.065154246889
Winsorized Mean ( 14 / 24 )2.756712328767120.00444848235078966619.697261084507
Winsorized Mean ( 15 / 24 )2.756712328767120.00444848235078966619.697261084507
Winsorized Mean ( 16 / 24 )2.756712328767120.00444848235078966619.697261084507
Winsorized Mean ( 17 / 24 )2.756712328767120.00444848235078966619.697261084507
Winsorized Mean ( 18 / 24 )2.756712328767120.00444848235078966619.697261084507
Winsorized Mean ( 19 / 24 )2.759315068493150.00408401479321209675.637873075122
Winsorized Mean ( 20 / 24 )2.756575342465750.00372279159343909740.459215424211
Winsorized Mean ( 21 / 24 )2.756575342465750.00372279159343909740.45921542421
Winsorized Mean ( 22 / 24 )2.756575342465750.00372279159343909740.459215424211
Winsorized Mean ( 23 / 24 )2.756575342465750.00372279159343909740.459215424211
Winsorized Mean ( 24 / 24 )2.756575342465750.00372279159343909740.45921542421
Trimmed Mean ( 1 / 24 )2.757183098591550.00643863807846775428.224581812136
Trimmed Mean ( 2 / 24 )2.757246376811590.00626184830214189440.324684305825
Trimmed Mean ( 3 / 24 )2.757313432835820.00612541210292627450.143335093908
Trimmed Mean ( 4 / 24 )2.757384615384620.00596172456285206462.514593942511
Trimmed Mean ( 5 / 24 )2.757301587301590.00580537010258388474.957072258727
Trimmed Mean ( 6 / 24 )2.75721311475410.0056158010272002490.974146234794
Trimmed Mean ( 7 / 24 )2.756949152542370.00542874913767196507.842429743337
Trimmed Mean ( 8 / 24 )2.757017543859650.0052979219473246520.396029098148
Trimmed Mean ( 9 / 24 )2.757090909090910.00522666516744416527.504789528946
Trimmed Mean ( 10 / 24 )2.757169811320750.00513516405823375536.919518062893
Trimmed Mean ( 11 / 24 )2.757450980392160.00506307770660588544.619525944558
Trimmed Mean ( 12 / 24 )2.757551020408160.00502147270390497549.15184907084
Trimmed Mean ( 13 / 24 )2.757659574468080.00496251225093216555.698290508015
Trimmed Mean ( 14 / 24 )2.757777777777780.00488130725255306564.967053925029
Trimmed Mean ( 15 / 24 )2.757906976744190.00488582984577086564.470532908838
Trimmed Mean ( 16 / 24 )2.758048780487800.00487926814028199565.258702984175
Trimmed Mean ( 17 / 24 )2.758205128205130.00485792471188212567.774366996418
Trimmed Mean ( 18 / 24 )2.758378378378380.00481666142201019572.674335333954
Trimmed Mean ( 19 / 24 )2.758571428571430.0047481594336335580.977001115662
Trimmed Mean ( 20 / 24 )2.758484848484850.00472984584205695583.208193374273
Trimmed Mean ( 21 / 24 )2.758709677419350.00476866870094023578.507304748477
Trimmed Mean ( 22 / 24 )2.758965517241380.00479492824178769575.392451798769
Trimmed Mean ( 23 / 24 )2.759259259259260.00480164756642088574.648434957086
Trimmed Mean ( 24 / 24 )2.75960.0047777260979117577.596945376629
Median2.76
Midrange2.755
Midmean - Weighted Average at Xnp2.75777777777778
Midmean - Weighted Average at X(n+1)p2.75777777777778
Midmean - Empirical Distribution Function2.75777777777778
Midmean - Empirical Distribution Function - Averaging2.75777777777778
Midmean - Empirical Distribution Function - Interpolation2.75777777777778
Midmean - Closest Observation2.75777777777778
Midmean - True Basic - Statistics Graphics Toolkit2.75777777777778
Midmean - MS Excel (old versions)2.75777777777778
Number of observations73


Parameters (Session):
Parameters (R input):
R code (references can be found in the software module):
geomean <- function(x) {
return(exp(mean(log(x))))
}
harmean <- function(x) {
return(1/mean(1/x))
}
quamean <- function(x) {
return(sqrt(mean(x*x)))
}
winmean <- function(x) {
x <-sort(x[!is.na(x)])
n<-length(x)
denom <- 3
nodenom <- n/denom
if (nodenom>40) denom <- n/40
sqrtn = sqrt(n)
roundnodenom = floor(nodenom)
win <- array(NA,dim=c(roundnodenom,2))
for (j in 1:roundnodenom) {
win[j,1] <- (j*x[j+1]+sum(x[(j+1):(n-j)])+j*x[n-j])/n
win[j,2] <- sd(c(rep(x[j+1],j),x[(j+1):(n-j)],rep(x[n-j],j)))/sqrtn
}
return(win)
}
trimean <- function(x) {
x <-sort(x[!is.na(x)])
n<-length(x)
denom <- 3
nodenom <- n/denom
if (nodenom>40) denom <- n/40
sqrtn = sqrt(n)
roundnodenom = floor(nodenom)
tri <- array(NA,dim=c(roundnodenom,2))
for (j in 1:roundnodenom) {
tri[j,1] <- mean(x,trim=j/n)
tri[j,2] <- sd(x[(j+1):(n-j)]) / sqrt(n-j*2)
}
return(tri)
}
midrange <- function(x) {
return((max(x)+min(x))/2)
}
q1 <- function(data,n,p,i,f) {
np <- n*p;
i <<- floor(np)
f <<- np - i
qvalue <- (1-f)*data[i] + f*data[i+1]
}
q2 <- function(data,n,p,i,f) {
np <- (n+1)*p
i <<- floor(np)
f <<- np - i
qvalue <- (1-f)*data[i] + f*data[i+1]
}
q3 <- function(data,n,p,i,f) {
np <- n*p
i <<- floor(np)
f <<- np - i
if (f==0) {
qvalue <- data[i]
} else {
qvalue <- data[i+1]
}
}
q4 <- function(data,n,p,i,f) {
np <- n*p
i <<- floor(np)
f <<- np - i
if (f==0) {
qvalue <- (data[i]+data[i+1])/2
} else {
qvalue <- data[i+1]
}
}
q5 <- function(data,n,p,i,f) {
np <- (n-1)*p
i <<- floor(np)
f <<- np - i
if (f==0) {
qvalue <- data[i+1]
} else {
qvalue <- data[i+1] + f*(data[i+2]-data[i+1])
}
}
q6 <- function(data,n,p,i,f) {
np <- n*p+0.5
i <<- floor(np)
f <<- np - i
qvalue <- data[i]
}
q7 <- function(data,n,p,i,f) {
np <- (n+1)*p
i <<- floor(np)
f <<- np - i
if (f==0) {
qvalue <- data[i]
} else {
qvalue <- f*data[i] + (1-f)*data[i+1]
}
}
q8 <- function(data,n,p,i,f) {
np <- (n+1)*p
i <<- floor(np)
f <<- np - i
if (f==0) {
qvalue <- data[i]
} else {
if (f == 0.5) {
qvalue <- (data[i]+data[i+1])/2
} else {
if (f < 0.5) {
qvalue <- data[i]
} else {
qvalue <- data[i+1]
}
}
}
}
midmean <- function(x,def) {
x <-sort(x[!is.na(x)])
n<-length(x)
if (def==1) {
qvalue1 <- q1(x,n,0.25,i,f)
qvalue3 <- q1(x,n,0.75,i,f)
}
if (def==2) {
qvalue1 <- q2(x,n,0.25,i,f)
qvalue3 <- q2(x,n,0.75,i,f)
}
if (def==3) {
qvalue1 <- q3(x,n,0.25,i,f)
qvalue3 <- q3(x,n,0.75,i,f)
}
if (def==4) {
qvalue1 <- q4(x,n,0.25,i,f)
qvalue3 <- q4(x,n,0.75,i,f)
}
if (def==5) {
qvalue1 <- q5(x,n,0.25,i,f)
qvalue3 <- q5(x,n,0.75,i,f)
}
if (def==6) {
qvalue1 <- q6(x,n,0.25,i,f)
qvalue3 <- q6(x,n,0.75,i,f)
}
if (def==7) {
qvalue1 <- q7(x,n,0.25,i,f)
qvalue3 <- q7(x,n,0.75,i,f)
}
if (def==8) {
qvalue1 <- q8(x,n,0.25,i,f)
qvalue3 <- q8(x,n,0.75,i,f)
}
midm <- 0
myn <- 0
roundno4 <- round(n/4)
round3no4 <- round(3*n/4)
for (i in 1:n) {
if ((x[i]>=qvalue1) & (x[i]<=qvalue3)){
midm = midm + x[i]
myn = myn + 1
}
}
midm = midm / myn
return(midm)
}
(arm <- mean(x))
sqrtn <- sqrt(length(x))
(armse <- sd(x) / sqrtn)
(armose <- arm / armse)
(geo <- geomean(x))
(har <- harmean(x))
(qua <- quamean(x))
(win <- winmean(x))
(tri <- trimean(x))
(midr <- midrange(x))
midm <- array(NA,dim=8)
for (j in 1:8) midm[j] <- midmean(x,j)
midm
bitmap(file='test1.png')
lb <- win[,1] - 2*win[,2]
ub <- win[,1] + 2*win[,2]
if ((ylimmin == '') | (ylimmax == '')) plot(win[,1],type='b',main=main, xlab='j', pch=19, ylab='Winsorized Mean(j/n)', ylim=c(min(lb),max(ub))) else plot(win[,1],type='l',main=main, xlab='j', pch=19, ylab='Winsorized Mean(j/n)', ylim=c(ylimmin,ylimmax))
lines(ub,lty=3)
lines(lb,lty=3)
grid()
dev.off()
bitmap(file='test2.png')
lb <- tri[,1] - 2*tri[,2]
ub <- tri[,1] + 2*tri[,2]
if ((ylimmin == '') | (ylimmax == '')) plot(tri[,1],type='b',main=main, xlab='j', pch=19, ylab='Trimmed Mean(j/n)', ylim=c(min(lb),max(ub))) else plot(tri[,1],type='l',main=main, xlab='j', pch=19, ylab='Trimmed Mean(j/n)', ylim=c(ylimmin,ylimmax))
lines(ub,lty=3)
lines(lb,lty=3)
grid()
dev.off()
load(file='createtable')
a<-table.start()
a<-table.row.start(a)
a<-table.element(a,'Central Tendency - Ungrouped Data',4,TRUE)
a<-table.row.end(a)
a<-table.row.start(a)
a<-table.element(a,'Measure',header=TRUE)
a<-table.element(a,'Value',header=TRUE)
a<-table.element(a,'S.E.',header=TRUE)
a<-table.element(a,'Value/S.E.',header=TRUE)
a<-table.row.end(a)
a<-table.row.start(a)
a<-table.element(a,hyperlink('arithmetic_mean.htm', 'Arithmetic Mean', 'click to view the definition of the Arithmetic Mean'),header=TRUE)
a<-table.element(a,arm)
a<-table.element(a,hyperlink('arithmetic_mean_standard_error.htm', armse, 'click to view the definition of the Standard Error of the Arithmetic Mean'))
a<-table.element(a,armose)
a<-table.row.end(a)
a<-table.row.start(a)
a<-table.element(a,hyperlink('geometric_mean.htm', 'Geometric Mean', 'click to view the definition of the Geometric Mean'),header=TRUE)
a<-table.element(a,geo)
a<-table.element(a,'')
a<-table.row.end(a)
a<-table.row.start(a)
a<-table.element(a,hyperlink('harmonic_mean.htm', 'Harmonic Mean', 'click to view the definition of the Harmonic Mean'),header=TRUE)
a<-table.element(a,har)
a<-table.element(a,'')
a<-table.row.end(a)
a<-table.row.start(a)
a<-table.element(a,hyperlink('quadratic_mean.htm', 'Quadratic Mean', 'click to view the definition of the Quadratic Mean'),header=TRUE)
a<-table.element(a,qua)
a<-table.element(a,'')
a<-table.row.end(a)
for (j in 1:length(win[,1])) {
a<-table.row.start(a)
mylabel <- paste('Winsorized Mean (',j)
mylabel <- paste(mylabel,'/')
mylabel <- paste(mylabel,length(win[,1]))
mylabel <- paste(mylabel,')')
a<-table.element(a,hyperlink('winsorized_mean.htm', mylabel, 'click to view the definition of the Winsorized Mean'),header=TRUE)
a<-table.element(a,win[j,1])
a<-table.element(a,win[j,2])
a<-table.element(a,win[j,1]/win[j,2])
a<-table.row.end(a)
}
for (j in 1:length(tri[,1])) {
a<-table.row.start(a)
mylabel <- paste('Trimmed Mean (',j)
mylabel <- paste(mylabel,'/')
mylabel <- paste(mylabel,length(tri[,1]))
mylabel <- paste(mylabel,')')
a<-table.element(a,hyperlink('arithmetic_mean.htm', mylabel, 'click to view the definition of the Trimmed Mean'),header=TRUE)
a<-table.element(a,tri[j,1])
a<-table.element(a,tri[j,2])
a<-table.element(a,tri[j,1]/tri[j,2])
a<-table.row.end(a)
}
a<-table.row.start(a)
a<-table.element(a,hyperlink('median_1.htm', 'Median', 'click to view the definition of the Median'),header=TRUE)
a<-table.element(a,median(x))
a<-table.element(a,'')
a<-table.row.end(a)
a<-table.row.start(a)
a<-table.element(a,hyperlink('midrange.htm', 'Midrange', 'click to view the definition of the Midrange'),header=TRUE)
a<-table.element(a,midr)
a<-table.element(a,'')
a<-table.row.end(a)
a<-table.row.start(a)
mymid <- hyperlink('midmean.htm', 'Midmean', 'click to view the definition of the Midmean')
mylabel <- paste(mymid,hyperlink('method_1.htm','Weighted Average at Xnp',''),sep=' - ')
a<-table.element(a,mylabel,header=TRUE)
a<-table.element(a,midm[1])
a<-table.element(a,'')
a<-table.row.end(a)
a<-table.row.start(a)
mymid <- hyperlink('midmean.htm', 'Midmean', 'click to view the definition of the Midmean')
mylabel <- paste(mymid,hyperlink('method_2.htm','Weighted Average at X(n+1)p',''),sep=' - ')
a<-table.element(a,mylabel,header=TRUE)
a<-table.element(a,midm[2])
a<-table.element(a,'')
a<-table.row.end(a)
a<-table.row.start(a)
mymid <- hyperlink('midmean.htm', 'Midmean', 'click to view the definition of the Midmean')
mylabel <- paste(mymid,hyperlink('method_3.htm','Empirical Distribution Function',''),sep=' - ')
a<-table.element(a,mylabel,header=TRUE)
a<-table.element(a,midm[3])
a<-table.element(a,'')
a<-table.row.end(a)
a<-table.row.start(a)
mymid <- hyperlink('midmean.htm', 'Midmean', 'click to view the definition of the Midmean')
mylabel <- paste(mymid,hyperlink('method_4.htm','Empirical Distribution Function - Averaging',''),sep=' - ')
a<-table.element(a,mylabel,header=TRUE)
a<-table.element(a,midm[4])
a<-table.element(a,'')
a<-table.row.end(a)
a<-table.row.start(a)
mymid <- hyperlink('midmean.htm', 'Midmean', 'click to view the definition of the Midmean')
mylabel <- paste(mymid,hyperlink('method_5.htm','Empirical Distribution Function - Interpolation',''),sep=' - ')
a<-table.element(a,mylabel,header=TRUE)
a<-table.element(a,midm[5])
a<-table.element(a,'')
a<-table.row.end(a)
a<-table.row.start(a)
mymid <- hyperlink('midmean.htm', 'Midmean', 'click to view the definition of the Midmean')
mylabel <- paste(mymid,hyperlink('method_6.htm','Closest Observation',''),sep=' - ')
a<-table.element(a,mylabel,header=TRUE)
a<-table.element(a,midm[6])
a<-table.element(a,'')
a<-table.row.end(a)
a<-table.row.start(a)
mymid <- hyperlink('midmean.htm', 'Midmean', 'click to view the definition of the Midmean')
mylabel <- paste(mymid,hyperlink('method_7.htm','True Basic - Statistics Graphics Toolkit',''),sep=' - ')
a<-table.element(a,mylabel,header=TRUE)
a<-table.element(a,midm[7])
a<-table.element(a,'')
a<-table.row.end(a)
a<-table.row.start(a)
mymid <- hyperlink('midmean.htm', 'Midmean', 'click to view the definition of the Midmean')
mylabel <- paste(mymid,hyperlink('method_8.htm','MS Excel (old versions)',''),sep=' - ')
a<-table.element(a,mylabel,header=TRUE)
a<-table.element(a,midm[8])
a<-table.element(a,'')
a<-table.row.end(a)
a<-table.row.start(a)
a<-table.element(a,'Number of observations',header=TRUE)
a<-table.element(a,length(x))
a<-table.element(a,'')
a<-table.row.end(a)
a<-table.end(a)
table.save(a,file='mytable.tab')