Free Statistics

of Irreproducible Research!

Author's title

Author*Unverified author*
R Software Modulerwasp_centraltendency.wasp
Title produced by softwareCentral Tendency
Date of computationSat, 19 Apr 2008 05:45:07 -0600
Cite this page as followsStatistical Computations at FreeStatistics.org, Office for Research Development and Education, URL https://freestatistics.org/blog/index.php?v=date/2008/Apr/19/t1208605574dbf66j2z40rl9i9.htm/, Retrieved Tue, 14 May 2024 07:45:50 +0000
Statistical Computations at FreeStatistics.org, Office for Research Development and Education, URL https://freestatistics.org/blog/index.php?pk=10246, Retrieved Tue, 14 May 2024 07:45:50 +0000
QR Codes:

Original text written by user:
IsPrivate?No (this computation is public)
User-defined keywords
Estimated Impact241
Family? (F = Feedback message, R = changed R code, M = changed R Module, P = changed Parameters, D = changed Data)
-       [Central Tendency] [Centrummaten eige...] [2008-04-19 11:45:07] [d41d8cd98f00b204e9800998ecf8427e] [Current]
Feedback Forum

Post a new message
Dataseries X:
113000
110000
107000
103000
98000
98000
137000
148000
147000
139000
130000
128000
127000
123000
118000
114000
108000
111000
151000
159000
158000
148000
138000
137000
136000
133000
126000
120000
114000
116000
153000
162000
161000
149000
139000
135000
130000
127000
122000
117000
112000
113000
149000
157000
157000
147000
137000
132000
125000
123000
117000
114000
111000
112000
144000
150000
149000
134000
123000
116000
117000
111000
105000
102000
95000
93000
124000
130000
124000
115000
106000
105000


Summary of compuational transaction
Raw Inputview raw input (R code)
Raw Outputview raw output of R engine
Computing time2 seconds
R Server'Sir Ronald Aylmer Fisher' @ 193.190.124.24

\begin{tabular}{lllllllll}
\hline
Summary of compuational transaction \tabularnewline
Raw Input & view raw input (R code)  \tabularnewline
Raw Output & view raw output of R engine  \tabularnewline
Computing time & 2 seconds \tabularnewline
R Server & 'Sir Ronald Aylmer Fisher' @ 193.190.124.24 \tabularnewline
\hline
\end{tabular}
%Source: https://freestatistics.org/blog/index.php?pk=10246&T=0

[TABLE]
[ROW][C]Summary of compuational transaction[/C][/ROW]
[ROW][C]Raw Input[/C][C]view raw input (R code) [/C][/ROW]
[ROW][C]Raw Output[/C][C]view raw output of R engine [/C][/ROW]
[ROW][C]Computing time[/C][C]2 seconds[/C][/ROW]
[ROW][C]R Server[/C][C]'Sir Ronald Aylmer Fisher' @ 193.190.124.24[/C][/ROW]
[/TABLE]
Source: https://freestatistics.org/blog/index.php?pk=10246&T=0

Globally Unique Identifier (entire table): ba.freestatistics.org/blog/index.php?pk=10246&T=0

As an alternative you can also use a QR Code:  

The GUIDs for individual cells are displayed in the table below:

Summary of compuational transaction
Raw Inputview raw input (R code)
Raw Outputview raw output of R engine
Computing time2 seconds
R Server'Sir Ronald Aylmer Fisher' @ 193.190.124.24


Central Tendency - Ungrouped Data
MeasureValueS.E.Value/S.E.
Arithmetic Mean126930.5555555562117.1043491226259.9547942018819
Geometric Mean125682.736830275
Harmonic Mean124445.463178237
Quadratic Mean128177.990397034
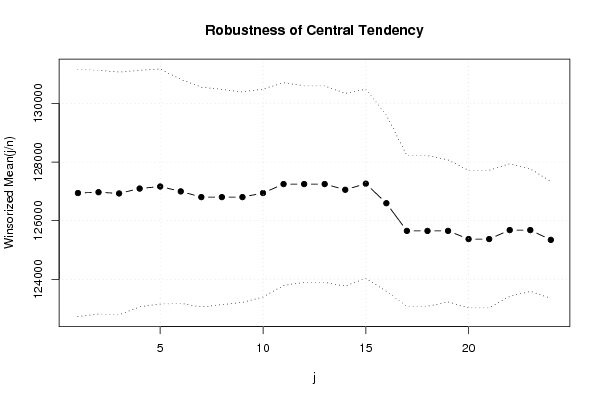
Winsorized Mean ( 1 / 24 )126944.4444444442107.8036029281260.2259357883702
Winsorized Mean ( 2 / 24 )126972.2222222222078.3717653304061.0921608637409
Winsorized Mean ( 3 / 24 )126930.5555555562069.4444444444461.3355704697987
Winsorized Mean ( 4 / 24 )127097.2222222222016.3804672389763.0323613460988
Winsorized Mean ( 5 / 24 )127166.6666666672004.3965759806263.443865445865
Winsorized Mean ( 6 / 24 )1270001909.7394721087566.5012174984086
Winsorized Mean ( 7 / 24 )126805.5555555561873.4032208499167.6872731637708
Winsorized Mean ( 8 / 24 )126805.5555555561835.4276225087969.0877450031121
Winsorized Mean ( 9 / 24 )126805.5555555561793.7073637480770.6946730098644
Winsorized Mean ( 10 / 24 )126944.4444444441772.4514301766571.6208310609633
Winsorized Mean ( 11 / 24 )1272501727.9518754528673.6420972179276
Winsorized Mean ( 12 / 24 )1272501675.5339232652175.9459407136444
Winsorized Mean ( 13 / 24 )1272501675.5339232652175.9459407136444
Winsorized Mean ( 14 / 24 )127055.5555555561641.939681891777.3813782301511
Winsorized Mean ( 15 / 24 )127263.8888888891613.7119137786678.8640697278415
Winsorized Mean ( 16 / 24 )126597.2222222221501.7803365583084.2980954940126
Winsorized Mean ( 17 / 24 )125652.7777777781285.8565710724597.7191240489435
Winsorized Mean ( 18 / 24 )125652.7777777781285.8565710724597.7191240489435
Winsorized Mean ( 19 / 24 )125652.7777777781211.44123905115103.721727251248
Winsorized Mean ( 20 / 24 )1253751172.09293096181106.96677429589
Winsorized Mean ( 21 / 24 )1253751172.09293096181106.96677429589
Winsorized Mean ( 22 / 24 )125680.5555555561130.87734247709111.135443991002
Winsorized Mean ( 23 / 24 )125680.5555555561043.99062619250120.384754807541
Winsorized Mean ( 24 / 24 )125347.222222222998.073206766434125.589206655816
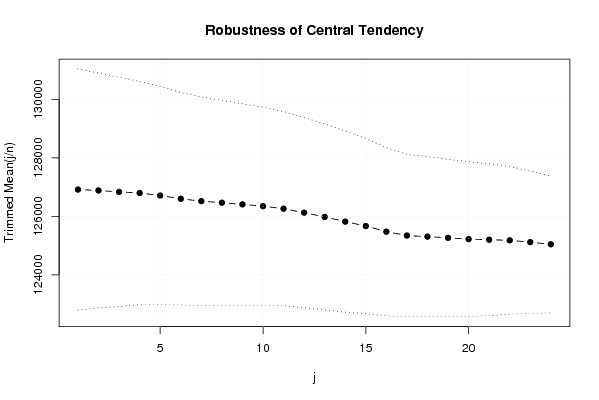
Trimmed Mean ( 1 / 24 )126914.2857142862061.7529434064361.5564954667157
Trimmed Mean ( 2 / 24 )126882.3529411762006.9599498890463.2211683886326
Trimmed Mean ( 3 / 24 )126833.3333333331960.2796210480364.7016537699475
Trimmed Mean ( 4 / 24 )126796.8751908.2605111261466.4463128910905
Trimmed Mean ( 5 / 24 )126709.6774193551865.0090199548867.940517211236
Trimmed Mean ( 6 / 24 )1266001815.9992035638869.7136869617283
Trimmed Mean ( 7 / 24 )126517.2413793101783.0351610519970.956111322373
Trimmed Mean ( 8 / 24 )126464.2857142861751.4306370615672.2062769933383
Trimmed Mean ( 9 / 24 )126407.4074074071720.8221505656473.4575664114136
Trimmed Mean ( 10 / 24 )126346.1538461541691.4933595370574.695033908223
Trimmed Mean ( 11 / 24 )1262601658.3271630145476.1369667071499
Trimmed Mean ( 12 / 24 )1261251624.7272002331177.628416623975
Trimmed Mean ( 13 / 24 )125978.2608695651592.0967642389979.1272639322156
Trimmed Mean ( 14 / 24 )125818.1818181821548.4674027335881.2533616116617
Trimmed Mean ( 15 / 24 )125666.6666666671498.6120821171383.8553673537277
Trimmed Mean ( 16 / 24 )1254751437.5850030609187.2817953253812
Trimmed Mean ( 17 / 24 )125342.1052631581385.392352819690.4740848381739
Trimmed Mean ( 18 / 24 )125305.5555555561368.4769917305791.5657013692974
Trimmed Mean ( 19 / 24 )125264.7058823531341.9787605672393.3432849782254
Trimmed Mean ( 20 / 24 )125218.751321.1480642461394.7802546805775
Trimmed Mean ( 21 / 24 )1252001298.45177480596.4225259877691
Trimmed Mean ( 22 / 24 )125178.5714285711260.9872375655199.27029211671
Trimmed Mean ( 23 / 24 )125115.3846153851214.43487721900103.023543676458
Trimmed Mean ( 24 / 24 )125041.6666666671171.02575911139106.779603859057
Median124500
Midrange127500
Midmean - Weighted Average at Xnp125342.105263158
Midmean - Weighted Average at X(n+1)p125342.105263158
Midmean - Empirical Distribution Function125342.105263158
Midmean - Empirical Distribution Function - Averaging125342.105263158
Midmean - Empirical Distribution Function - Interpolation125342.105263158
Midmean - Closest Observation125342.105263158
Midmean - True Basic - Statistics Graphics Toolkit125342.105263158
Midmean - MS Excel (old versions)125342.105263158
Number of observations72

\begin{tabular}{lllllllll}
\hline
Central Tendency - Ungrouped Data \tabularnewline
Measure & Value & S.E. & Value/S.E. \tabularnewline
Arithmetic Mean & 126930.555555556 & 2117.10434912262 & 59.9547942018819 \tabularnewline
Geometric Mean & 125682.736830275 &  &  \tabularnewline
Harmonic Mean & 124445.463178237 &  &  \tabularnewline
Quadratic Mean & 128177.990397034 &  &  \tabularnewline
Winsorized Mean ( 1 / 24 ) & 126944.444444444 & 2107.80360292812 & 60.2259357883702 \tabularnewline
Winsorized Mean ( 2 / 24 ) & 126972.222222222 & 2078.37176533040 & 61.0921608637409 \tabularnewline
Winsorized Mean ( 3 / 24 ) & 126930.555555556 & 2069.44444444444 & 61.3355704697987 \tabularnewline
Winsorized Mean ( 4 / 24 ) & 127097.222222222 & 2016.38046723897 & 63.0323613460988 \tabularnewline
Winsorized Mean ( 5 / 24 ) & 127166.666666667 & 2004.39657598062 & 63.443865445865 \tabularnewline
Winsorized Mean ( 6 / 24 ) & 127000 & 1909.73947210875 & 66.5012174984086 \tabularnewline
Winsorized Mean ( 7 / 24 ) & 126805.555555556 & 1873.40322084991 & 67.6872731637708 \tabularnewline
Winsorized Mean ( 8 / 24 ) & 126805.555555556 & 1835.42762250879 & 69.0877450031121 \tabularnewline
Winsorized Mean ( 9 / 24 ) & 126805.555555556 & 1793.70736374807 & 70.6946730098644 \tabularnewline
Winsorized Mean ( 10 / 24 ) & 126944.444444444 & 1772.45143017665 & 71.6208310609633 \tabularnewline
Winsorized Mean ( 11 / 24 ) & 127250 & 1727.95187545286 & 73.6420972179276 \tabularnewline
Winsorized Mean ( 12 / 24 ) & 127250 & 1675.53392326521 & 75.9459407136444 \tabularnewline
Winsorized Mean ( 13 / 24 ) & 127250 & 1675.53392326521 & 75.9459407136444 \tabularnewline
Winsorized Mean ( 14 / 24 ) & 127055.555555556 & 1641.9396818917 & 77.3813782301511 \tabularnewline
Winsorized Mean ( 15 / 24 ) & 127263.888888889 & 1613.71191377866 & 78.8640697278415 \tabularnewline
Winsorized Mean ( 16 / 24 ) & 126597.222222222 & 1501.78033655830 & 84.2980954940126 \tabularnewline
Winsorized Mean ( 17 / 24 ) & 125652.777777778 & 1285.85657107245 & 97.7191240489435 \tabularnewline
Winsorized Mean ( 18 / 24 ) & 125652.777777778 & 1285.85657107245 & 97.7191240489435 \tabularnewline
Winsorized Mean ( 19 / 24 ) & 125652.777777778 & 1211.44123905115 & 103.721727251248 \tabularnewline
Winsorized Mean ( 20 / 24 ) & 125375 & 1172.09293096181 & 106.96677429589 \tabularnewline
Winsorized Mean ( 21 / 24 ) & 125375 & 1172.09293096181 & 106.96677429589 \tabularnewline
Winsorized Mean ( 22 / 24 ) & 125680.555555556 & 1130.87734247709 & 111.135443991002 \tabularnewline
Winsorized Mean ( 23 / 24 ) & 125680.555555556 & 1043.99062619250 & 120.384754807541 \tabularnewline
Winsorized Mean ( 24 / 24 ) & 125347.222222222 & 998.073206766434 & 125.589206655816 \tabularnewline
Trimmed Mean ( 1 / 24 ) & 126914.285714286 & 2061.75294340643 & 61.5564954667157 \tabularnewline
Trimmed Mean ( 2 / 24 ) & 126882.352941176 & 2006.95994988904 & 63.2211683886326 \tabularnewline
Trimmed Mean ( 3 / 24 ) & 126833.333333333 & 1960.27962104803 & 64.7016537699475 \tabularnewline
Trimmed Mean ( 4 / 24 ) & 126796.875 & 1908.26051112614 & 66.4463128910905 \tabularnewline
Trimmed Mean ( 5 / 24 ) & 126709.677419355 & 1865.00901995488 & 67.940517211236 \tabularnewline
Trimmed Mean ( 6 / 24 ) & 126600 & 1815.99920356388 & 69.7136869617283 \tabularnewline
Trimmed Mean ( 7 / 24 ) & 126517.241379310 & 1783.03516105199 & 70.956111322373 \tabularnewline
Trimmed Mean ( 8 / 24 ) & 126464.285714286 & 1751.43063706156 & 72.2062769933383 \tabularnewline
Trimmed Mean ( 9 / 24 ) & 126407.407407407 & 1720.82215056564 & 73.4575664114136 \tabularnewline
Trimmed Mean ( 10 / 24 ) & 126346.153846154 & 1691.49335953705 & 74.695033908223 \tabularnewline
Trimmed Mean ( 11 / 24 ) & 126260 & 1658.32716301454 & 76.1369667071499 \tabularnewline
Trimmed Mean ( 12 / 24 ) & 126125 & 1624.72720023311 & 77.628416623975 \tabularnewline
Trimmed Mean ( 13 / 24 ) & 125978.260869565 & 1592.09676423899 & 79.1272639322156 \tabularnewline
Trimmed Mean ( 14 / 24 ) & 125818.181818182 & 1548.46740273358 & 81.2533616116617 \tabularnewline
Trimmed Mean ( 15 / 24 ) & 125666.666666667 & 1498.61208211713 & 83.8553673537277 \tabularnewline
Trimmed Mean ( 16 / 24 ) & 125475 & 1437.58500306091 & 87.2817953253812 \tabularnewline
Trimmed Mean ( 17 / 24 ) & 125342.105263158 & 1385.3923528196 & 90.4740848381739 \tabularnewline
Trimmed Mean ( 18 / 24 ) & 125305.555555556 & 1368.47699173057 & 91.5657013692974 \tabularnewline
Trimmed Mean ( 19 / 24 ) & 125264.705882353 & 1341.97876056723 & 93.3432849782254 \tabularnewline
Trimmed Mean ( 20 / 24 ) & 125218.75 & 1321.14806424613 & 94.7802546805775 \tabularnewline
Trimmed Mean ( 21 / 24 ) & 125200 & 1298.451774805 & 96.4225259877691 \tabularnewline
Trimmed Mean ( 22 / 24 ) & 125178.571428571 & 1260.98723756551 & 99.27029211671 \tabularnewline
Trimmed Mean ( 23 / 24 ) & 125115.384615385 & 1214.43487721900 & 103.023543676458 \tabularnewline
Trimmed Mean ( 24 / 24 ) & 125041.666666667 & 1171.02575911139 & 106.779603859057 \tabularnewline
Median & 124500 &  &  \tabularnewline
Midrange & 127500 &  &  \tabularnewline
Midmean - Weighted Average at Xnp & 125342.105263158 &  &  \tabularnewline
Midmean - Weighted Average at X(n+1)p & 125342.105263158 &  &  \tabularnewline
Midmean - Empirical Distribution Function & 125342.105263158 &  &  \tabularnewline
Midmean - Empirical Distribution Function - Averaging & 125342.105263158 &  &  \tabularnewline
Midmean - Empirical Distribution Function - Interpolation & 125342.105263158 &  &  \tabularnewline
Midmean - Closest Observation & 125342.105263158 &  &  \tabularnewline
Midmean - True Basic - Statistics Graphics Toolkit & 125342.105263158 &  &  \tabularnewline
Midmean - MS Excel (old versions) & 125342.105263158 &  &  \tabularnewline
Number of observations & 72 &  &  \tabularnewline
\hline
\end{tabular}
%Source: https://freestatistics.org/blog/index.php?pk=10246&T=1

[TABLE]
[ROW][C]Central Tendency - Ungrouped Data[/C][/ROW]
[ROW][C]Measure[/C][C]Value[/C][C]S.E.[/C][C]Value/S.E.[/C][/ROW]
[ROW][C]Arithmetic Mean[/C][C]126930.555555556[/C][C]2117.10434912262[/C][C]59.9547942018819[/C][/ROW]
[ROW][C]Geometric Mean[/C][C]125682.736830275[/C][C][/C][C][/C][/ROW]
[ROW][C]Harmonic Mean[/C][C]124445.463178237[/C][C][/C][C][/C][/ROW]
[ROW][C]Quadratic Mean[/C][C]128177.990397034[/C][C][/C][C][/C][/ROW]
[ROW][C]Winsorized Mean ( 1 / 24 )[/C][C]126944.444444444[/C][C]2107.80360292812[/C][C]60.2259357883702[/C][/ROW]
[ROW][C]Winsorized Mean ( 2 / 24 )[/C][C]126972.222222222[/C][C]2078.37176533040[/C][C]61.0921608637409[/C][/ROW]
[ROW][C]Winsorized Mean ( 3 / 24 )[/C][C]126930.555555556[/C][C]2069.44444444444[/C][C]61.3355704697987[/C][/ROW]
[ROW][C]Winsorized Mean ( 4 / 24 )[/C][C]127097.222222222[/C][C]2016.38046723897[/C][C]63.0323613460988[/C][/ROW]
[ROW][C]Winsorized Mean ( 5 / 24 )[/C][C]127166.666666667[/C][C]2004.39657598062[/C][C]63.443865445865[/C][/ROW]
[ROW][C]Winsorized Mean ( 6 / 24 )[/C][C]127000[/C][C]1909.73947210875[/C][C]66.5012174984086[/C][/ROW]
[ROW][C]Winsorized Mean ( 7 / 24 )[/C][C]126805.555555556[/C][C]1873.40322084991[/C][C]67.6872731637708[/C][/ROW]
[ROW][C]Winsorized Mean ( 8 / 24 )[/C][C]126805.555555556[/C][C]1835.42762250879[/C][C]69.0877450031121[/C][/ROW]
[ROW][C]Winsorized Mean ( 9 / 24 )[/C][C]126805.555555556[/C][C]1793.70736374807[/C][C]70.6946730098644[/C][/ROW]
[ROW][C]Winsorized Mean ( 10 / 24 )[/C][C]126944.444444444[/C][C]1772.45143017665[/C][C]71.6208310609633[/C][/ROW]
[ROW][C]Winsorized Mean ( 11 / 24 )[/C][C]127250[/C][C]1727.95187545286[/C][C]73.6420972179276[/C][/ROW]
[ROW][C]Winsorized Mean ( 12 / 24 )[/C][C]127250[/C][C]1675.53392326521[/C][C]75.9459407136444[/C][/ROW]
[ROW][C]Winsorized Mean ( 13 / 24 )[/C][C]127250[/C][C]1675.53392326521[/C][C]75.9459407136444[/C][/ROW]
[ROW][C]Winsorized Mean ( 14 / 24 )[/C][C]127055.555555556[/C][C]1641.9396818917[/C][C]77.3813782301511[/C][/ROW]
[ROW][C]Winsorized Mean ( 15 / 24 )[/C][C]127263.888888889[/C][C]1613.71191377866[/C][C]78.8640697278415[/C][/ROW]
[ROW][C]Winsorized Mean ( 16 / 24 )[/C][C]126597.222222222[/C][C]1501.78033655830[/C][C]84.2980954940126[/C][/ROW]
[ROW][C]Winsorized Mean ( 17 / 24 )[/C][C]125652.777777778[/C][C]1285.85657107245[/C][C]97.7191240489435[/C][/ROW]
[ROW][C]Winsorized Mean ( 18 / 24 )[/C][C]125652.777777778[/C][C]1285.85657107245[/C][C]97.7191240489435[/C][/ROW]
[ROW][C]Winsorized Mean ( 19 / 24 )[/C][C]125652.777777778[/C][C]1211.44123905115[/C][C]103.721727251248[/C][/ROW]
[ROW][C]Winsorized Mean ( 20 / 24 )[/C][C]125375[/C][C]1172.09293096181[/C][C]106.96677429589[/C][/ROW]
[ROW][C]Winsorized Mean ( 21 / 24 )[/C][C]125375[/C][C]1172.09293096181[/C][C]106.96677429589[/C][/ROW]
[ROW][C]Winsorized Mean ( 22 / 24 )[/C][C]125680.555555556[/C][C]1130.87734247709[/C][C]111.135443991002[/C][/ROW]
[ROW][C]Winsorized Mean ( 23 / 24 )[/C][C]125680.555555556[/C][C]1043.99062619250[/C][C]120.384754807541[/C][/ROW]
[ROW][C]Winsorized Mean ( 24 / 24 )[/C][C]125347.222222222[/C][C]998.073206766434[/C][C]125.589206655816[/C][/ROW]
[ROW][C]Trimmed Mean ( 1 / 24 )[/C][C]126914.285714286[/C][C]2061.75294340643[/C][C]61.5564954667157[/C][/ROW]
[ROW][C]Trimmed Mean ( 2 / 24 )[/C][C]126882.352941176[/C][C]2006.95994988904[/C][C]63.2211683886326[/C][/ROW]
[ROW][C]Trimmed Mean ( 3 / 24 )[/C][C]126833.333333333[/C][C]1960.27962104803[/C][C]64.7016537699475[/C][/ROW]
[ROW][C]Trimmed Mean ( 4 / 24 )[/C][C]126796.875[/C][C]1908.26051112614[/C][C]66.4463128910905[/C][/ROW]
[ROW][C]Trimmed Mean ( 5 / 24 )[/C][C]126709.677419355[/C][C]1865.00901995488[/C][C]67.940517211236[/C][/ROW]
[ROW][C]Trimmed Mean ( 6 / 24 )[/C][C]126600[/C][C]1815.99920356388[/C][C]69.7136869617283[/C][/ROW]
[ROW][C]Trimmed Mean ( 7 / 24 )[/C][C]126517.241379310[/C][C]1783.03516105199[/C][C]70.956111322373[/C][/ROW]
[ROW][C]Trimmed Mean ( 8 / 24 )[/C][C]126464.285714286[/C][C]1751.43063706156[/C][C]72.2062769933383[/C][/ROW]
[ROW][C]Trimmed Mean ( 9 / 24 )[/C][C]126407.407407407[/C][C]1720.82215056564[/C][C]73.4575664114136[/C][/ROW]
[ROW][C]Trimmed Mean ( 10 / 24 )[/C][C]126346.153846154[/C][C]1691.49335953705[/C][C]74.695033908223[/C][/ROW]
[ROW][C]Trimmed Mean ( 11 / 24 )[/C][C]126260[/C][C]1658.32716301454[/C][C]76.1369667071499[/C][/ROW]
[ROW][C]Trimmed Mean ( 12 / 24 )[/C][C]126125[/C][C]1624.72720023311[/C][C]77.628416623975[/C][/ROW]
[ROW][C]Trimmed Mean ( 13 / 24 )[/C][C]125978.260869565[/C][C]1592.09676423899[/C][C]79.1272639322156[/C][/ROW]
[ROW][C]Trimmed Mean ( 14 / 24 )[/C][C]125818.181818182[/C][C]1548.46740273358[/C][C]81.2533616116617[/C][/ROW]
[ROW][C]Trimmed Mean ( 15 / 24 )[/C][C]125666.666666667[/C][C]1498.61208211713[/C][C]83.8553673537277[/C][/ROW]
[ROW][C]Trimmed Mean ( 16 / 24 )[/C][C]125475[/C][C]1437.58500306091[/C][C]87.2817953253812[/C][/ROW]
[ROW][C]Trimmed Mean ( 17 / 24 )[/C][C]125342.105263158[/C][C]1385.3923528196[/C][C]90.4740848381739[/C][/ROW]
[ROW][C]Trimmed Mean ( 18 / 24 )[/C][C]125305.555555556[/C][C]1368.47699173057[/C][C]91.5657013692974[/C][/ROW]
[ROW][C]Trimmed Mean ( 19 / 24 )[/C][C]125264.705882353[/C][C]1341.97876056723[/C][C]93.3432849782254[/C][/ROW]
[ROW][C]Trimmed Mean ( 20 / 24 )[/C][C]125218.75[/C][C]1321.14806424613[/C][C]94.7802546805775[/C][/ROW]
[ROW][C]Trimmed Mean ( 21 / 24 )[/C][C]125200[/C][C]1298.451774805[/C][C]96.4225259877691[/C][/ROW]
[ROW][C]Trimmed Mean ( 22 / 24 )[/C][C]125178.571428571[/C][C]1260.98723756551[/C][C]99.27029211671[/C][/ROW]
[ROW][C]Trimmed Mean ( 23 / 24 )[/C][C]125115.384615385[/C][C]1214.43487721900[/C][C]103.023543676458[/C][/ROW]
[ROW][C]Trimmed Mean ( 24 / 24 )[/C][C]125041.666666667[/C][C]1171.02575911139[/C][C]106.779603859057[/C][/ROW]
[ROW][C]Median[/C][C]124500[/C][C][/C][C][/C][/ROW]
[ROW][C]Midrange[/C][C]127500[/C][C][/C][C][/C][/ROW]
[ROW][C]Midmean - Weighted Average at Xnp[/C][C]125342.105263158[/C][C][/C][C][/C][/ROW]
[ROW][C]Midmean - Weighted Average at X(n+1)p[/C][C]125342.105263158[/C][C][/C][C][/C][/ROW]
[ROW][C]Midmean - Empirical Distribution Function[/C][C]125342.105263158[/C][C][/C][C][/C][/ROW]
[ROW][C]Midmean - Empirical Distribution Function - Averaging[/C][C]125342.105263158[/C][C][/C][C][/C][/ROW]
[ROW][C]Midmean - Empirical Distribution Function - Interpolation[/C][C]125342.105263158[/C][C][/C][C][/C][/ROW]
[ROW][C]Midmean - Closest Observation[/C][C]125342.105263158[/C][C][/C][C][/C][/ROW]
[ROW][C]Midmean - True Basic - Statistics Graphics Toolkit[/C][C]125342.105263158[/C][C][/C][C][/C][/ROW]
[ROW][C]Midmean - MS Excel (old versions)[/C][C]125342.105263158[/C][C][/C][C][/C][/ROW]
[ROW][C]Number of observations[/C][C]72[/C][C][/C][C][/C][/ROW]
[/TABLE]
Source: https://freestatistics.org/blog/index.php?pk=10246&T=1

Globally Unique Identifier (entire table): ba.freestatistics.org/blog/index.php?pk=10246&T=1

As an alternative you can also use a QR Code:  

The GUIDs for individual cells are displayed in the table below:

Central Tendency - Ungrouped Data
MeasureValueS.E.Value/S.E.
Arithmetic Mean126930.5555555562117.1043491226259.9547942018819
Geometric Mean125682.736830275
Harmonic Mean124445.463178237
Quadratic Mean128177.990397034
Winsorized Mean ( 1 / 24 )126944.4444444442107.8036029281260.2259357883702
Winsorized Mean ( 2 / 24 )126972.2222222222078.3717653304061.0921608637409
Winsorized Mean ( 3 / 24 )126930.5555555562069.4444444444461.3355704697987
Winsorized Mean ( 4 / 24 )127097.2222222222016.3804672389763.0323613460988
Winsorized Mean ( 5 / 24 )127166.6666666672004.3965759806263.443865445865
Winsorized Mean ( 6 / 24 )1270001909.7394721087566.5012174984086
Winsorized Mean ( 7 / 24 )126805.5555555561873.4032208499167.6872731637708
Winsorized Mean ( 8 / 24 )126805.5555555561835.4276225087969.0877450031121
Winsorized Mean ( 9 / 24 )126805.5555555561793.7073637480770.6946730098644
Winsorized Mean ( 10 / 24 )126944.4444444441772.4514301766571.6208310609633
Winsorized Mean ( 11 / 24 )1272501727.9518754528673.6420972179276
Winsorized Mean ( 12 / 24 )1272501675.5339232652175.9459407136444
Winsorized Mean ( 13 / 24 )1272501675.5339232652175.9459407136444
Winsorized Mean ( 14 / 24 )127055.5555555561641.939681891777.3813782301511
Winsorized Mean ( 15 / 24 )127263.8888888891613.7119137786678.8640697278415
Winsorized Mean ( 16 / 24 )126597.2222222221501.7803365583084.2980954940126
Winsorized Mean ( 17 / 24 )125652.7777777781285.8565710724597.7191240489435
Winsorized Mean ( 18 / 24 )125652.7777777781285.8565710724597.7191240489435
Winsorized Mean ( 19 / 24 )125652.7777777781211.44123905115103.721727251248
Winsorized Mean ( 20 / 24 )1253751172.09293096181106.96677429589
Winsorized Mean ( 21 / 24 )1253751172.09293096181106.96677429589
Winsorized Mean ( 22 / 24 )125680.5555555561130.87734247709111.135443991002
Winsorized Mean ( 23 / 24 )125680.5555555561043.99062619250120.384754807541
Winsorized Mean ( 24 / 24 )125347.222222222998.073206766434125.589206655816
Trimmed Mean ( 1 / 24 )126914.2857142862061.7529434064361.5564954667157
Trimmed Mean ( 2 / 24 )126882.3529411762006.9599498890463.2211683886326
Trimmed Mean ( 3 / 24 )126833.3333333331960.2796210480364.7016537699475
Trimmed Mean ( 4 / 24 )126796.8751908.2605111261466.4463128910905
Trimmed Mean ( 5 / 24 )126709.6774193551865.0090199548867.940517211236
Trimmed Mean ( 6 / 24 )1266001815.9992035638869.7136869617283
Trimmed Mean ( 7 / 24 )126517.2413793101783.0351610519970.956111322373
Trimmed Mean ( 8 / 24 )126464.2857142861751.4306370615672.2062769933383
Trimmed Mean ( 9 / 24 )126407.4074074071720.8221505656473.4575664114136
Trimmed Mean ( 10 / 24 )126346.1538461541691.4933595370574.695033908223
Trimmed Mean ( 11 / 24 )1262601658.3271630145476.1369667071499
Trimmed Mean ( 12 / 24 )1261251624.7272002331177.628416623975
Trimmed Mean ( 13 / 24 )125978.2608695651592.0967642389979.1272639322156
Trimmed Mean ( 14 / 24 )125818.1818181821548.4674027335881.2533616116617
Trimmed Mean ( 15 / 24 )125666.6666666671498.6120821171383.8553673537277
Trimmed Mean ( 16 / 24 )1254751437.5850030609187.2817953253812
Trimmed Mean ( 17 / 24 )125342.1052631581385.392352819690.4740848381739
Trimmed Mean ( 18 / 24 )125305.5555555561368.4769917305791.5657013692974
Trimmed Mean ( 19 / 24 )125264.7058823531341.9787605672393.3432849782254
Trimmed Mean ( 20 / 24 )125218.751321.1480642461394.7802546805775
Trimmed Mean ( 21 / 24 )1252001298.45177480596.4225259877691
Trimmed Mean ( 22 / 24 )125178.5714285711260.9872375655199.27029211671
Trimmed Mean ( 23 / 24 )125115.3846153851214.43487721900103.023543676458
Trimmed Mean ( 24 / 24 )125041.6666666671171.02575911139106.779603859057
Median124500
Midrange127500
Midmean - Weighted Average at Xnp125342.105263158
Midmean - Weighted Average at X(n+1)p125342.105263158
Midmean - Empirical Distribution Function125342.105263158
Midmean - Empirical Distribution Function - Averaging125342.105263158
Midmean - Empirical Distribution Function - Interpolation125342.105263158
Midmean - Closest Observation125342.105263158
Midmean - True Basic - Statistics Graphics Toolkit125342.105263158
Midmean - MS Excel (old versions)125342.105263158
Number of observations72


Parameters (Session):
Parameters (R input):
R code (references can be found in the software module):
geomean <- function(x) {
return(exp(mean(log(x))))
}
harmean <- function(x) {
return(1/mean(1/x))
}
quamean <- function(x) {
return(sqrt(mean(x*x)))
}
winmean <- function(x) {
x <-sort(x[!is.na(x)])
n<-length(x)
denom <- 3
nodenom <- n/denom
if (nodenom>40) denom <- n/40
sqrtn = sqrt(n)
roundnodenom = floor(nodenom)
win <- array(NA,dim=c(roundnodenom,2))
for (j in 1:roundnodenom) {
win[j,1] <- (j*x[j+1]+sum(x[(j+1):(n-j)])+j*x[n-j])/n
win[j,2] <- sd(c(rep(x[j+1],j),x[(j+1):(n-j)],rep(x[n-j],j)))/sqrtn
}
return(win)
}
trimean <- function(x) {
x <-sort(x[!is.na(x)])
n<-length(x)
denom <- 3
nodenom <- n/denom
if (nodenom>40) denom <- n/40
sqrtn = sqrt(n)
roundnodenom = floor(nodenom)
tri <- array(NA,dim=c(roundnodenom,2))
for (j in 1:roundnodenom) {
tri[j,1] <- mean(x,trim=j/n)
tri[j,2] <- sd(x[(j+1):(n-j)]) / sqrt(n-j*2)
}
return(tri)
}
midrange <- function(x) {
return((max(x)+min(x))/2)
}
q1 <- function(data,n,p,i,f) {
np <- n*p;
i <<- floor(np)
f <<- np - i
qvalue <- (1-f)*data[i] + f*data[i+1]
}
q2 <- function(data,n,p,i,f) {
np <- (n+1)*p
i <<- floor(np)
f <<- np - i
qvalue <- (1-f)*data[i] + f*data[i+1]
}
q3 <- function(data,n,p,i,f) {
np <- n*p
i <<- floor(np)
f <<- np - i
if (f==0) {
qvalue <- data[i]
} else {
qvalue <- data[i+1]
}
}
q4 <- function(data,n,p,i,f) {
np <- n*p
i <<- floor(np)
f <<- np - i
if (f==0) {
qvalue <- (data[i]+data[i+1])/2
} else {
qvalue <- data[i+1]
}
}
q5 <- function(data,n,p,i,f) {
np <- (n-1)*p
i <<- floor(np)
f <<- np - i
if (f==0) {
qvalue <- data[i+1]
} else {
qvalue <- data[i+1] + f*(data[i+2]-data[i+1])
}
}
q6 <- function(data,n,p,i,f) {
np <- n*p+0.5
i <<- floor(np)
f <<- np - i
qvalue <- data[i]
}
q7 <- function(data,n,p,i,f) {
np <- (n+1)*p
i <<- floor(np)
f <<- np - i
if (f==0) {
qvalue <- data[i]
} else {
qvalue <- f*data[i] + (1-f)*data[i+1]
}
}
q8 <- function(data,n,p,i,f) {
np <- (n+1)*p
i <<- floor(np)
f <<- np - i
if (f==0) {
qvalue <- data[i]
} else {
if (f == 0.5) {
qvalue <- (data[i]+data[i+1])/2
} else {
if (f < 0.5) {
qvalue <- data[i]
} else {
qvalue <- data[i+1]
}
}
}
}
midmean <- function(x,def) {
x <-sort(x[!is.na(x)])
n<-length(x)
if (def==1) {
qvalue1 <- q1(x,n,0.25,i,f)
qvalue3 <- q1(x,n,0.75,i,f)
}
if (def==2) {
qvalue1 <- q2(x,n,0.25,i,f)
qvalue3 <- q2(x,n,0.75,i,f)
}
if (def==3) {
qvalue1 <- q3(x,n,0.25,i,f)
qvalue3 <- q3(x,n,0.75,i,f)
}
if (def==4) {
qvalue1 <- q4(x,n,0.25,i,f)
qvalue3 <- q4(x,n,0.75,i,f)
}
if (def==5) {
qvalue1 <- q5(x,n,0.25,i,f)
qvalue3 <- q5(x,n,0.75,i,f)
}
if (def==6) {
qvalue1 <- q6(x,n,0.25,i,f)
qvalue3 <- q6(x,n,0.75,i,f)
}
if (def==7) {
qvalue1 <- q7(x,n,0.25,i,f)
qvalue3 <- q7(x,n,0.75,i,f)
}
if (def==8) {
qvalue1 <- q8(x,n,0.25,i,f)
qvalue3 <- q8(x,n,0.75,i,f)
}
midm <- 0
myn <- 0
roundno4 <- round(n/4)
round3no4 <- round(3*n/4)
for (i in 1:n) {
if ((x[i]>=qvalue1) & (x[i]<=qvalue3)){
midm = midm + x[i]
myn = myn + 1
}
}
midm = midm / myn
return(midm)
}
(arm <- mean(x))
sqrtn <- sqrt(length(x))
(armse <- sd(x) / sqrtn)
(armose <- arm / armse)
(geo <- geomean(x))
(har <- harmean(x))
(qua <- quamean(x))
(win <- winmean(x))
(tri <- trimean(x))
(midr <- midrange(x))
midm <- array(NA,dim=8)
for (j in 1:8) midm[j] <- midmean(x,j)
midm
bitmap(file='test1.png')
lb <- win[,1] - 2*win[,2]
ub <- win[,1] + 2*win[,2]
if ((ylimmin == '') | (ylimmax == '')) plot(win[,1],type='b',main=main, xlab='j', pch=19, ylab='Winsorized Mean(j/n)', ylim=c(min(lb),max(ub))) else plot(win[,1],type='l',main=main, xlab='j', pch=19, ylab='Winsorized Mean(j/n)', ylim=c(ylimmin,ylimmax))
lines(ub,lty=3)
lines(lb,lty=3)
grid()
dev.off()
bitmap(file='test2.png')
lb <- tri[,1] - 2*tri[,2]
ub <- tri[,1] + 2*tri[,2]
if ((ylimmin == '') | (ylimmax == '')) plot(tri[,1],type='b',main=main, xlab='j', pch=19, ylab='Trimmed Mean(j/n)', ylim=c(min(lb),max(ub))) else plot(tri[,1],type='l',main=main, xlab='j', pch=19, ylab='Trimmed Mean(j/n)', ylim=c(ylimmin,ylimmax))
lines(ub,lty=3)
lines(lb,lty=3)
grid()
dev.off()
load(file='createtable')
a<-table.start()
a<-table.row.start(a)
a<-table.element(a,'Central Tendency - Ungrouped Data',4,TRUE)
a<-table.row.end(a)
a<-table.row.start(a)
a<-table.element(a,'Measure',header=TRUE)
a<-table.element(a,'Value',header=TRUE)
a<-table.element(a,'S.E.',header=TRUE)
a<-table.element(a,'Value/S.E.',header=TRUE)
a<-table.row.end(a)
a<-table.row.start(a)
a<-table.element(a,hyperlink('arithmetic_mean.htm', 'Arithmetic Mean', 'click to view the definition of the Arithmetic Mean'),header=TRUE)
a<-table.element(a,arm)
a<-table.element(a,hyperlink('arithmetic_mean_standard_error.htm', armse, 'click to view the definition of the Standard Error of the Arithmetic Mean'))
a<-table.element(a,armose)
a<-table.row.end(a)
a<-table.row.start(a)
a<-table.element(a,hyperlink('geometric_mean.htm', 'Geometric Mean', 'click to view the definition of the Geometric Mean'),header=TRUE)
a<-table.element(a,geo)
a<-table.element(a,'')
a<-table.row.end(a)
a<-table.row.start(a)
a<-table.element(a,hyperlink('harmonic_mean.htm', 'Harmonic Mean', 'click to view the definition of the Harmonic Mean'),header=TRUE)
a<-table.element(a,har)
a<-table.element(a,'')
a<-table.row.end(a)
a<-table.row.start(a)
a<-table.element(a,hyperlink('quadratic_mean.htm', 'Quadratic Mean', 'click to view the definition of the Quadratic Mean'),header=TRUE)
a<-table.element(a,qua)
a<-table.element(a,'')
a<-table.row.end(a)
for (j in 1:length(win[,1])) {
a<-table.row.start(a)
mylabel <- paste('Winsorized Mean (',j)
mylabel <- paste(mylabel,'/')
mylabel <- paste(mylabel,length(win[,1]))
mylabel <- paste(mylabel,')')
a<-table.element(a,hyperlink('winsorized_mean.htm', mylabel, 'click to view the definition of the Winsorized Mean'),header=TRUE)
a<-table.element(a,win[j,1])
a<-table.element(a,win[j,2])
a<-table.element(a,win[j,1]/win[j,2])
a<-table.row.end(a)
}
for (j in 1:length(tri[,1])) {
a<-table.row.start(a)
mylabel <- paste('Trimmed Mean (',j)
mylabel <- paste(mylabel,'/')
mylabel <- paste(mylabel,length(tri[,1]))
mylabel <- paste(mylabel,')')
a<-table.element(a,hyperlink('arithmetic_mean.htm', mylabel, 'click to view the definition of the Trimmed Mean'),header=TRUE)
a<-table.element(a,tri[j,1])
a<-table.element(a,tri[j,2])
a<-table.element(a,tri[j,1]/tri[j,2])
a<-table.row.end(a)
}
a<-table.row.start(a)
a<-table.element(a,hyperlink('median_1.htm', 'Median', 'click to view the definition of the Median'),header=TRUE)
a<-table.element(a,median(x))
a<-table.element(a,'')
a<-table.row.end(a)
a<-table.row.start(a)
a<-table.element(a,hyperlink('midrange.htm', 'Midrange', 'click to view the definition of the Midrange'),header=TRUE)
a<-table.element(a,midr)
a<-table.element(a,'')
a<-table.row.end(a)
a<-table.row.start(a)
mymid <- hyperlink('midmean.htm', 'Midmean', 'click to view the definition of the Midmean')
mylabel <- paste(mymid,hyperlink('method_1.htm','Weighted Average at Xnp',''),sep=' - ')
a<-table.element(a,mylabel,header=TRUE)
a<-table.element(a,midm[1])
a<-table.element(a,'')
a<-table.row.end(a)
a<-table.row.start(a)
mymid <- hyperlink('midmean.htm', 'Midmean', 'click to view the definition of the Midmean')
mylabel <- paste(mymid,hyperlink('method_2.htm','Weighted Average at X(n+1)p',''),sep=' - ')
a<-table.element(a,mylabel,header=TRUE)
a<-table.element(a,midm[2])
a<-table.element(a,'')
a<-table.row.end(a)
a<-table.row.start(a)
mymid <- hyperlink('midmean.htm', 'Midmean', 'click to view the definition of the Midmean')
mylabel <- paste(mymid,hyperlink('method_3.htm','Empirical Distribution Function',''),sep=' - ')
a<-table.element(a,mylabel,header=TRUE)
a<-table.element(a,midm[3])
a<-table.element(a,'')
a<-table.row.end(a)
a<-table.row.start(a)
mymid <- hyperlink('midmean.htm', 'Midmean', 'click to view the definition of the Midmean')
mylabel <- paste(mymid,hyperlink('method_4.htm','Empirical Distribution Function - Averaging',''),sep=' - ')
a<-table.element(a,mylabel,header=TRUE)
a<-table.element(a,midm[4])
a<-table.element(a,'')
a<-table.row.end(a)
a<-table.row.start(a)
mymid <- hyperlink('midmean.htm', 'Midmean', 'click to view the definition of the Midmean')
mylabel <- paste(mymid,hyperlink('method_5.htm','Empirical Distribution Function - Interpolation',''),sep=' - ')
a<-table.element(a,mylabel,header=TRUE)
a<-table.element(a,midm[5])
a<-table.element(a,'')
a<-table.row.end(a)
a<-table.row.start(a)
mymid <- hyperlink('midmean.htm', 'Midmean', 'click to view the definition of the Midmean')
mylabel <- paste(mymid,hyperlink('method_6.htm','Closest Observation',''),sep=' - ')
a<-table.element(a,mylabel,header=TRUE)
a<-table.element(a,midm[6])
a<-table.element(a,'')
a<-table.row.end(a)
a<-table.row.start(a)
mymid <- hyperlink('midmean.htm', 'Midmean', 'click to view the definition of the Midmean')
mylabel <- paste(mymid,hyperlink('method_7.htm','True Basic - Statistics Graphics Toolkit',''),sep=' - ')
a<-table.element(a,mylabel,header=TRUE)
a<-table.element(a,midm[7])
a<-table.element(a,'')
a<-table.row.end(a)
a<-table.row.start(a)
mymid <- hyperlink('midmean.htm', 'Midmean', 'click to view the definition of the Midmean')
mylabel <- paste(mymid,hyperlink('method_8.htm','MS Excel (old versions)',''),sep=' - ')
a<-table.element(a,mylabel,header=TRUE)
a<-table.element(a,midm[8])
a<-table.element(a,'')
a<-table.row.end(a)
a<-table.row.start(a)
a<-table.element(a,'Number of observations',header=TRUE)
a<-table.element(a,length(x))
a<-table.element(a,'')
a<-table.row.end(a)
a<-table.end(a)
table.save(a,file='mytable.tab')