Free Statistics

of Irreproducible Research!

Author's title

Author*Unverified author*
R Software Modulerwasp_centraltendency.wasp
Title produced by softwareCentral Tendency
Date of computationSun, 20 Apr 2008 11:44:11 -0600
Cite this page as followsStatistical Computations at FreeStatistics.org, Office for Research Development and Education, URL https://freestatistics.org/blog/index.php?v=date/2008/Apr/20/t1208713772w0w5562v0bm5i7m.htm/, Retrieved Sun, 12 May 2024 20:46:41 +0000
Statistical Computations at FreeStatistics.org, Office for Research Development and Education, URL https://freestatistics.org/blog/index.php?pk=10395, Retrieved Sun, 12 May 2024 20:46:41 +0000
QR Codes:

Original text written by user:
IsPrivate?No (this computation is public)
User-defined keywords
Estimated Impact163
Family? (F = Feedback message, R = changed R code, M = changed R Module, P = changed Parameters, D = changed Data)
-       [Central Tendency] [OEF5.2] [2008-04-20 17:44:11] [15ccabfe3b960eee2f000db554701399] [Current]
Feedback Forum

Post a new message
Dataseries X:
138463
138529
138421
138674
138848
139174
139565
139585
139500
139756
140245
140138
140224
140354
140563
141244
141597
141708
142055
142457
142429
142613
142564
142778
143086
143362
143619
143791
144088
144369
144295
144671
144846
145395
145583
145949
145915
145888
146145
145713
145913
146087
146045
145753
146260
146016
146647
146211
146248


Summary of compuational transaction
Raw Inputview raw input (R code)
Raw Outputview raw output of R engine
Computing time1 seconds
R Server'George Udny Yule' @ 72.249.76.132

\begin{tabular}{lllllllll}
\hline
Summary of compuational transaction \tabularnewline
Raw Input & view raw input (R code)  \tabularnewline
Raw Output & view raw output of R engine  \tabularnewline
Computing time & 1 seconds \tabularnewline
R Server & 'George Udny Yule' @ 72.249.76.132 \tabularnewline
\hline
\end{tabular}
%Source: https://freestatistics.org/blog/index.php?pk=10395&T=0

[TABLE]
[ROW][C]Summary of compuational transaction[/C][/ROW]
[ROW][C]Raw Input[/C][C]view raw input (R code) [/C][/ROW]
[ROW][C]Raw Output[/C][C]view raw output of R engine [/C][/ROW]
[ROW][C]Computing time[/C][C]1 seconds[/C][/ROW]
[ROW][C]R Server[/C][C]'George Udny Yule' @ 72.249.76.132[/C][/ROW]
[/TABLE]
Source: https://freestatistics.org/blog/index.php?pk=10395&T=0

Globally Unique Identifier (entire table): ba.freestatistics.org/blog/index.php?pk=10395&T=0

As an alternative you can also use a QR Code:  

The GUIDs for individual cells are displayed in the table below:

Summary of compuational transaction
Raw Inputview raw input (R code)
Raw Outputview raw output of R engine
Computing time1 seconds
R Server'George Udny Yule' @ 72.249.76.132


Central Tendency - Ungrouped Data
MeasureValueS.E.Value/S.E.
Arithmetic Mean142926.102040816390.783934600157365.742010830245
Geometric Mean142900.380384599
Harmonic Mean142874.584416262
Quadratic Mean142951.742992493
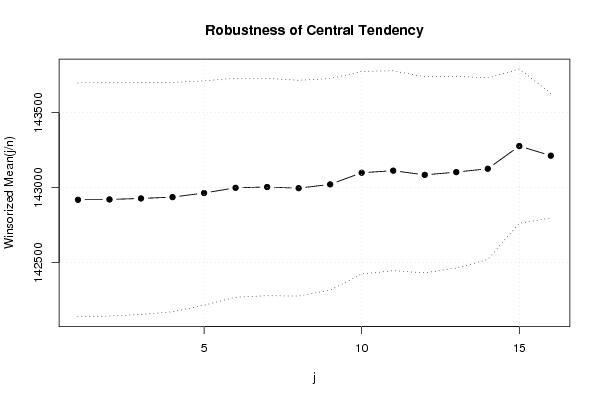
Winsorized Mean ( 1 / 16 )142919.061224490389.088810412088367.317325504999
Winsorized Mean ( 2 / 16 )142921.265306122388.362556317217368.009899464622
Winsorized Mean ( 3 / 16 )142927.877551020385.894331471427370.38086827042
Winsorized Mean ( 4 / 16 )142936.693877551381.729073044682374.445395886364
Winsorized Mean ( 5 / 16 )142964.040816327373.465215210326382.804167546937
Winsorized Mean ( 6 / 16 )142998.816326531364.353723429252392.472498923968
Winsorized Mean ( 7 / 16 )143003.959183673361.785328772398395.272963856526
Winsorized Mean ( 8 / 16 )142996.285714286359.253818521737398.036926378929
Winsorized Mean ( 9 / 16 )143021.448979592352.042415479953406.261980632661
Winsorized Mean ( 10 / 16 )143099337.302006675743424.245919584951
Winsorized Mean ( 11 / 16 )143112.693877551332.815747226765430.005776679913
Winsorized Mean ( 12 / 16 )143084.775510204326.195012914193438.647955503364
Winsorized Mean ( 13 / 16 )143103.081632653319.169475001501448.360801520823
Winsorized Mean ( 14 / 16 )143125.653061224302.225089494991473.573035582132
Winsorized Mean ( 15 / 16 )143276.571428571256.702488334272558.142511037915
Winsorized Mean ( 16 / 16 )143212.571428571207.662281840780689.641711335792
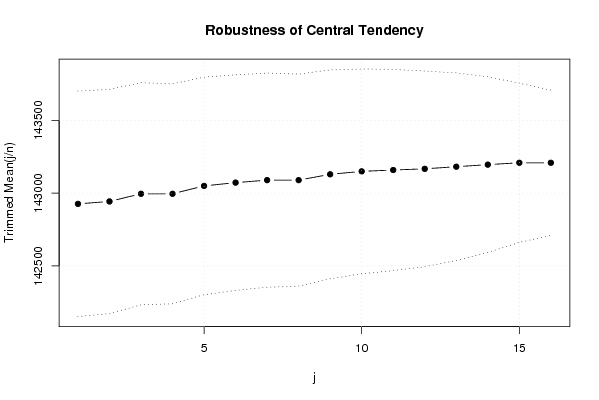
Trimmed Mean ( 1 / 16 )142926.102040816387.730838928524368.621960625536
Trimmed Mean ( 2 / 16 )142942.787234043385.28638212556371.003995639429
Trimmed Mean ( 3 / 16 )142995.604651163381.918577332336374.413849281627
Trimmed Mean ( 4 / 16 )142995.604651163378.041753042474378.253469359764
Trimmed Mean ( 5 / 16 )143049.564102564373.891982125951382.595966057319
Trimmed Mean ( 6 / 16 )143072.216216216370.568417643568386.088531575377
Trimmed Mean ( 7 / 16 )143089.342857143368.169523756773388.650699267746
Trimmed Mean ( 8 / 16 )143089.342857143364.507152450165392.555651913321
Trimmed Mean ( 9 / 16 )143129.419354839358.924479953783398.773077203507
Trimmed Mean ( 10 / 16 )143149.689655172352.083129120736406.579236024921
Trimmed Mean ( 11 / 16 )143158.888888889345.811590639069413.979440724724
Trimmed Mean ( 12 / 16 )143167.12336.367399926529425.627216047903
Trimmed Mean ( 13 / 16 )143181.739130435322.586325838755443.855574963225
Trimmed Mean ( 14 / 16 )143195.857142857301.771612519218474.517321054305
Trimmed Mean ( 15 / 16 )143208.789473684273.670091853551523.289879810176
Trimmed Mean ( 16 / 16 )143208.789473684249.789625152667573.317604308655
Median143086
Midrange142534
Midmean - Weighted Average at Xnp143059.375
Midmean - Weighted Average at X(n+1)p143167.12
Midmean - Empirical Distribution Function143167.12
Midmean - Empirical Distribution Function - Averaging143167.12
Midmean - Empirical Distribution Function - Interpolation143167.12
Midmean - Closest Observation143053.923076923
Midmean - True Basic - Statistics Graphics Toolkit143167.12
Midmean - MS Excel (old versions)143167.12
Number of observations49

\begin{tabular}{lllllllll}
\hline
Central Tendency - Ungrouped Data \tabularnewline
Measure & Value & S.E. & Value/S.E. \tabularnewline
Arithmetic Mean & 142926.102040816 & 390.783934600157 & 365.742010830245 \tabularnewline
Geometric Mean & 142900.380384599 &  &  \tabularnewline
Harmonic Mean & 142874.584416262 &  &  \tabularnewline
Quadratic Mean & 142951.742992493 &  &  \tabularnewline
Winsorized Mean ( 1 / 16 ) & 142919.061224490 & 389.088810412088 & 367.317325504999 \tabularnewline
Winsorized Mean ( 2 / 16 ) & 142921.265306122 & 388.362556317217 & 368.009899464622 \tabularnewline
Winsorized Mean ( 3 / 16 ) & 142927.877551020 & 385.894331471427 & 370.38086827042 \tabularnewline
Winsorized Mean ( 4 / 16 ) & 142936.693877551 & 381.729073044682 & 374.445395886364 \tabularnewline
Winsorized Mean ( 5 / 16 ) & 142964.040816327 & 373.465215210326 & 382.804167546937 \tabularnewline
Winsorized Mean ( 6 / 16 ) & 142998.816326531 & 364.353723429252 & 392.472498923968 \tabularnewline
Winsorized Mean ( 7 / 16 ) & 143003.959183673 & 361.785328772398 & 395.272963856526 \tabularnewline
Winsorized Mean ( 8 / 16 ) & 142996.285714286 & 359.253818521737 & 398.036926378929 \tabularnewline
Winsorized Mean ( 9 / 16 ) & 143021.448979592 & 352.042415479953 & 406.261980632661 \tabularnewline
Winsorized Mean ( 10 / 16 ) & 143099 & 337.302006675743 & 424.245919584951 \tabularnewline
Winsorized Mean ( 11 / 16 ) & 143112.693877551 & 332.815747226765 & 430.005776679913 \tabularnewline
Winsorized Mean ( 12 / 16 ) & 143084.775510204 & 326.195012914193 & 438.647955503364 \tabularnewline
Winsorized Mean ( 13 / 16 ) & 143103.081632653 & 319.169475001501 & 448.360801520823 \tabularnewline
Winsorized Mean ( 14 / 16 ) & 143125.653061224 & 302.225089494991 & 473.573035582132 \tabularnewline
Winsorized Mean ( 15 / 16 ) & 143276.571428571 & 256.702488334272 & 558.142511037915 \tabularnewline
Winsorized Mean ( 16 / 16 ) & 143212.571428571 & 207.662281840780 & 689.641711335792 \tabularnewline
Trimmed Mean ( 1 / 16 ) & 142926.102040816 & 387.730838928524 & 368.621960625536 \tabularnewline
Trimmed Mean ( 2 / 16 ) & 142942.787234043 & 385.28638212556 & 371.003995639429 \tabularnewline
Trimmed Mean ( 3 / 16 ) & 142995.604651163 & 381.918577332336 & 374.413849281627 \tabularnewline
Trimmed Mean ( 4 / 16 ) & 142995.604651163 & 378.041753042474 & 378.253469359764 \tabularnewline
Trimmed Mean ( 5 / 16 ) & 143049.564102564 & 373.891982125951 & 382.595966057319 \tabularnewline
Trimmed Mean ( 6 / 16 ) & 143072.216216216 & 370.568417643568 & 386.088531575377 \tabularnewline
Trimmed Mean ( 7 / 16 ) & 143089.342857143 & 368.169523756773 & 388.650699267746 \tabularnewline
Trimmed Mean ( 8 / 16 ) & 143089.342857143 & 364.507152450165 & 392.555651913321 \tabularnewline
Trimmed Mean ( 9 / 16 ) & 143129.419354839 & 358.924479953783 & 398.773077203507 \tabularnewline
Trimmed Mean ( 10 / 16 ) & 143149.689655172 & 352.083129120736 & 406.579236024921 \tabularnewline
Trimmed Mean ( 11 / 16 ) & 143158.888888889 & 345.811590639069 & 413.979440724724 \tabularnewline
Trimmed Mean ( 12 / 16 ) & 143167.12 & 336.367399926529 & 425.627216047903 \tabularnewline
Trimmed Mean ( 13 / 16 ) & 143181.739130435 & 322.586325838755 & 443.855574963225 \tabularnewline
Trimmed Mean ( 14 / 16 ) & 143195.857142857 & 301.771612519218 & 474.517321054305 \tabularnewline
Trimmed Mean ( 15 / 16 ) & 143208.789473684 & 273.670091853551 & 523.289879810176 \tabularnewline
Trimmed Mean ( 16 / 16 ) & 143208.789473684 & 249.789625152667 & 573.317604308655 \tabularnewline
Median & 143086 &  &  \tabularnewline
Midrange & 142534 &  &  \tabularnewline
Midmean - Weighted Average at Xnp & 143059.375 &  &  \tabularnewline
Midmean - Weighted Average at X(n+1)p & 143167.12 &  &  \tabularnewline
Midmean - Empirical Distribution Function & 143167.12 &  &  \tabularnewline
Midmean - Empirical Distribution Function - Averaging & 143167.12 &  &  \tabularnewline
Midmean - Empirical Distribution Function - Interpolation & 143167.12 &  &  \tabularnewline
Midmean - Closest Observation & 143053.923076923 &  &  \tabularnewline
Midmean - True Basic - Statistics Graphics Toolkit & 143167.12 &  &  \tabularnewline
Midmean - MS Excel (old versions) & 143167.12 &  &  \tabularnewline
Number of observations & 49 &  &  \tabularnewline
\hline
\end{tabular}
%Source: https://freestatistics.org/blog/index.php?pk=10395&T=1

[TABLE]
[ROW][C]Central Tendency - Ungrouped Data[/C][/ROW]
[ROW][C]Measure[/C][C]Value[/C][C]S.E.[/C][C]Value/S.E.[/C][/ROW]
[ROW][C]Arithmetic Mean[/C][C]142926.102040816[/C][C]390.783934600157[/C][C]365.742010830245[/C][/ROW]
[ROW][C]Geometric Mean[/C][C]142900.380384599[/C][C][/C][C][/C][/ROW]
[ROW][C]Harmonic Mean[/C][C]142874.584416262[/C][C][/C][C][/C][/ROW]
[ROW][C]Quadratic Mean[/C][C]142951.742992493[/C][C][/C][C][/C][/ROW]
[ROW][C]Winsorized Mean ( 1 / 16 )[/C][C]142919.061224490[/C][C]389.088810412088[/C][C]367.317325504999[/C][/ROW]
[ROW][C]Winsorized Mean ( 2 / 16 )[/C][C]142921.265306122[/C][C]388.362556317217[/C][C]368.009899464622[/C][/ROW]
[ROW][C]Winsorized Mean ( 3 / 16 )[/C][C]142927.877551020[/C][C]385.894331471427[/C][C]370.38086827042[/C][/ROW]
[ROW][C]Winsorized Mean ( 4 / 16 )[/C][C]142936.693877551[/C][C]381.729073044682[/C][C]374.445395886364[/C][/ROW]
[ROW][C]Winsorized Mean ( 5 / 16 )[/C][C]142964.040816327[/C][C]373.465215210326[/C][C]382.804167546937[/C][/ROW]
[ROW][C]Winsorized Mean ( 6 / 16 )[/C][C]142998.816326531[/C][C]364.353723429252[/C][C]392.472498923968[/C][/ROW]
[ROW][C]Winsorized Mean ( 7 / 16 )[/C][C]143003.959183673[/C][C]361.785328772398[/C][C]395.272963856526[/C][/ROW]
[ROW][C]Winsorized Mean ( 8 / 16 )[/C][C]142996.285714286[/C][C]359.253818521737[/C][C]398.036926378929[/C][/ROW]
[ROW][C]Winsorized Mean ( 9 / 16 )[/C][C]143021.448979592[/C][C]352.042415479953[/C][C]406.261980632661[/C][/ROW]
[ROW][C]Winsorized Mean ( 10 / 16 )[/C][C]143099[/C][C]337.302006675743[/C][C]424.245919584951[/C][/ROW]
[ROW][C]Winsorized Mean ( 11 / 16 )[/C][C]143112.693877551[/C][C]332.815747226765[/C][C]430.005776679913[/C][/ROW]
[ROW][C]Winsorized Mean ( 12 / 16 )[/C][C]143084.775510204[/C][C]326.195012914193[/C][C]438.647955503364[/C][/ROW]
[ROW][C]Winsorized Mean ( 13 / 16 )[/C][C]143103.081632653[/C][C]319.169475001501[/C][C]448.360801520823[/C][/ROW]
[ROW][C]Winsorized Mean ( 14 / 16 )[/C][C]143125.653061224[/C][C]302.225089494991[/C][C]473.573035582132[/C][/ROW]
[ROW][C]Winsorized Mean ( 15 / 16 )[/C][C]143276.571428571[/C][C]256.702488334272[/C][C]558.142511037915[/C][/ROW]
[ROW][C]Winsorized Mean ( 16 / 16 )[/C][C]143212.571428571[/C][C]207.662281840780[/C][C]689.641711335792[/C][/ROW]
[ROW][C]Trimmed Mean ( 1 / 16 )[/C][C]142926.102040816[/C][C]387.730838928524[/C][C]368.621960625536[/C][/ROW]
[ROW][C]Trimmed Mean ( 2 / 16 )[/C][C]142942.787234043[/C][C]385.28638212556[/C][C]371.003995639429[/C][/ROW]
[ROW][C]Trimmed Mean ( 3 / 16 )[/C][C]142995.604651163[/C][C]381.918577332336[/C][C]374.413849281627[/C][/ROW]
[ROW][C]Trimmed Mean ( 4 / 16 )[/C][C]142995.604651163[/C][C]378.041753042474[/C][C]378.253469359764[/C][/ROW]
[ROW][C]Trimmed Mean ( 5 / 16 )[/C][C]143049.564102564[/C][C]373.891982125951[/C][C]382.595966057319[/C][/ROW]
[ROW][C]Trimmed Mean ( 6 / 16 )[/C][C]143072.216216216[/C][C]370.568417643568[/C][C]386.088531575377[/C][/ROW]
[ROW][C]Trimmed Mean ( 7 / 16 )[/C][C]143089.342857143[/C][C]368.169523756773[/C][C]388.650699267746[/C][/ROW]
[ROW][C]Trimmed Mean ( 8 / 16 )[/C][C]143089.342857143[/C][C]364.507152450165[/C][C]392.555651913321[/C][/ROW]
[ROW][C]Trimmed Mean ( 9 / 16 )[/C][C]143129.419354839[/C][C]358.924479953783[/C][C]398.773077203507[/C][/ROW]
[ROW][C]Trimmed Mean ( 10 / 16 )[/C][C]143149.689655172[/C][C]352.083129120736[/C][C]406.579236024921[/C][/ROW]
[ROW][C]Trimmed Mean ( 11 / 16 )[/C][C]143158.888888889[/C][C]345.811590639069[/C][C]413.979440724724[/C][/ROW]
[ROW][C]Trimmed Mean ( 12 / 16 )[/C][C]143167.12[/C][C]336.367399926529[/C][C]425.627216047903[/C][/ROW]
[ROW][C]Trimmed Mean ( 13 / 16 )[/C][C]143181.739130435[/C][C]322.586325838755[/C][C]443.855574963225[/C][/ROW]
[ROW][C]Trimmed Mean ( 14 / 16 )[/C][C]143195.857142857[/C][C]301.771612519218[/C][C]474.517321054305[/C][/ROW]
[ROW][C]Trimmed Mean ( 15 / 16 )[/C][C]143208.789473684[/C][C]273.670091853551[/C][C]523.289879810176[/C][/ROW]
[ROW][C]Trimmed Mean ( 16 / 16 )[/C][C]143208.789473684[/C][C]249.789625152667[/C][C]573.317604308655[/C][/ROW]
[ROW][C]Median[/C][C]143086[/C][C][/C][C][/C][/ROW]
[ROW][C]Midrange[/C][C]142534[/C][C][/C][C][/C][/ROW]
[ROW][C]Midmean - Weighted Average at Xnp[/C][C]143059.375[/C][C][/C][C][/C][/ROW]
[ROW][C]Midmean - Weighted Average at X(n+1)p[/C][C]143167.12[/C][C][/C][C][/C][/ROW]
[ROW][C]Midmean - Empirical Distribution Function[/C][C]143167.12[/C][C][/C][C][/C][/ROW]
[ROW][C]Midmean - Empirical Distribution Function - Averaging[/C][C]143167.12[/C][C][/C][C][/C][/ROW]
[ROW][C]Midmean - Empirical Distribution Function - Interpolation[/C][C]143167.12[/C][C][/C][C][/C][/ROW]
[ROW][C]Midmean - Closest Observation[/C][C]143053.923076923[/C][C][/C][C][/C][/ROW]
[ROW][C]Midmean - True Basic - Statistics Graphics Toolkit[/C][C]143167.12[/C][C][/C][C][/C][/ROW]
[ROW][C]Midmean - MS Excel (old versions)[/C][C]143167.12[/C][C][/C][C][/C][/ROW]
[ROW][C]Number of observations[/C][C]49[/C][C][/C][C][/C][/ROW]
[/TABLE]
Source: https://freestatistics.org/blog/index.php?pk=10395&T=1

Globally Unique Identifier (entire table): ba.freestatistics.org/blog/index.php?pk=10395&T=1

As an alternative you can also use a QR Code:  

The GUIDs for individual cells are displayed in the table below:

Central Tendency - Ungrouped Data
MeasureValueS.E.Value/S.E.
Arithmetic Mean142926.102040816390.783934600157365.742010830245
Geometric Mean142900.380384599
Harmonic Mean142874.584416262
Quadratic Mean142951.742992493
Winsorized Mean ( 1 / 16 )142919.061224490389.088810412088367.317325504999
Winsorized Mean ( 2 / 16 )142921.265306122388.362556317217368.009899464622
Winsorized Mean ( 3 / 16 )142927.877551020385.894331471427370.38086827042
Winsorized Mean ( 4 / 16 )142936.693877551381.729073044682374.445395886364
Winsorized Mean ( 5 / 16 )142964.040816327373.465215210326382.804167546937
Winsorized Mean ( 6 / 16 )142998.816326531364.353723429252392.472498923968
Winsorized Mean ( 7 / 16 )143003.959183673361.785328772398395.272963856526
Winsorized Mean ( 8 / 16 )142996.285714286359.253818521737398.036926378929
Winsorized Mean ( 9 / 16 )143021.448979592352.042415479953406.261980632661
Winsorized Mean ( 10 / 16 )143099337.302006675743424.245919584951
Winsorized Mean ( 11 / 16 )143112.693877551332.815747226765430.005776679913
Winsorized Mean ( 12 / 16 )143084.775510204326.195012914193438.647955503364
Winsorized Mean ( 13 / 16 )143103.081632653319.169475001501448.360801520823
Winsorized Mean ( 14 / 16 )143125.653061224302.225089494991473.573035582132
Winsorized Mean ( 15 / 16 )143276.571428571256.702488334272558.142511037915
Winsorized Mean ( 16 / 16 )143212.571428571207.662281840780689.641711335792
Trimmed Mean ( 1 / 16 )142926.102040816387.730838928524368.621960625536
Trimmed Mean ( 2 / 16 )142942.787234043385.28638212556371.003995639429
Trimmed Mean ( 3 / 16 )142995.604651163381.918577332336374.413849281627
Trimmed Mean ( 4 / 16 )142995.604651163378.041753042474378.253469359764
Trimmed Mean ( 5 / 16 )143049.564102564373.891982125951382.595966057319
Trimmed Mean ( 6 / 16 )143072.216216216370.568417643568386.088531575377
Trimmed Mean ( 7 / 16 )143089.342857143368.169523756773388.650699267746
Trimmed Mean ( 8 / 16 )143089.342857143364.507152450165392.555651913321
Trimmed Mean ( 9 / 16 )143129.419354839358.924479953783398.773077203507
Trimmed Mean ( 10 / 16 )143149.689655172352.083129120736406.579236024921
Trimmed Mean ( 11 / 16 )143158.888888889345.811590639069413.979440724724
Trimmed Mean ( 12 / 16 )143167.12336.367399926529425.627216047903
Trimmed Mean ( 13 / 16 )143181.739130435322.586325838755443.855574963225
Trimmed Mean ( 14 / 16 )143195.857142857301.771612519218474.517321054305
Trimmed Mean ( 15 / 16 )143208.789473684273.670091853551523.289879810176
Trimmed Mean ( 16 / 16 )143208.789473684249.789625152667573.317604308655
Median143086
Midrange142534
Midmean - Weighted Average at Xnp143059.375
Midmean - Weighted Average at X(n+1)p143167.12
Midmean - Empirical Distribution Function143167.12
Midmean - Empirical Distribution Function - Averaging143167.12
Midmean - Empirical Distribution Function - Interpolation143167.12
Midmean - Closest Observation143053.923076923
Midmean - True Basic - Statistics Graphics Toolkit143167.12
Midmean - MS Excel (old versions)143167.12
Number of observations49


Parameters (Session):
Parameters (R input):
R code (references can be found in the software module):
geomean <- function(x) {
return(exp(mean(log(x))))
}
harmean <- function(x) {
return(1/mean(1/x))
}
quamean <- function(x) {
return(sqrt(mean(x*x)))
}
winmean <- function(x) {
x <-sort(x[!is.na(x)])
n<-length(x)
denom <- 3
nodenom <- n/denom
if (nodenom>40) denom <- n/40
sqrtn = sqrt(n)
roundnodenom = floor(nodenom)
win <- array(NA,dim=c(roundnodenom,2))
for (j in 1:roundnodenom) {
win[j,1] <- (j*x[j+1]+sum(x[(j+1):(n-j)])+j*x[n-j])/n
win[j,2] <- sd(c(rep(x[j+1],j),x[(j+1):(n-j)],rep(x[n-j],j)))/sqrtn
}
return(win)
}
trimean <- function(x) {
x <-sort(x[!is.na(x)])
n<-length(x)
denom <- 3
nodenom <- n/denom
if (nodenom>40) denom <- n/40
sqrtn = sqrt(n)
roundnodenom = floor(nodenom)
tri <- array(NA,dim=c(roundnodenom,2))
for (j in 1:roundnodenom) {
tri[j,1] <- mean(x,trim=j/n)
tri[j,2] <- sd(x[(j+1):(n-j)]) / sqrt(n-j*2)
}
return(tri)
}
midrange <- function(x) {
return((max(x)+min(x))/2)
}
q1 <- function(data,n,p,i,f) {
np <- n*p;
i <<- floor(np)
f <<- np - i
qvalue <- (1-f)*data[i] + f*data[i+1]
}
q2 <- function(data,n,p,i,f) {
np <- (n+1)*p
i <<- floor(np)
f <<- np - i
qvalue <- (1-f)*data[i] + f*data[i+1]
}
q3 <- function(data,n,p,i,f) {
np <- n*p
i <<- floor(np)
f <<- np - i
if (f==0) {
qvalue <- data[i]
} else {
qvalue <- data[i+1]
}
}
q4 <- function(data,n,p,i,f) {
np <- n*p
i <<- floor(np)
f <<- np - i
if (f==0) {
qvalue <- (data[i]+data[i+1])/2
} else {
qvalue <- data[i+1]
}
}
q5 <- function(data,n,p,i,f) {
np <- (n-1)*p
i <<- floor(np)
f <<- np - i
if (f==0) {
qvalue <- data[i+1]
} else {
qvalue <- data[i+1] + f*(data[i+2]-data[i+1])
}
}
q6 <- function(data,n,p,i,f) {
np <- n*p+0.5
i <<- floor(np)
f <<- np - i
qvalue <- data[i]
}
q7 <- function(data,n,p,i,f) {
np <- (n+1)*p
i <<- floor(np)
f <<- np - i
if (f==0) {
qvalue <- data[i]
} else {
qvalue <- f*data[i] + (1-f)*data[i+1]
}
}
q8 <- function(data,n,p,i,f) {
np <- (n+1)*p
i <<- floor(np)
f <<- np - i
if (f==0) {
qvalue <- data[i]
} else {
if (f == 0.5) {
qvalue <- (data[i]+data[i+1])/2
} else {
if (f < 0.5) {
qvalue <- data[i]
} else {
qvalue <- data[i+1]
}
}
}
}
midmean <- function(x,def) {
x <-sort(x[!is.na(x)])
n<-length(x)
if (def==1) {
qvalue1 <- q1(x,n,0.25,i,f)
qvalue3 <- q1(x,n,0.75,i,f)
}
if (def==2) {
qvalue1 <- q2(x,n,0.25,i,f)
qvalue3 <- q2(x,n,0.75,i,f)
}
if (def==3) {
qvalue1 <- q3(x,n,0.25,i,f)
qvalue3 <- q3(x,n,0.75,i,f)
}
if (def==4) {
qvalue1 <- q4(x,n,0.25,i,f)
qvalue3 <- q4(x,n,0.75,i,f)
}
if (def==5) {
qvalue1 <- q5(x,n,0.25,i,f)
qvalue3 <- q5(x,n,0.75,i,f)
}
if (def==6) {
qvalue1 <- q6(x,n,0.25,i,f)
qvalue3 <- q6(x,n,0.75,i,f)
}
if (def==7) {
qvalue1 <- q7(x,n,0.25,i,f)
qvalue3 <- q7(x,n,0.75,i,f)
}
if (def==8) {
qvalue1 <- q8(x,n,0.25,i,f)
qvalue3 <- q8(x,n,0.75,i,f)
}
midm <- 0
myn <- 0
roundno4 <- round(n/4)
round3no4 <- round(3*n/4)
for (i in 1:n) {
if ((x[i]>=qvalue1) & (x[i]<=qvalue3)){
midm = midm + x[i]
myn = myn + 1
}
}
midm = midm / myn
return(midm)
}
(arm <- mean(x))
sqrtn <- sqrt(length(x))
(armse <- sd(x) / sqrtn)
(armose <- arm / armse)
(geo <- geomean(x))
(har <- harmean(x))
(qua <- quamean(x))
(win <- winmean(x))
(tri <- trimean(x))
(midr <- midrange(x))
midm <- array(NA,dim=8)
for (j in 1:8) midm[j] <- midmean(x,j)
midm
bitmap(file='test1.png')
lb <- win[,1] - 2*win[,2]
ub <- win[,1] + 2*win[,2]
if ((ylimmin == '') | (ylimmax == '')) plot(win[,1],type='b',main=main, xlab='j', pch=19, ylab='Winsorized Mean(j/n)', ylim=c(min(lb),max(ub))) else plot(win[,1],type='l',main=main, xlab='j', pch=19, ylab='Winsorized Mean(j/n)', ylim=c(ylimmin,ylimmax))
lines(ub,lty=3)
lines(lb,lty=3)
grid()
dev.off()
bitmap(file='test2.png')
lb <- tri[,1] - 2*tri[,2]
ub <- tri[,1] + 2*tri[,2]
if ((ylimmin == '') | (ylimmax == '')) plot(tri[,1],type='b',main=main, xlab='j', pch=19, ylab='Trimmed Mean(j/n)', ylim=c(min(lb),max(ub))) else plot(tri[,1],type='l',main=main, xlab='j', pch=19, ylab='Trimmed Mean(j/n)', ylim=c(ylimmin,ylimmax))
lines(ub,lty=3)
lines(lb,lty=3)
grid()
dev.off()
load(file='createtable')
a<-table.start()
a<-table.row.start(a)
a<-table.element(a,'Central Tendency - Ungrouped Data',4,TRUE)
a<-table.row.end(a)
a<-table.row.start(a)
a<-table.element(a,'Measure',header=TRUE)
a<-table.element(a,'Value',header=TRUE)
a<-table.element(a,'S.E.',header=TRUE)
a<-table.element(a,'Value/S.E.',header=TRUE)
a<-table.row.end(a)
a<-table.row.start(a)
a<-table.element(a,hyperlink('arithmetic_mean.htm', 'Arithmetic Mean', 'click to view the definition of the Arithmetic Mean'),header=TRUE)
a<-table.element(a,arm)
a<-table.element(a,hyperlink('arithmetic_mean_standard_error.htm', armse, 'click to view the definition of the Standard Error of the Arithmetic Mean'))
a<-table.element(a,armose)
a<-table.row.end(a)
a<-table.row.start(a)
a<-table.element(a,hyperlink('geometric_mean.htm', 'Geometric Mean', 'click to view the definition of the Geometric Mean'),header=TRUE)
a<-table.element(a,geo)
a<-table.element(a,'')
a<-table.row.end(a)
a<-table.row.start(a)
a<-table.element(a,hyperlink('harmonic_mean.htm', 'Harmonic Mean', 'click to view the definition of the Harmonic Mean'),header=TRUE)
a<-table.element(a,har)
a<-table.element(a,'')
a<-table.row.end(a)
a<-table.row.start(a)
a<-table.element(a,hyperlink('quadratic_mean.htm', 'Quadratic Mean', 'click to view the definition of the Quadratic Mean'),header=TRUE)
a<-table.element(a,qua)
a<-table.element(a,'')
a<-table.row.end(a)
for (j in 1:length(win[,1])) {
a<-table.row.start(a)
mylabel <- paste('Winsorized Mean (',j)
mylabel <- paste(mylabel,'/')
mylabel <- paste(mylabel,length(win[,1]))
mylabel <- paste(mylabel,')')
a<-table.element(a,hyperlink('winsorized_mean.htm', mylabel, 'click to view the definition of the Winsorized Mean'),header=TRUE)
a<-table.element(a,win[j,1])
a<-table.element(a,win[j,2])
a<-table.element(a,win[j,1]/win[j,2])
a<-table.row.end(a)
}
for (j in 1:length(tri[,1])) {
a<-table.row.start(a)
mylabel <- paste('Trimmed Mean (',j)
mylabel <- paste(mylabel,'/')
mylabel <- paste(mylabel,length(tri[,1]))
mylabel <- paste(mylabel,')')
a<-table.element(a,hyperlink('arithmetic_mean.htm', mylabel, 'click to view the definition of the Trimmed Mean'),header=TRUE)
a<-table.element(a,tri[j,1])
a<-table.element(a,tri[j,2])
a<-table.element(a,tri[j,1]/tri[j,2])
a<-table.row.end(a)
}
a<-table.row.start(a)
a<-table.element(a,hyperlink('median_1.htm', 'Median', 'click to view the definition of the Median'),header=TRUE)
a<-table.element(a,median(x))
a<-table.element(a,'')
a<-table.row.end(a)
a<-table.row.start(a)
a<-table.element(a,hyperlink('midrange.htm', 'Midrange', 'click to view the definition of the Midrange'),header=TRUE)
a<-table.element(a,midr)
a<-table.element(a,'')
a<-table.row.end(a)
a<-table.row.start(a)
mymid <- hyperlink('midmean.htm', 'Midmean', 'click to view the definition of the Midmean')
mylabel <- paste(mymid,hyperlink('method_1.htm','Weighted Average at Xnp',''),sep=' - ')
a<-table.element(a,mylabel,header=TRUE)
a<-table.element(a,midm[1])
a<-table.element(a,'')
a<-table.row.end(a)
a<-table.row.start(a)
mymid <- hyperlink('midmean.htm', 'Midmean', 'click to view the definition of the Midmean')
mylabel <- paste(mymid,hyperlink('method_2.htm','Weighted Average at X(n+1)p',''),sep=' - ')
a<-table.element(a,mylabel,header=TRUE)
a<-table.element(a,midm[2])
a<-table.element(a,'')
a<-table.row.end(a)
a<-table.row.start(a)
mymid <- hyperlink('midmean.htm', 'Midmean', 'click to view the definition of the Midmean')
mylabel <- paste(mymid,hyperlink('method_3.htm','Empirical Distribution Function',''),sep=' - ')
a<-table.element(a,mylabel,header=TRUE)
a<-table.element(a,midm[3])
a<-table.element(a,'')
a<-table.row.end(a)
a<-table.row.start(a)
mymid <- hyperlink('midmean.htm', 'Midmean', 'click to view the definition of the Midmean')
mylabel <- paste(mymid,hyperlink('method_4.htm','Empirical Distribution Function - Averaging',''),sep=' - ')
a<-table.element(a,mylabel,header=TRUE)
a<-table.element(a,midm[4])
a<-table.element(a,'')
a<-table.row.end(a)
a<-table.row.start(a)
mymid <- hyperlink('midmean.htm', 'Midmean', 'click to view the definition of the Midmean')
mylabel <- paste(mymid,hyperlink('method_5.htm','Empirical Distribution Function - Interpolation',''),sep=' - ')
a<-table.element(a,mylabel,header=TRUE)
a<-table.element(a,midm[5])
a<-table.element(a,'')
a<-table.row.end(a)
a<-table.row.start(a)
mymid <- hyperlink('midmean.htm', 'Midmean', 'click to view the definition of the Midmean')
mylabel <- paste(mymid,hyperlink('method_6.htm','Closest Observation',''),sep=' - ')
a<-table.element(a,mylabel,header=TRUE)
a<-table.element(a,midm[6])
a<-table.element(a,'')
a<-table.row.end(a)
a<-table.row.start(a)
mymid <- hyperlink('midmean.htm', 'Midmean', 'click to view the definition of the Midmean')
mylabel <- paste(mymid,hyperlink('method_7.htm','True Basic - Statistics Graphics Toolkit',''),sep=' - ')
a<-table.element(a,mylabel,header=TRUE)
a<-table.element(a,midm[7])
a<-table.element(a,'')
a<-table.row.end(a)
a<-table.row.start(a)
mymid <- hyperlink('midmean.htm', 'Midmean', 'click to view the definition of the Midmean')
mylabel <- paste(mymid,hyperlink('method_8.htm','MS Excel (old versions)',''),sep=' - ')
a<-table.element(a,mylabel,header=TRUE)
a<-table.element(a,midm[8])
a<-table.element(a,'')
a<-table.row.end(a)
a<-table.row.start(a)
a<-table.element(a,'Number of observations',header=TRUE)
a<-table.element(a,length(x))
a<-table.element(a,'')
a<-table.row.end(a)
a<-table.end(a)
table.save(a,file='mytable.tab')