Free Statistics

of Irreproducible Research!

Author's title

Author*Unverified author*
R Software Modulerwasp_centraltendency.wasp
Title produced by softwareCentral Tendency
Date of computationSun, 20 Apr 2008 13:09:23 -0600
Cite this page as followsStatistical Computations at FreeStatistics.org, Office for Research Development and Education, URL https://freestatistics.org/blog/index.php?v=date/2008/Apr/20/t1208718714gu5ucokhhdskt9t.htm/, Retrieved Mon, 13 May 2024 11:07:54 +0000
Statistical Computations at FreeStatistics.org, Office for Research Development and Education, URL https://freestatistics.org/blog/index.php?pk=10433, Retrieved Mon, 13 May 2024 11:07:54 +0000
QR Codes:

Original text written by user:
IsPrivate?No (this computation is public)
User-defined keywords
Estimated Impact188
Family? (F = Feedback message, R = changed R code, M = changed R Module, P = changed Parameters, D = changed Data)
-       [Central Tendency] [centrummaten auto...] [2008-04-20 19:09:23] [7447f24868087d6abebd401b46b50271] [Current]
Feedback Forum

Post a new message
Dataseries X:
209
214
265
290
287
270
263
265
252
281
259
312
275
250
312
331
256
247
291
318
296
291
313
311
273
258
361
391
446
433
449
479
460
466
410
415
382
409
496
471
488
584
610
684
626
580
444
552
473
431
513
467
470
455
406
424
406
373
332
310
301
296
333
374
422
424
341
216
319
383
360
400


Summary of compuational transaction
Raw Inputview raw input (R code)
Raw Outputview raw output of R engine
Computing time3 seconds
R Server'Sir Ronald Aylmer Fisher' @ 193.190.124.24

\begin{tabular}{lllllllll}
\hline
Summary of compuational transaction \tabularnewline
Raw Input & view raw input (R code)  \tabularnewline
Raw Output & view raw output of R engine  \tabularnewline
Computing time & 3 seconds \tabularnewline
R Server & 'Sir Ronald Aylmer Fisher' @ 193.190.124.24 \tabularnewline
\hline
\end{tabular}
%Source: https://freestatistics.org/blog/index.php?pk=10433&T=0

[TABLE]
[ROW][C]Summary of compuational transaction[/C][/ROW]
[ROW][C]Raw Input[/C][C]view raw input (R code) [/C][/ROW]
[ROW][C]Raw Output[/C][C]view raw output of R engine [/C][/ROW]
[ROW][C]Computing time[/C][C]3 seconds[/C][/ROW]
[ROW][C]R Server[/C][C]'Sir Ronald Aylmer Fisher' @ 193.190.124.24[/C][/ROW]
[/TABLE]
Source: https://freestatistics.org/blog/index.php?pk=10433&T=0

Globally Unique Identifier (entire table): ba.freestatistics.org/blog/index.php?pk=10433&T=0

As an alternative you can also use a QR Code:  

The GUIDs for individual cells are displayed in the table below:

Summary of compuational transaction
Raw Inputview raw input (R code)
Raw Outputview raw output of R engine
Computing time3 seconds
R Server'Sir Ronald Aylmer Fisher' @ 193.190.124.24


Central Tendency - Ungrouped Data
MeasureValueS.E.Value/S.E.
Arithmetic Mean375.7512.562375669936529.9107437854466
Geometric Mean361.581122572469
Harmonic Mean348.234512708424
Quadratic Mean390.375211246252
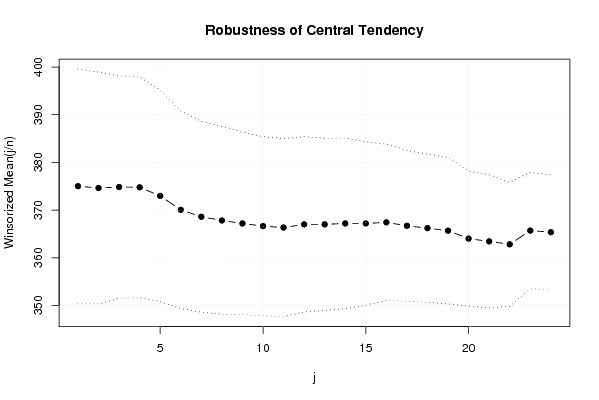
Winsorized Mean ( 1 / 24 )375.01388888888912.294213638491530.503283895667
Winsorized Mean ( 2 / 24 )374.62512.159484623722930.8092827609744
Winsorized Mean ( 3 / 24 )374.83333333333311.655846760028732.1583957862888
Winsorized Mean ( 4 / 24 )374.77777777777811.574488672803832.3796401182180
Winsorized Mean ( 5 / 24 )372.97222222222211.088948456220733.6345888606770
Winsorized Mean ( 6 / 24 )370.05555555555610.350033621487435.7540438117317
Winsorized Mean ( 7 / 24 )368.59722222222210.010727026713636.8202250684314
Winsorized Mean ( 8 / 24 )367.8194444444449.837258037281237.3904438666226
Winsorized Mean ( 9 / 24 )367.1944444444449.5705648535168138.3670608855981
Winsorized Mean ( 10 / 24 )366.6388888888899.3930705978650639.0329110240289
Winsorized Mean ( 11 / 24 )366.3333333333339.3446025193226639.2026661996413
Winsorized Mean ( 12 / 24 )3679.1927286363140139.922858002165
Winsorized Mean ( 13 / 24 )3679.0277567111828440.6524025559296
Winsorized Mean ( 14 / 24 )367.1944444444448.940698362109441.0699958294770
Winsorized Mean ( 15 / 24 )367.1944444444448.5686639970991642.8531734432292
Winsorized Mean ( 16 / 24 )367.4166666666678.2140226583332444.7304179632275
Winsorized Mean ( 17 / 24 )366.7083333333337.9065214831812346.3804890827649
Winsorized Mean ( 18 / 24 )366.2083333333337.7631189760499447.1728353594896
Winsorized Mean ( 19 / 24 )365.6805555555567.6870474761244547.5710026107344
Winsorized Mean ( 20 / 24 )364.0138888888897.0682314309621751.4999957831513
Winsorized Mean ( 21 / 24 )363.4305555555566.9884161471712752.0047100661947
Winsorized Mean ( 22 / 24 )362.8194444444446.4944699718102755.8659053039416
Winsorized Mean ( 23 / 24 )365.6944444444446.1171607202478459.7817290028025
Winsorized Mean ( 24 / 24 )365.3611111111115.9852879604988261.0431968390475
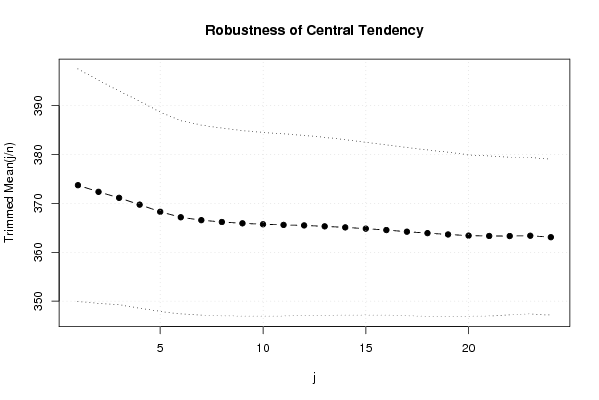
Trimmed Mean ( 1 / 24 )373.72857142857111.897003144546731.4136734174
Trimmed Mean ( 2 / 24 )372.36764705882411.421678639217732.6018319041350
Trimmed Mean ( 3 / 24 )371.13636363636410.938818760747633.9283767062797
Trimmed Mean ( 4 / 24 )369.7510.593592702629634.9031731140862
Trimmed Mean ( 5 / 24 )368.29032258064510.204295688614436.0916944999518
Trimmed Mean ( 6 / 24 )367.1666666666679.8929629348787737.1139232082007
Trimmed Mean ( 7 / 24 )366.5689655172419.7273201578075837.6844762555715
Trimmed Mean ( 8 / 24 )366.1964285714299.6070327203651738.1175373531474
Trimmed Mean ( 9 / 24 )365.9259259259269.4934179210543538.5452245933871
Trimmed Mean ( 10 / 24 )365.7307692307699.4045220094754738.8888205973977
Trimmed Mean ( 11 / 24 )365.69.321951271606439.2192567143722
Trimmed Mean ( 12 / 24 )365.59.2174287579455439.6531407617265
Trimmed Mean ( 13 / 24 )365.3043478260879.1056530493049440.1184127978577
Trimmed Mean ( 14 / 24 )365.0909090909098.9857073604279940.6301801791061
Trimmed Mean ( 15 / 24 )364.8333333333338.8366198168230241.2865259449964
Trimmed Mean ( 16 / 24 )364.558.7110267580513841.8492572833685
Trimmed Mean ( 17 / 24 )364.2105263157898.6077934430592542.3117177154692
Trimmed Mean ( 18 / 24 )363.9166666666678.520598291088242.7102245915397
Trimmed Mean ( 19 / 24 )363.6470588235298.4133289497046243.2227315724172
Trimmed Mean ( 20 / 24 )363.406258.2601183521504243.9952836638704
Trimmed Mean ( 21 / 24 )363.3333333333338.1858208406517844.3856933111675
Trimmed Mean ( 22 / 24 )363.3214285714298.0658752024536745.0442660532244
Trimmed Mean ( 23 / 24 )363.3846153846158.0017453717350245.4131690653664
Trimmed Mean ( 24 / 24 )363.0833333333337.9732152758939645.5378816160992
Median367
Midrange446.5
Midmean - Weighted Average at Xnp361.918918918919
Midmean - Weighted Average at X(n+1)p363.916666666667
Midmean - Empirical Distribution Function361.918918918919
Midmean - Empirical Distribution Function - Averaging363.916666666667
Midmean - Empirical Distribution Function - Interpolation363.916666666667
Midmean - Closest Observation361.918918918919
Midmean - True Basic - Statistics Graphics Toolkit363.916666666667
Midmean - MS Excel (old versions)364.210526315789
Number of observations72

\begin{tabular}{lllllllll}
\hline
Central Tendency - Ungrouped Data \tabularnewline
Measure & Value & S.E. & Value/S.E. \tabularnewline
Arithmetic Mean & 375.75 & 12.5623756699365 & 29.9107437854466 \tabularnewline
Geometric Mean & 361.581122572469 &  &  \tabularnewline
Harmonic Mean & 348.234512708424 &  &  \tabularnewline
Quadratic Mean & 390.375211246252 &  &  \tabularnewline
Winsorized Mean ( 1 / 24 ) & 375.013888888889 & 12.2942136384915 & 30.503283895667 \tabularnewline
Winsorized Mean ( 2 / 24 ) & 374.625 & 12.1594846237229 & 30.8092827609744 \tabularnewline
Winsorized Mean ( 3 / 24 ) & 374.833333333333 & 11.6558467600287 & 32.1583957862888 \tabularnewline
Winsorized Mean ( 4 / 24 ) & 374.777777777778 & 11.5744886728038 & 32.3796401182180 \tabularnewline
Winsorized Mean ( 5 / 24 ) & 372.972222222222 & 11.0889484562207 & 33.6345888606770 \tabularnewline
Winsorized Mean ( 6 / 24 ) & 370.055555555556 & 10.3500336214874 & 35.7540438117317 \tabularnewline
Winsorized Mean ( 7 / 24 ) & 368.597222222222 & 10.0107270267136 & 36.8202250684314 \tabularnewline
Winsorized Mean ( 8 / 24 ) & 367.819444444444 & 9.8372580372812 & 37.3904438666226 \tabularnewline
Winsorized Mean ( 9 / 24 ) & 367.194444444444 & 9.57056485351681 & 38.3670608855981 \tabularnewline
Winsorized Mean ( 10 / 24 ) & 366.638888888889 & 9.39307059786506 & 39.0329110240289 \tabularnewline
Winsorized Mean ( 11 / 24 ) & 366.333333333333 & 9.34460251932266 & 39.2026661996413 \tabularnewline
Winsorized Mean ( 12 / 24 ) & 367 & 9.19272863631401 & 39.922858002165 \tabularnewline
Winsorized Mean ( 13 / 24 ) & 367 & 9.02775671118284 & 40.6524025559296 \tabularnewline
Winsorized Mean ( 14 / 24 ) & 367.194444444444 & 8.9406983621094 & 41.0699958294770 \tabularnewline
Winsorized Mean ( 15 / 24 ) & 367.194444444444 & 8.56866399709916 & 42.8531734432292 \tabularnewline
Winsorized Mean ( 16 / 24 ) & 367.416666666667 & 8.21402265833324 & 44.7304179632275 \tabularnewline
Winsorized Mean ( 17 / 24 ) & 366.708333333333 & 7.90652148318123 & 46.3804890827649 \tabularnewline
Winsorized Mean ( 18 / 24 ) & 366.208333333333 & 7.76311897604994 & 47.1728353594896 \tabularnewline
Winsorized Mean ( 19 / 24 ) & 365.680555555556 & 7.68704747612445 & 47.5710026107344 \tabularnewline
Winsorized Mean ( 20 / 24 ) & 364.013888888889 & 7.06823143096217 & 51.4999957831513 \tabularnewline
Winsorized Mean ( 21 / 24 ) & 363.430555555556 & 6.98841614717127 & 52.0047100661947 \tabularnewline
Winsorized Mean ( 22 / 24 ) & 362.819444444444 & 6.49446997181027 & 55.8659053039416 \tabularnewline
Winsorized Mean ( 23 / 24 ) & 365.694444444444 & 6.11716072024784 & 59.7817290028025 \tabularnewline
Winsorized Mean ( 24 / 24 ) & 365.361111111111 & 5.98528796049882 & 61.0431968390475 \tabularnewline
Trimmed Mean ( 1 / 24 ) & 373.728571428571 & 11.8970031445467 & 31.4136734174 \tabularnewline
Trimmed Mean ( 2 / 24 ) & 372.367647058824 & 11.4216786392177 & 32.6018319041350 \tabularnewline
Trimmed Mean ( 3 / 24 ) & 371.136363636364 & 10.9388187607476 & 33.9283767062797 \tabularnewline
Trimmed Mean ( 4 / 24 ) & 369.75 & 10.5935927026296 & 34.9031731140862 \tabularnewline
Trimmed Mean ( 5 / 24 ) & 368.290322580645 & 10.2042956886144 & 36.0916944999518 \tabularnewline
Trimmed Mean ( 6 / 24 ) & 367.166666666667 & 9.89296293487877 & 37.1139232082007 \tabularnewline
Trimmed Mean ( 7 / 24 ) & 366.568965517241 & 9.72732015780758 & 37.6844762555715 \tabularnewline
Trimmed Mean ( 8 / 24 ) & 366.196428571429 & 9.60703272036517 & 38.1175373531474 \tabularnewline
Trimmed Mean ( 9 / 24 ) & 365.925925925926 & 9.49341792105435 & 38.5452245933871 \tabularnewline
Trimmed Mean ( 10 / 24 ) & 365.730769230769 & 9.40452200947547 & 38.8888205973977 \tabularnewline
Trimmed Mean ( 11 / 24 ) & 365.6 & 9.3219512716064 & 39.2192567143722 \tabularnewline
Trimmed Mean ( 12 / 24 ) & 365.5 & 9.21742875794554 & 39.6531407617265 \tabularnewline
Trimmed Mean ( 13 / 24 ) & 365.304347826087 & 9.10565304930494 & 40.1184127978577 \tabularnewline
Trimmed Mean ( 14 / 24 ) & 365.090909090909 & 8.98570736042799 & 40.6301801791061 \tabularnewline
Trimmed Mean ( 15 / 24 ) & 364.833333333333 & 8.83661981682302 & 41.2865259449964 \tabularnewline
Trimmed Mean ( 16 / 24 ) & 364.55 & 8.71102675805138 & 41.8492572833685 \tabularnewline
Trimmed Mean ( 17 / 24 ) & 364.210526315789 & 8.60779344305925 & 42.3117177154692 \tabularnewline
Trimmed Mean ( 18 / 24 ) & 363.916666666667 & 8.5205982910882 & 42.7102245915397 \tabularnewline
Trimmed Mean ( 19 / 24 ) & 363.647058823529 & 8.41332894970462 & 43.2227315724172 \tabularnewline
Trimmed Mean ( 20 / 24 ) & 363.40625 & 8.26011835215042 & 43.9952836638704 \tabularnewline
Trimmed Mean ( 21 / 24 ) & 363.333333333333 & 8.18582084065178 & 44.3856933111675 \tabularnewline
Trimmed Mean ( 22 / 24 ) & 363.321428571429 & 8.06587520245367 & 45.0442660532244 \tabularnewline
Trimmed Mean ( 23 / 24 ) & 363.384615384615 & 8.00174537173502 & 45.4131690653664 \tabularnewline
Trimmed Mean ( 24 / 24 ) & 363.083333333333 & 7.97321527589396 & 45.5378816160992 \tabularnewline
Median & 367 &  &  \tabularnewline
Midrange & 446.5 &  &  \tabularnewline
Midmean - Weighted Average at Xnp & 361.918918918919 &  &  \tabularnewline
Midmean - Weighted Average at X(n+1)p & 363.916666666667 &  &  \tabularnewline
Midmean - Empirical Distribution Function & 361.918918918919 &  &  \tabularnewline
Midmean - Empirical Distribution Function - Averaging & 363.916666666667 &  &  \tabularnewline
Midmean - Empirical Distribution Function - Interpolation & 363.916666666667 &  &  \tabularnewline
Midmean - Closest Observation & 361.918918918919 &  &  \tabularnewline
Midmean - True Basic - Statistics Graphics Toolkit & 363.916666666667 &  &  \tabularnewline
Midmean - MS Excel (old versions) & 364.210526315789 &  &  \tabularnewline
Number of observations & 72 &  &  \tabularnewline
\hline
\end{tabular}
%Source: https://freestatistics.org/blog/index.php?pk=10433&T=1

[TABLE]
[ROW][C]Central Tendency - Ungrouped Data[/C][/ROW]
[ROW][C]Measure[/C][C]Value[/C][C]S.E.[/C][C]Value/S.E.[/C][/ROW]
[ROW][C]Arithmetic Mean[/C][C]375.75[/C][C]12.5623756699365[/C][C]29.9107437854466[/C][/ROW]
[ROW][C]Geometric Mean[/C][C]361.581122572469[/C][C][/C][C][/C][/ROW]
[ROW][C]Harmonic Mean[/C][C]348.234512708424[/C][C][/C][C][/C][/ROW]
[ROW][C]Quadratic Mean[/C][C]390.375211246252[/C][C][/C][C][/C][/ROW]
[ROW][C]Winsorized Mean ( 1 / 24 )[/C][C]375.013888888889[/C][C]12.2942136384915[/C][C]30.503283895667[/C][/ROW]
[ROW][C]Winsorized Mean ( 2 / 24 )[/C][C]374.625[/C][C]12.1594846237229[/C][C]30.8092827609744[/C][/ROW]
[ROW][C]Winsorized Mean ( 3 / 24 )[/C][C]374.833333333333[/C][C]11.6558467600287[/C][C]32.1583957862888[/C][/ROW]
[ROW][C]Winsorized Mean ( 4 / 24 )[/C][C]374.777777777778[/C][C]11.5744886728038[/C][C]32.3796401182180[/C][/ROW]
[ROW][C]Winsorized Mean ( 5 / 24 )[/C][C]372.972222222222[/C][C]11.0889484562207[/C][C]33.6345888606770[/C][/ROW]
[ROW][C]Winsorized Mean ( 6 / 24 )[/C][C]370.055555555556[/C][C]10.3500336214874[/C][C]35.7540438117317[/C][/ROW]
[ROW][C]Winsorized Mean ( 7 / 24 )[/C][C]368.597222222222[/C][C]10.0107270267136[/C][C]36.8202250684314[/C][/ROW]
[ROW][C]Winsorized Mean ( 8 / 24 )[/C][C]367.819444444444[/C][C]9.8372580372812[/C][C]37.3904438666226[/C][/ROW]
[ROW][C]Winsorized Mean ( 9 / 24 )[/C][C]367.194444444444[/C][C]9.57056485351681[/C][C]38.3670608855981[/C][/ROW]
[ROW][C]Winsorized Mean ( 10 / 24 )[/C][C]366.638888888889[/C][C]9.39307059786506[/C][C]39.0329110240289[/C][/ROW]
[ROW][C]Winsorized Mean ( 11 / 24 )[/C][C]366.333333333333[/C][C]9.34460251932266[/C][C]39.2026661996413[/C][/ROW]
[ROW][C]Winsorized Mean ( 12 / 24 )[/C][C]367[/C][C]9.19272863631401[/C][C]39.922858002165[/C][/ROW]
[ROW][C]Winsorized Mean ( 13 / 24 )[/C][C]367[/C][C]9.02775671118284[/C][C]40.6524025559296[/C][/ROW]
[ROW][C]Winsorized Mean ( 14 / 24 )[/C][C]367.194444444444[/C][C]8.9406983621094[/C][C]41.0699958294770[/C][/ROW]
[ROW][C]Winsorized Mean ( 15 / 24 )[/C][C]367.194444444444[/C][C]8.56866399709916[/C][C]42.8531734432292[/C][/ROW]
[ROW][C]Winsorized Mean ( 16 / 24 )[/C][C]367.416666666667[/C][C]8.21402265833324[/C][C]44.7304179632275[/C][/ROW]
[ROW][C]Winsorized Mean ( 17 / 24 )[/C][C]366.708333333333[/C][C]7.90652148318123[/C][C]46.3804890827649[/C][/ROW]
[ROW][C]Winsorized Mean ( 18 / 24 )[/C][C]366.208333333333[/C][C]7.76311897604994[/C][C]47.1728353594896[/C][/ROW]
[ROW][C]Winsorized Mean ( 19 / 24 )[/C][C]365.680555555556[/C][C]7.68704747612445[/C][C]47.5710026107344[/C][/ROW]
[ROW][C]Winsorized Mean ( 20 / 24 )[/C][C]364.013888888889[/C][C]7.06823143096217[/C][C]51.4999957831513[/C][/ROW]
[ROW][C]Winsorized Mean ( 21 / 24 )[/C][C]363.430555555556[/C][C]6.98841614717127[/C][C]52.0047100661947[/C][/ROW]
[ROW][C]Winsorized Mean ( 22 / 24 )[/C][C]362.819444444444[/C][C]6.49446997181027[/C][C]55.8659053039416[/C][/ROW]
[ROW][C]Winsorized Mean ( 23 / 24 )[/C][C]365.694444444444[/C][C]6.11716072024784[/C][C]59.7817290028025[/C][/ROW]
[ROW][C]Winsorized Mean ( 24 / 24 )[/C][C]365.361111111111[/C][C]5.98528796049882[/C][C]61.0431968390475[/C][/ROW]
[ROW][C]Trimmed Mean ( 1 / 24 )[/C][C]373.728571428571[/C][C]11.8970031445467[/C][C]31.4136734174[/C][/ROW]
[ROW][C]Trimmed Mean ( 2 / 24 )[/C][C]372.367647058824[/C][C]11.4216786392177[/C][C]32.6018319041350[/C][/ROW]
[ROW][C]Trimmed Mean ( 3 / 24 )[/C][C]371.136363636364[/C][C]10.9388187607476[/C][C]33.9283767062797[/C][/ROW]
[ROW][C]Trimmed Mean ( 4 / 24 )[/C][C]369.75[/C][C]10.5935927026296[/C][C]34.9031731140862[/C][/ROW]
[ROW][C]Trimmed Mean ( 5 / 24 )[/C][C]368.290322580645[/C][C]10.2042956886144[/C][C]36.0916944999518[/C][/ROW]
[ROW][C]Trimmed Mean ( 6 / 24 )[/C][C]367.166666666667[/C][C]9.89296293487877[/C][C]37.1139232082007[/C][/ROW]
[ROW][C]Trimmed Mean ( 7 / 24 )[/C][C]366.568965517241[/C][C]9.72732015780758[/C][C]37.6844762555715[/C][/ROW]
[ROW][C]Trimmed Mean ( 8 / 24 )[/C][C]366.196428571429[/C][C]9.60703272036517[/C][C]38.1175373531474[/C][/ROW]
[ROW][C]Trimmed Mean ( 9 / 24 )[/C][C]365.925925925926[/C][C]9.49341792105435[/C][C]38.5452245933871[/C][/ROW]
[ROW][C]Trimmed Mean ( 10 / 24 )[/C][C]365.730769230769[/C][C]9.40452200947547[/C][C]38.8888205973977[/C][/ROW]
[ROW][C]Trimmed Mean ( 11 / 24 )[/C][C]365.6[/C][C]9.3219512716064[/C][C]39.2192567143722[/C][/ROW]
[ROW][C]Trimmed Mean ( 12 / 24 )[/C][C]365.5[/C][C]9.21742875794554[/C][C]39.6531407617265[/C][/ROW]
[ROW][C]Trimmed Mean ( 13 / 24 )[/C][C]365.304347826087[/C][C]9.10565304930494[/C][C]40.1184127978577[/C][/ROW]
[ROW][C]Trimmed Mean ( 14 / 24 )[/C][C]365.090909090909[/C][C]8.98570736042799[/C][C]40.6301801791061[/C][/ROW]
[ROW][C]Trimmed Mean ( 15 / 24 )[/C][C]364.833333333333[/C][C]8.83661981682302[/C][C]41.2865259449964[/C][/ROW]
[ROW][C]Trimmed Mean ( 16 / 24 )[/C][C]364.55[/C][C]8.71102675805138[/C][C]41.8492572833685[/C][/ROW]
[ROW][C]Trimmed Mean ( 17 / 24 )[/C][C]364.210526315789[/C][C]8.60779344305925[/C][C]42.3117177154692[/C][/ROW]
[ROW][C]Trimmed Mean ( 18 / 24 )[/C][C]363.916666666667[/C][C]8.5205982910882[/C][C]42.7102245915397[/C][/ROW]
[ROW][C]Trimmed Mean ( 19 / 24 )[/C][C]363.647058823529[/C][C]8.41332894970462[/C][C]43.2227315724172[/C][/ROW]
[ROW][C]Trimmed Mean ( 20 / 24 )[/C][C]363.40625[/C][C]8.26011835215042[/C][C]43.9952836638704[/C][/ROW]
[ROW][C]Trimmed Mean ( 21 / 24 )[/C][C]363.333333333333[/C][C]8.18582084065178[/C][C]44.3856933111675[/C][/ROW]
[ROW][C]Trimmed Mean ( 22 / 24 )[/C][C]363.321428571429[/C][C]8.06587520245367[/C][C]45.0442660532244[/C][/ROW]
[ROW][C]Trimmed Mean ( 23 / 24 )[/C][C]363.384615384615[/C][C]8.00174537173502[/C][C]45.4131690653664[/C][/ROW]
[ROW][C]Trimmed Mean ( 24 / 24 )[/C][C]363.083333333333[/C][C]7.97321527589396[/C][C]45.5378816160992[/C][/ROW]
[ROW][C]Median[/C][C]367[/C][C][/C][C][/C][/ROW]
[ROW][C]Midrange[/C][C]446.5[/C][C][/C][C][/C][/ROW]
[ROW][C]Midmean - Weighted Average at Xnp[/C][C]361.918918918919[/C][C][/C][C][/C][/ROW]
[ROW][C]Midmean - Weighted Average at X(n+1)p[/C][C]363.916666666667[/C][C][/C][C][/C][/ROW]
[ROW][C]Midmean - Empirical Distribution Function[/C][C]361.918918918919[/C][C][/C][C][/C][/ROW]
[ROW][C]Midmean - Empirical Distribution Function - Averaging[/C][C]363.916666666667[/C][C][/C][C][/C][/ROW]
[ROW][C]Midmean - Empirical Distribution Function - Interpolation[/C][C]363.916666666667[/C][C][/C][C][/C][/ROW]
[ROW][C]Midmean - Closest Observation[/C][C]361.918918918919[/C][C][/C][C][/C][/ROW]
[ROW][C]Midmean - True Basic - Statistics Graphics Toolkit[/C][C]363.916666666667[/C][C][/C][C][/C][/ROW]
[ROW][C]Midmean - MS Excel (old versions)[/C][C]364.210526315789[/C][C][/C][C][/C][/ROW]
[ROW][C]Number of observations[/C][C]72[/C][C][/C][C][/C][/ROW]
[/TABLE]
Source: https://freestatistics.org/blog/index.php?pk=10433&T=1

Globally Unique Identifier (entire table): ba.freestatistics.org/blog/index.php?pk=10433&T=1

As an alternative you can also use a QR Code:  

The GUIDs for individual cells are displayed in the table below:

Central Tendency - Ungrouped Data
MeasureValueS.E.Value/S.E.
Arithmetic Mean375.7512.562375669936529.9107437854466
Geometric Mean361.581122572469
Harmonic Mean348.234512708424
Quadratic Mean390.375211246252
Winsorized Mean ( 1 / 24 )375.01388888888912.294213638491530.503283895667
Winsorized Mean ( 2 / 24 )374.62512.159484623722930.8092827609744
Winsorized Mean ( 3 / 24 )374.83333333333311.655846760028732.1583957862888
Winsorized Mean ( 4 / 24 )374.77777777777811.574488672803832.3796401182180
Winsorized Mean ( 5 / 24 )372.97222222222211.088948456220733.6345888606770
Winsorized Mean ( 6 / 24 )370.05555555555610.350033621487435.7540438117317
Winsorized Mean ( 7 / 24 )368.59722222222210.010727026713636.8202250684314
Winsorized Mean ( 8 / 24 )367.8194444444449.837258037281237.3904438666226
Winsorized Mean ( 9 / 24 )367.1944444444449.5705648535168138.3670608855981
Winsorized Mean ( 10 / 24 )366.6388888888899.3930705978650639.0329110240289
Winsorized Mean ( 11 / 24 )366.3333333333339.3446025193226639.2026661996413
Winsorized Mean ( 12 / 24 )3679.1927286363140139.922858002165
Winsorized Mean ( 13 / 24 )3679.0277567111828440.6524025559296
Winsorized Mean ( 14 / 24 )367.1944444444448.940698362109441.0699958294770
Winsorized Mean ( 15 / 24 )367.1944444444448.5686639970991642.8531734432292
Winsorized Mean ( 16 / 24 )367.4166666666678.2140226583332444.7304179632275
Winsorized Mean ( 17 / 24 )366.7083333333337.9065214831812346.3804890827649
Winsorized Mean ( 18 / 24 )366.2083333333337.7631189760499447.1728353594896
Winsorized Mean ( 19 / 24 )365.6805555555567.6870474761244547.5710026107344
Winsorized Mean ( 20 / 24 )364.0138888888897.0682314309621751.4999957831513
Winsorized Mean ( 21 / 24 )363.4305555555566.9884161471712752.0047100661947
Winsorized Mean ( 22 / 24 )362.8194444444446.4944699718102755.8659053039416
Winsorized Mean ( 23 / 24 )365.6944444444446.1171607202478459.7817290028025
Winsorized Mean ( 24 / 24 )365.3611111111115.9852879604988261.0431968390475
Trimmed Mean ( 1 / 24 )373.72857142857111.897003144546731.4136734174
Trimmed Mean ( 2 / 24 )372.36764705882411.421678639217732.6018319041350
Trimmed Mean ( 3 / 24 )371.13636363636410.938818760747633.9283767062797
Trimmed Mean ( 4 / 24 )369.7510.593592702629634.9031731140862
Trimmed Mean ( 5 / 24 )368.29032258064510.204295688614436.0916944999518
Trimmed Mean ( 6 / 24 )367.1666666666679.8929629348787737.1139232082007
Trimmed Mean ( 7 / 24 )366.5689655172419.7273201578075837.6844762555715
Trimmed Mean ( 8 / 24 )366.1964285714299.6070327203651738.1175373531474
Trimmed Mean ( 9 / 24 )365.9259259259269.4934179210543538.5452245933871
Trimmed Mean ( 10 / 24 )365.7307692307699.4045220094754738.8888205973977
Trimmed Mean ( 11 / 24 )365.69.321951271606439.2192567143722
Trimmed Mean ( 12 / 24 )365.59.2174287579455439.6531407617265
Trimmed Mean ( 13 / 24 )365.3043478260879.1056530493049440.1184127978577
Trimmed Mean ( 14 / 24 )365.0909090909098.9857073604279940.6301801791061
Trimmed Mean ( 15 / 24 )364.8333333333338.8366198168230241.2865259449964
Trimmed Mean ( 16 / 24 )364.558.7110267580513841.8492572833685
Trimmed Mean ( 17 / 24 )364.2105263157898.6077934430592542.3117177154692
Trimmed Mean ( 18 / 24 )363.9166666666678.520598291088242.7102245915397
Trimmed Mean ( 19 / 24 )363.6470588235298.4133289497046243.2227315724172
Trimmed Mean ( 20 / 24 )363.406258.2601183521504243.9952836638704
Trimmed Mean ( 21 / 24 )363.3333333333338.1858208406517844.3856933111675
Trimmed Mean ( 22 / 24 )363.3214285714298.0658752024536745.0442660532244
Trimmed Mean ( 23 / 24 )363.3846153846158.0017453717350245.4131690653664
Trimmed Mean ( 24 / 24 )363.0833333333337.9732152758939645.5378816160992
Median367
Midrange446.5
Midmean - Weighted Average at Xnp361.918918918919
Midmean - Weighted Average at X(n+1)p363.916666666667
Midmean - Empirical Distribution Function361.918918918919
Midmean - Empirical Distribution Function - Averaging363.916666666667
Midmean - Empirical Distribution Function - Interpolation363.916666666667
Midmean - Closest Observation361.918918918919
Midmean - True Basic - Statistics Graphics Toolkit363.916666666667
Midmean - MS Excel (old versions)364.210526315789
Number of observations72


Parameters (Session):
Parameters (R input):
R code (references can be found in the software module):
geomean <- function(x) {
return(exp(mean(log(x))))
}
harmean <- function(x) {
return(1/mean(1/x))
}
quamean <- function(x) {
return(sqrt(mean(x*x)))
}
winmean <- function(x) {
x <-sort(x[!is.na(x)])
n<-length(x)
denom <- 3
nodenom <- n/denom
if (nodenom>40) denom <- n/40
sqrtn = sqrt(n)
roundnodenom = floor(nodenom)
win <- array(NA,dim=c(roundnodenom,2))
for (j in 1:roundnodenom) {
win[j,1] <- (j*x[j+1]+sum(x[(j+1):(n-j)])+j*x[n-j])/n
win[j,2] <- sd(c(rep(x[j+1],j),x[(j+1):(n-j)],rep(x[n-j],j)))/sqrtn
}
return(win)
}
trimean <- function(x) {
x <-sort(x[!is.na(x)])
n<-length(x)
denom <- 3
nodenom <- n/denom
if (nodenom>40) denom <- n/40
sqrtn = sqrt(n)
roundnodenom = floor(nodenom)
tri <- array(NA,dim=c(roundnodenom,2))
for (j in 1:roundnodenom) {
tri[j,1] <- mean(x,trim=j/n)
tri[j,2] <- sd(x[(j+1):(n-j)]) / sqrt(n-j*2)
}
return(tri)
}
midrange <- function(x) {
return((max(x)+min(x))/2)
}
q1 <- function(data,n,p,i,f) {
np <- n*p;
i <<- floor(np)
f <<- np - i
qvalue <- (1-f)*data[i] + f*data[i+1]
}
q2 <- function(data,n,p,i,f) {
np <- (n+1)*p
i <<- floor(np)
f <<- np - i
qvalue <- (1-f)*data[i] + f*data[i+1]
}
q3 <- function(data,n,p,i,f) {
np <- n*p
i <<- floor(np)
f <<- np - i
if (f==0) {
qvalue <- data[i]
} else {
qvalue <- data[i+1]
}
}
q4 <- function(data,n,p,i,f) {
np <- n*p
i <<- floor(np)
f <<- np - i
if (f==0) {
qvalue <- (data[i]+data[i+1])/2
} else {
qvalue <- data[i+1]
}
}
q5 <- function(data,n,p,i,f) {
np <- (n-1)*p
i <<- floor(np)
f <<- np - i
if (f==0) {
qvalue <- data[i+1]
} else {
qvalue <- data[i+1] + f*(data[i+2]-data[i+1])
}
}
q6 <- function(data,n,p,i,f) {
np <- n*p+0.5
i <<- floor(np)
f <<- np - i
qvalue <- data[i]
}
q7 <- function(data,n,p,i,f) {
np <- (n+1)*p
i <<- floor(np)
f <<- np - i
if (f==0) {
qvalue <- data[i]
} else {
qvalue <- f*data[i] + (1-f)*data[i+1]
}
}
q8 <- function(data,n,p,i,f) {
np <- (n+1)*p
i <<- floor(np)
f <<- np - i
if (f==0) {
qvalue <- data[i]
} else {
if (f == 0.5) {
qvalue <- (data[i]+data[i+1])/2
} else {
if (f < 0.5) {
qvalue <- data[i]
} else {
qvalue <- data[i+1]
}
}
}
}
midmean <- function(x,def) {
x <-sort(x[!is.na(x)])
n<-length(x)
if (def==1) {
qvalue1 <- q1(x,n,0.25,i,f)
qvalue3 <- q1(x,n,0.75,i,f)
}
if (def==2) {
qvalue1 <- q2(x,n,0.25,i,f)
qvalue3 <- q2(x,n,0.75,i,f)
}
if (def==3) {
qvalue1 <- q3(x,n,0.25,i,f)
qvalue3 <- q3(x,n,0.75,i,f)
}
if (def==4) {
qvalue1 <- q4(x,n,0.25,i,f)
qvalue3 <- q4(x,n,0.75,i,f)
}
if (def==5) {
qvalue1 <- q5(x,n,0.25,i,f)
qvalue3 <- q5(x,n,0.75,i,f)
}
if (def==6) {
qvalue1 <- q6(x,n,0.25,i,f)
qvalue3 <- q6(x,n,0.75,i,f)
}
if (def==7) {
qvalue1 <- q7(x,n,0.25,i,f)
qvalue3 <- q7(x,n,0.75,i,f)
}
if (def==8) {
qvalue1 <- q8(x,n,0.25,i,f)
qvalue3 <- q8(x,n,0.75,i,f)
}
midm <- 0
myn <- 0
roundno4 <- round(n/4)
round3no4 <- round(3*n/4)
for (i in 1:n) {
if ((x[i]>=qvalue1) & (x[i]<=qvalue3)){
midm = midm + x[i]
myn = myn + 1
}
}
midm = midm / myn
return(midm)
}
(arm <- mean(x))
sqrtn <- sqrt(length(x))
(armse <- sd(x) / sqrtn)
(armose <- arm / armse)
(geo <- geomean(x))
(har <- harmean(x))
(qua <- quamean(x))
(win <- winmean(x))
(tri <- trimean(x))
(midr <- midrange(x))
midm <- array(NA,dim=8)
for (j in 1:8) midm[j] <- midmean(x,j)
midm
bitmap(file='test1.png')
lb <- win[,1] - 2*win[,2]
ub <- win[,1] + 2*win[,2]
if ((ylimmin == '') | (ylimmax == '')) plot(win[,1],type='b',main=main, xlab='j', pch=19, ylab='Winsorized Mean(j/n)', ylim=c(min(lb),max(ub))) else plot(win[,1],type='l',main=main, xlab='j', pch=19, ylab='Winsorized Mean(j/n)', ylim=c(ylimmin,ylimmax))
lines(ub,lty=3)
lines(lb,lty=3)
grid()
dev.off()
bitmap(file='test2.png')
lb <- tri[,1] - 2*tri[,2]
ub <- tri[,1] + 2*tri[,2]
if ((ylimmin == '') | (ylimmax == '')) plot(tri[,1],type='b',main=main, xlab='j', pch=19, ylab='Trimmed Mean(j/n)', ylim=c(min(lb),max(ub))) else plot(tri[,1],type='l',main=main, xlab='j', pch=19, ylab='Trimmed Mean(j/n)', ylim=c(ylimmin,ylimmax))
lines(ub,lty=3)
lines(lb,lty=3)
grid()
dev.off()
load(file='createtable')
a<-table.start()
a<-table.row.start(a)
a<-table.element(a,'Central Tendency - Ungrouped Data',4,TRUE)
a<-table.row.end(a)
a<-table.row.start(a)
a<-table.element(a,'Measure',header=TRUE)
a<-table.element(a,'Value',header=TRUE)
a<-table.element(a,'S.E.',header=TRUE)
a<-table.element(a,'Value/S.E.',header=TRUE)
a<-table.row.end(a)
a<-table.row.start(a)
a<-table.element(a,hyperlink('arithmetic_mean.htm', 'Arithmetic Mean', 'click to view the definition of the Arithmetic Mean'),header=TRUE)
a<-table.element(a,arm)
a<-table.element(a,hyperlink('arithmetic_mean_standard_error.htm', armse, 'click to view the definition of the Standard Error of the Arithmetic Mean'))
a<-table.element(a,armose)
a<-table.row.end(a)
a<-table.row.start(a)
a<-table.element(a,hyperlink('geometric_mean.htm', 'Geometric Mean', 'click to view the definition of the Geometric Mean'),header=TRUE)
a<-table.element(a,geo)
a<-table.element(a,'')
a<-table.row.end(a)
a<-table.row.start(a)
a<-table.element(a,hyperlink('harmonic_mean.htm', 'Harmonic Mean', 'click to view the definition of the Harmonic Mean'),header=TRUE)
a<-table.element(a,har)
a<-table.element(a,'')
a<-table.row.end(a)
a<-table.row.start(a)
a<-table.element(a,hyperlink('quadratic_mean.htm', 'Quadratic Mean', 'click to view the definition of the Quadratic Mean'),header=TRUE)
a<-table.element(a,qua)
a<-table.element(a,'')
a<-table.row.end(a)
for (j in 1:length(win[,1])) {
a<-table.row.start(a)
mylabel <- paste('Winsorized Mean (',j)
mylabel <- paste(mylabel,'/')
mylabel <- paste(mylabel,length(win[,1]))
mylabel <- paste(mylabel,')')
a<-table.element(a,hyperlink('winsorized_mean.htm', mylabel, 'click to view the definition of the Winsorized Mean'),header=TRUE)
a<-table.element(a,win[j,1])
a<-table.element(a,win[j,2])
a<-table.element(a,win[j,1]/win[j,2])
a<-table.row.end(a)
}
for (j in 1:length(tri[,1])) {
a<-table.row.start(a)
mylabel <- paste('Trimmed Mean (',j)
mylabel <- paste(mylabel,'/')
mylabel <- paste(mylabel,length(tri[,1]))
mylabel <- paste(mylabel,')')
a<-table.element(a,hyperlink('arithmetic_mean.htm', mylabel, 'click to view the definition of the Trimmed Mean'),header=TRUE)
a<-table.element(a,tri[j,1])
a<-table.element(a,tri[j,2])
a<-table.element(a,tri[j,1]/tri[j,2])
a<-table.row.end(a)
}
a<-table.row.start(a)
a<-table.element(a,hyperlink('median_1.htm', 'Median', 'click to view the definition of the Median'),header=TRUE)
a<-table.element(a,median(x))
a<-table.element(a,'')
a<-table.row.end(a)
a<-table.row.start(a)
a<-table.element(a,hyperlink('midrange.htm', 'Midrange', 'click to view the definition of the Midrange'),header=TRUE)
a<-table.element(a,midr)
a<-table.element(a,'')
a<-table.row.end(a)
a<-table.row.start(a)
mymid <- hyperlink('midmean.htm', 'Midmean', 'click to view the definition of the Midmean')
mylabel <- paste(mymid,hyperlink('method_1.htm','Weighted Average at Xnp',''),sep=' - ')
a<-table.element(a,mylabel,header=TRUE)
a<-table.element(a,midm[1])
a<-table.element(a,'')
a<-table.row.end(a)
a<-table.row.start(a)
mymid <- hyperlink('midmean.htm', 'Midmean', 'click to view the definition of the Midmean')
mylabel <- paste(mymid,hyperlink('method_2.htm','Weighted Average at X(n+1)p',''),sep=' - ')
a<-table.element(a,mylabel,header=TRUE)
a<-table.element(a,midm[2])
a<-table.element(a,'')
a<-table.row.end(a)
a<-table.row.start(a)
mymid <- hyperlink('midmean.htm', 'Midmean', 'click to view the definition of the Midmean')
mylabel <- paste(mymid,hyperlink('method_3.htm','Empirical Distribution Function',''),sep=' - ')
a<-table.element(a,mylabel,header=TRUE)
a<-table.element(a,midm[3])
a<-table.element(a,'')
a<-table.row.end(a)
a<-table.row.start(a)
mymid <- hyperlink('midmean.htm', 'Midmean', 'click to view the definition of the Midmean')
mylabel <- paste(mymid,hyperlink('method_4.htm','Empirical Distribution Function - Averaging',''),sep=' - ')
a<-table.element(a,mylabel,header=TRUE)
a<-table.element(a,midm[4])
a<-table.element(a,'')
a<-table.row.end(a)
a<-table.row.start(a)
mymid <- hyperlink('midmean.htm', 'Midmean', 'click to view the definition of the Midmean')
mylabel <- paste(mymid,hyperlink('method_5.htm','Empirical Distribution Function - Interpolation',''),sep=' - ')
a<-table.element(a,mylabel,header=TRUE)
a<-table.element(a,midm[5])
a<-table.element(a,'')
a<-table.row.end(a)
a<-table.row.start(a)
mymid <- hyperlink('midmean.htm', 'Midmean', 'click to view the definition of the Midmean')
mylabel <- paste(mymid,hyperlink('method_6.htm','Closest Observation',''),sep=' - ')
a<-table.element(a,mylabel,header=TRUE)
a<-table.element(a,midm[6])
a<-table.element(a,'')
a<-table.row.end(a)
a<-table.row.start(a)
mymid <- hyperlink('midmean.htm', 'Midmean', 'click to view the definition of the Midmean')
mylabel <- paste(mymid,hyperlink('method_7.htm','True Basic - Statistics Graphics Toolkit',''),sep=' - ')
a<-table.element(a,mylabel,header=TRUE)
a<-table.element(a,midm[7])
a<-table.element(a,'')
a<-table.row.end(a)
a<-table.row.start(a)
mymid <- hyperlink('midmean.htm', 'Midmean', 'click to view the definition of the Midmean')
mylabel <- paste(mymid,hyperlink('method_8.htm','MS Excel (old versions)',''),sep=' - ')
a<-table.element(a,mylabel,header=TRUE)
a<-table.element(a,midm[8])
a<-table.element(a,'')
a<-table.row.end(a)
a<-table.row.start(a)
a<-table.element(a,'Number of observations',header=TRUE)
a<-table.element(a,length(x))
a<-table.element(a,'')
a<-table.row.end(a)
a<-table.end(a)
table.save(a,file='mytable.tab')