Free Statistics

of Irreproducible Research!

Author's title

Author*Unverified author*
R Software Modulerwasp_centraltendency.wasp
Title produced by softwareCentral Tendency
Date of computationSun, 20 Apr 2008 13:17:18 -0600
Cite this page as followsStatistical Computations at FreeStatistics.org, Office for Research Development and Education, URL https://freestatistics.org/blog/index.php?v=date/2008/Apr/20/t1208719314nplb47dmjt78y8j.htm/, Retrieved Sun, 12 May 2024 13:47:10 +0000
Statistical Computations at FreeStatistics.org, Office for Research Development and Education, URL https://freestatistics.org/blog/index.php?pk=10436, Retrieved Sun, 12 May 2024 13:47:10 +0000
QR Codes:

Original text written by user:
IsPrivate?No (this computation is public)
User-defined keywords
Estimated Impact188
Family? (F = Feedback message, R = changed R code, M = changed R Module, P = changed Parameters, D = changed Data)
-       [Central Tendency] [Tom knaepen - Gou...] [2008-04-20 19:17:18] [d41d8cd98f00b204e9800998ecf8427e] [Current]
Feedback Forum

Post a new message
Dataseries X:
10236
10893
10756
10940
10997
10827
10166
10186
10457
10368
10244
10511
10812
10738
10171
9721
9897
9828
9924
10371
10846
10413
10709
10662
10570
10297
10635
10872
10296
10383
10431
10574
10653
10805
10872
10625
10407
10463
10556
10646
10702
11353
11346
11451
11964
12574
13031
13812
14544
14931
14886
16005
17064
15168
16050
15839
15137
14954
15648
15305
15579
16348
15928
16171
15937
15713
15594
15683
16438
17032
17696
17745


Summary of compuational transaction
Raw Inputview raw input (R code)
Raw Outputview raw output of R engine
Computing time3 seconds
R Server'Herman Ole Andreas Wold' @ 193.190.124.10:1001

\begin{tabular}{lllllllll}
\hline
Summary of compuational transaction \tabularnewline
Raw Input & view raw input (R code)  \tabularnewline
Raw Output & view raw output of R engine  \tabularnewline
Computing time & 3 seconds \tabularnewline
R Server & 'Herman Ole Andreas Wold' @ 193.190.124.10:1001 \tabularnewline
\hline
\end{tabular}
%Source: https://freestatistics.org/blog/index.php?pk=10436&T=0

[TABLE]
[ROW][C]Summary of compuational transaction[/C][/ROW]
[ROW][C]Raw Input[/C][C]view raw input (R code) [/C][/ROW]
[ROW][C]Raw Output[/C][C]view raw output of R engine [/C][/ROW]
[ROW][C]Computing time[/C][C]3 seconds[/C][/ROW]
[ROW][C]R Server[/C][C]'Herman Ole Andreas Wold' @ 193.190.124.10:1001[/C][/ROW]
[/TABLE]
Source: https://freestatistics.org/blog/index.php?pk=10436&T=0

Globally Unique Identifier (entire table): ba.freestatistics.org/blog/index.php?pk=10436&T=0

As an alternative you can also use a QR Code:  

The GUIDs for individual cells are displayed in the table below:

Summary of compuational transaction
Raw Inputview raw input (R code)
Raw Outputview raw output of R engine
Computing time3 seconds
R Server'Herman Ole Andreas Wold' @ 193.190.124.10:1001


Central Tendency - Ungrouped Data
MeasureValueS.E.Value/S.E.
Arithmetic Mean12463.6944444444302.09074647785341.2581139599990
Geometric Mean12222.1692291736
Harmonic Mean12002.7095824196
Quadratic Mean12720.9691203584
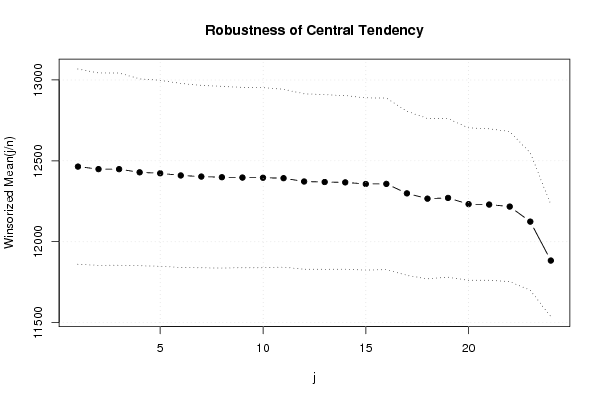
Winsorized Mean ( 1 / 24 )12464.5301.73739930229941.3090986693111
Winsorized Mean ( 2 / 24 )12448.8611111111297.44025208842241.8533168382683
Winsorized Mean ( 3 / 24 )12448.6527777778297.01435035893541.9126306952303
Winsorized Mean ( 4 / 24 )12429.0972222222288.64743682474343.059787257937
Winsorized Mean ( 5 / 24 )12423.1944444444287.39671386773943.2266405459376
Winsorized Mean ( 6 / 24 )12409.6944444444284.46670765081443.6244175880064
Winsorized Mean ( 7 / 24 )12402.7916666667281.76799156577344.0177452298427
Winsorized Mean ( 8 / 24 )12398.6805555556280.76375534789744.1605453673757
Winsorized Mean ( 9 / 24 )12396.6805555556278.53747948007544.5063284793685
Winsorized Mean ( 10 / 24 )12395.5694444444278.29910659815144.5404571935726
Winsorized Mean ( 11 / 24 )12392.8194444444274.74343582105145.1068809247776
Winsorized Mean ( 12 / 24 )12372.3194444444271.01332251494645.6520710112401
Winsorized Mean ( 13 / 24 )12369.0694444444269.84968525386045.8368866830742
Winsorized Mean ( 14 / 24 )12366.9305555556268.19273160500646.1121018513267
Winsorized Mean ( 15 / 24 )12356.9305555556266.13118501865346.4317270998868
Winsorized Mean ( 16 / 24 )12357.5972222222265.1500237189146.6060573893168
Winsorized Mean ( 17 / 24 )12299.0416666667253.58308546771948.5010332766548
Winsorized Mean ( 18 / 24 )12266.2916666667247.74491323425949.5117801069363
Winsorized Mean ( 19 / 24 )12270.7777777778245.10671418567450.0630014095917
Winsorized Mean ( 20 / 24 )12232.4444444444235.52429517674251.9370812054229
Winsorized Mean ( 21 / 24 )12229.8194444444234.02448553592852.2587173578763
Winsorized Mean ( 22 / 24 )12217.2916666667231.66928042358152.7359158034624
Winsorized Mean ( 23 / 24 )12124.3333333333212.41445576328957.0786639250413
Winsorized Mean ( 24 / 24 )11883.6666666667173.3449289638968.5550291992804
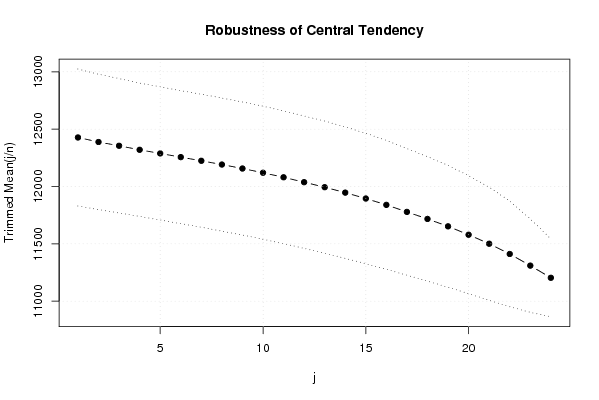
Trimmed Mean ( 1 / 24 )12427.4285714286298.72345976270441.6017830715422
Trimmed Mean ( 2 / 24 )12388.1764705882294.96387997884741.9989609286284
Trimmed Mean ( 3 / 24 )12355.0757575758292.98210110297942.1700701546718
Trimmed Mean ( 4 / 24 )12319.984375290.5525724669442.4019111942359
Trimmed Mean ( 5 / 24 )12288.3064516129290.30005865547642.3296726446635
Trimmed Mean ( 6 / 24 )12255.9333333333289.99208918361442.2629919589746
Trimmed Mean ( 7 / 24 )12224.1206896552289.99587380253642.1527400696013
Trimmed Mean ( 8 / 24 )12191.3035714286290.19496460188242.0107343632023
Trimmed Mean ( 9 / 24 )12156.7407407407290.16948610681841.8953105781273
Trimmed Mean ( 10 / 24 )12119.8269230769290.07725699112441.7813759299571
Trimmed Mean ( 11 / 24 )12080.12289.43882176179741.7363501083546
Trimmed Mean ( 12 / 24 )12037.4791666667288.75230493934941.6879067656104
Trimmed Mean ( 13 / 24 )11993.8043478261288.02691872917641.6412618679698
Trimmed Mean ( 14 / 24 )11946.5681818182286.61392253267141.6817441255193
Trimmed Mean ( 15 / 24 )11895.0952380952284.35901145879141.8312582290681
Trimmed Mean ( 16 / 24 )11839.675281.06897909519542.1237343164434
Trimmed Mean ( 17 / 24 )11778.3421052632276.03391641319542.6699090398449
Trimmed Mean ( 18 / 24 )11717.0833333333271.40350202732943.1721891788761
Trimmed Mean ( 19 / 24 )11652.4705882353265.66422065791843.8616482090735
Trimmed Mean ( 20 / 24 )11579.25257.09973196683745.0379699403716
Trimmed Mean ( 21 / 24 )11500.8666666667246.70512312835746.6178671963895
Trimmed Mean ( 22 / 24 )11411.6071428571230.29703237298449.5516899426439
Trimmed Mean ( 23 / 24 )11310.1923076923204.01870969429655.4370347927385
Trimmed Mean ( 24 / 24 )11204169.49262520829666.1031710744403
Median10859
Midrange13733
Midmean - Weighted Average at Xnp11683.0270270270
Midmean - Weighted Average at X(n+1)p11717.0833333333
Midmean - Empirical Distribution Function11683.0270270270
Midmean - Empirical Distribution Function - Averaging11717.0833333333
Midmean - Empirical Distribution Function - Interpolation11717.0833333333
Midmean - Closest Observation11683.0270270270
Midmean - True Basic - Statistics Graphics Toolkit11717.0833333333
Midmean - MS Excel (old versions)11778.3421052632
Number of observations72

\begin{tabular}{lllllllll}
\hline
Central Tendency - Ungrouped Data \tabularnewline
Measure & Value & S.E. & Value/S.E. \tabularnewline
Arithmetic Mean & 12463.6944444444 & 302.090746477853 & 41.2581139599990 \tabularnewline
Geometric Mean & 12222.1692291736 &  &  \tabularnewline
Harmonic Mean & 12002.7095824196 &  &  \tabularnewline
Quadratic Mean & 12720.9691203584 &  &  \tabularnewline
Winsorized Mean ( 1 / 24 ) & 12464.5 & 301.737399302299 & 41.3090986693111 \tabularnewline
Winsorized Mean ( 2 / 24 ) & 12448.8611111111 & 297.440252088422 & 41.8533168382683 \tabularnewline
Winsorized Mean ( 3 / 24 ) & 12448.6527777778 & 297.014350358935 & 41.9126306952303 \tabularnewline
Winsorized Mean ( 4 / 24 ) & 12429.0972222222 & 288.647436824743 & 43.059787257937 \tabularnewline
Winsorized Mean ( 5 / 24 ) & 12423.1944444444 & 287.396713867739 & 43.2266405459376 \tabularnewline
Winsorized Mean ( 6 / 24 ) & 12409.6944444444 & 284.466707650814 & 43.6244175880064 \tabularnewline
Winsorized Mean ( 7 / 24 ) & 12402.7916666667 & 281.767991565773 & 44.0177452298427 \tabularnewline
Winsorized Mean ( 8 / 24 ) & 12398.6805555556 & 280.763755347897 & 44.1605453673757 \tabularnewline
Winsorized Mean ( 9 / 24 ) & 12396.6805555556 & 278.537479480075 & 44.5063284793685 \tabularnewline
Winsorized Mean ( 10 / 24 ) & 12395.5694444444 & 278.299106598151 & 44.5404571935726 \tabularnewline
Winsorized Mean ( 11 / 24 ) & 12392.8194444444 & 274.743435821051 & 45.1068809247776 \tabularnewline
Winsorized Mean ( 12 / 24 ) & 12372.3194444444 & 271.013322514946 & 45.6520710112401 \tabularnewline
Winsorized Mean ( 13 / 24 ) & 12369.0694444444 & 269.849685253860 & 45.8368866830742 \tabularnewline
Winsorized Mean ( 14 / 24 ) & 12366.9305555556 & 268.192731605006 & 46.1121018513267 \tabularnewline
Winsorized Mean ( 15 / 24 ) & 12356.9305555556 & 266.131185018653 & 46.4317270998868 \tabularnewline
Winsorized Mean ( 16 / 24 ) & 12357.5972222222 & 265.15002371891 & 46.6060573893168 \tabularnewline
Winsorized Mean ( 17 / 24 ) & 12299.0416666667 & 253.583085467719 & 48.5010332766548 \tabularnewline
Winsorized Mean ( 18 / 24 ) & 12266.2916666667 & 247.744913234259 & 49.5117801069363 \tabularnewline
Winsorized Mean ( 19 / 24 ) & 12270.7777777778 & 245.106714185674 & 50.0630014095917 \tabularnewline
Winsorized Mean ( 20 / 24 ) & 12232.4444444444 & 235.524295176742 & 51.9370812054229 \tabularnewline
Winsorized Mean ( 21 / 24 ) & 12229.8194444444 & 234.024485535928 & 52.2587173578763 \tabularnewline
Winsorized Mean ( 22 / 24 ) & 12217.2916666667 & 231.669280423581 & 52.7359158034624 \tabularnewline
Winsorized Mean ( 23 / 24 ) & 12124.3333333333 & 212.414455763289 & 57.0786639250413 \tabularnewline
Winsorized Mean ( 24 / 24 ) & 11883.6666666667 & 173.34492896389 & 68.5550291992804 \tabularnewline
Trimmed Mean ( 1 / 24 ) & 12427.4285714286 & 298.723459762704 & 41.6017830715422 \tabularnewline
Trimmed Mean ( 2 / 24 ) & 12388.1764705882 & 294.963879978847 & 41.9989609286284 \tabularnewline
Trimmed Mean ( 3 / 24 ) & 12355.0757575758 & 292.982101102979 & 42.1700701546718 \tabularnewline
Trimmed Mean ( 4 / 24 ) & 12319.984375 & 290.55257246694 & 42.4019111942359 \tabularnewline
Trimmed Mean ( 5 / 24 ) & 12288.3064516129 & 290.300058655476 & 42.3296726446635 \tabularnewline
Trimmed Mean ( 6 / 24 ) & 12255.9333333333 & 289.992089183614 & 42.2629919589746 \tabularnewline
Trimmed Mean ( 7 / 24 ) & 12224.1206896552 & 289.995873802536 & 42.1527400696013 \tabularnewline
Trimmed Mean ( 8 / 24 ) & 12191.3035714286 & 290.194964601882 & 42.0107343632023 \tabularnewline
Trimmed Mean ( 9 / 24 ) & 12156.7407407407 & 290.169486106818 & 41.8953105781273 \tabularnewline
Trimmed Mean ( 10 / 24 ) & 12119.8269230769 & 290.077256991124 & 41.7813759299571 \tabularnewline
Trimmed Mean ( 11 / 24 ) & 12080.12 & 289.438821761797 & 41.7363501083546 \tabularnewline
Trimmed Mean ( 12 / 24 ) & 12037.4791666667 & 288.752304939349 & 41.6879067656104 \tabularnewline
Trimmed Mean ( 13 / 24 ) & 11993.8043478261 & 288.026918729176 & 41.6412618679698 \tabularnewline
Trimmed Mean ( 14 / 24 ) & 11946.5681818182 & 286.613922532671 & 41.6817441255193 \tabularnewline
Trimmed Mean ( 15 / 24 ) & 11895.0952380952 & 284.359011458791 & 41.8312582290681 \tabularnewline
Trimmed Mean ( 16 / 24 ) & 11839.675 & 281.068979095195 & 42.1237343164434 \tabularnewline
Trimmed Mean ( 17 / 24 ) & 11778.3421052632 & 276.033916413195 & 42.6699090398449 \tabularnewline
Trimmed Mean ( 18 / 24 ) & 11717.0833333333 & 271.403502027329 & 43.1721891788761 \tabularnewline
Trimmed Mean ( 19 / 24 ) & 11652.4705882353 & 265.664220657918 & 43.8616482090735 \tabularnewline
Trimmed Mean ( 20 / 24 ) & 11579.25 & 257.099731966837 & 45.0379699403716 \tabularnewline
Trimmed Mean ( 21 / 24 ) & 11500.8666666667 & 246.705123128357 & 46.6178671963895 \tabularnewline
Trimmed Mean ( 22 / 24 ) & 11411.6071428571 & 230.297032372984 & 49.5516899426439 \tabularnewline
Trimmed Mean ( 23 / 24 ) & 11310.1923076923 & 204.018709694296 & 55.4370347927385 \tabularnewline
Trimmed Mean ( 24 / 24 ) & 11204 & 169.492625208296 & 66.1031710744403 \tabularnewline
Median & 10859 &  &  \tabularnewline
Midrange & 13733 &  &  \tabularnewline
Midmean - Weighted Average at Xnp & 11683.0270270270 &  &  \tabularnewline
Midmean - Weighted Average at X(n+1)p & 11717.0833333333 &  &  \tabularnewline
Midmean - Empirical Distribution Function & 11683.0270270270 &  &  \tabularnewline
Midmean - Empirical Distribution Function - Averaging & 11717.0833333333 &  &  \tabularnewline
Midmean - Empirical Distribution Function - Interpolation & 11717.0833333333 &  &  \tabularnewline
Midmean - Closest Observation & 11683.0270270270 &  &  \tabularnewline
Midmean - True Basic - Statistics Graphics Toolkit & 11717.0833333333 &  &  \tabularnewline
Midmean - MS Excel (old versions) & 11778.3421052632 &  &  \tabularnewline
Number of observations & 72 &  &  \tabularnewline
\hline
\end{tabular}
%Source: https://freestatistics.org/blog/index.php?pk=10436&T=1

[TABLE]
[ROW][C]Central Tendency - Ungrouped Data[/C][/ROW]
[ROW][C]Measure[/C][C]Value[/C][C]S.E.[/C][C]Value/S.E.[/C][/ROW]
[ROW][C]Arithmetic Mean[/C][C]12463.6944444444[/C][C]302.090746477853[/C][C]41.2581139599990[/C][/ROW]
[ROW][C]Geometric Mean[/C][C]12222.1692291736[/C][C][/C][C][/C][/ROW]
[ROW][C]Harmonic Mean[/C][C]12002.7095824196[/C][C][/C][C][/C][/ROW]
[ROW][C]Quadratic Mean[/C][C]12720.9691203584[/C][C][/C][C][/C][/ROW]
[ROW][C]Winsorized Mean ( 1 / 24 )[/C][C]12464.5[/C][C]301.737399302299[/C][C]41.3090986693111[/C][/ROW]
[ROW][C]Winsorized Mean ( 2 / 24 )[/C][C]12448.8611111111[/C][C]297.440252088422[/C][C]41.8533168382683[/C][/ROW]
[ROW][C]Winsorized Mean ( 3 / 24 )[/C][C]12448.6527777778[/C][C]297.014350358935[/C][C]41.9126306952303[/C][/ROW]
[ROW][C]Winsorized Mean ( 4 / 24 )[/C][C]12429.0972222222[/C][C]288.647436824743[/C][C]43.059787257937[/C][/ROW]
[ROW][C]Winsorized Mean ( 5 / 24 )[/C][C]12423.1944444444[/C][C]287.396713867739[/C][C]43.2266405459376[/C][/ROW]
[ROW][C]Winsorized Mean ( 6 / 24 )[/C][C]12409.6944444444[/C][C]284.466707650814[/C][C]43.6244175880064[/C][/ROW]
[ROW][C]Winsorized Mean ( 7 / 24 )[/C][C]12402.7916666667[/C][C]281.767991565773[/C][C]44.0177452298427[/C][/ROW]
[ROW][C]Winsorized Mean ( 8 / 24 )[/C][C]12398.6805555556[/C][C]280.763755347897[/C][C]44.1605453673757[/C][/ROW]
[ROW][C]Winsorized Mean ( 9 / 24 )[/C][C]12396.6805555556[/C][C]278.537479480075[/C][C]44.5063284793685[/C][/ROW]
[ROW][C]Winsorized Mean ( 10 / 24 )[/C][C]12395.5694444444[/C][C]278.299106598151[/C][C]44.5404571935726[/C][/ROW]
[ROW][C]Winsorized Mean ( 11 / 24 )[/C][C]12392.8194444444[/C][C]274.743435821051[/C][C]45.1068809247776[/C][/ROW]
[ROW][C]Winsorized Mean ( 12 / 24 )[/C][C]12372.3194444444[/C][C]271.013322514946[/C][C]45.6520710112401[/C][/ROW]
[ROW][C]Winsorized Mean ( 13 / 24 )[/C][C]12369.0694444444[/C][C]269.849685253860[/C][C]45.8368866830742[/C][/ROW]
[ROW][C]Winsorized Mean ( 14 / 24 )[/C][C]12366.9305555556[/C][C]268.192731605006[/C][C]46.1121018513267[/C][/ROW]
[ROW][C]Winsorized Mean ( 15 / 24 )[/C][C]12356.9305555556[/C][C]266.131185018653[/C][C]46.4317270998868[/C][/ROW]
[ROW][C]Winsorized Mean ( 16 / 24 )[/C][C]12357.5972222222[/C][C]265.15002371891[/C][C]46.6060573893168[/C][/ROW]
[ROW][C]Winsorized Mean ( 17 / 24 )[/C][C]12299.0416666667[/C][C]253.583085467719[/C][C]48.5010332766548[/C][/ROW]
[ROW][C]Winsorized Mean ( 18 / 24 )[/C][C]12266.2916666667[/C][C]247.744913234259[/C][C]49.5117801069363[/C][/ROW]
[ROW][C]Winsorized Mean ( 19 / 24 )[/C][C]12270.7777777778[/C][C]245.106714185674[/C][C]50.0630014095917[/C][/ROW]
[ROW][C]Winsorized Mean ( 20 / 24 )[/C][C]12232.4444444444[/C][C]235.524295176742[/C][C]51.9370812054229[/C][/ROW]
[ROW][C]Winsorized Mean ( 21 / 24 )[/C][C]12229.8194444444[/C][C]234.024485535928[/C][C]52.2587173578763[/C][/ROW]
[ROW][C]Winsorized Mean ( 22 / 24 )[/C][C]12217.2916666667[/C][C]231.669280423581[/C][C]52.7359158034624[/C][/ROW]
[ROW][C]Winsorized Mean ( 23 / 24 )[/C][C]12124.3333333333[/C][C]212.414455763289[/C][C]57.0786639250413[/C][/ROW]
[ROW][C]Winsorized Mean ( 24 / 24 )[/C][C]11883.6666666667[/C][C]173.34492896389[/C][C]68.5550291992804[/C][/ROW]
[ROW][C]Trimmed Mean ( 1 / 24 )[/C][C]12427.4285714286[/C][C]298.723459762704[/C][C]41.6017830715422[/C][/ROW]
[ROW][C]Trimmed Mean ( 2 / 24 )[/C][C]12388.1764705882[/C][C]294.963879978847[/C][C]41.9989609286284[/C][/ROW]
[ROW][C]Trimmed Mean ( 3 / 24 )[/C][C]12355.0757575758[/C][C]292.982101102979[/C][C]42.1700701546718[/C][/ROW]
[ROW][C]Trimmed Mean ( 4 / 24 )[/C][C]12319.984375[/C][C]290.55257246694[/C][C]42.4019111942359[/C][/ROW]
[ROW][C]Trimmed Mean ( 5 / 24 )[/C][C]12288.3064516129[/C][C]290.300058655476[/C][C]42.3296726446635[/C][/ROW]
[ROW][C]Trimmed Mean ( 6 / 24 )[/C][C]12255.9333333333[/C][C]289.992089183614[/C][C]42.2629919589746[/C][/ROW]
[ROW][C]Trimmed Mean ( 7 / 24 )[/C][C]12224.1206896552[/C][C]289.995873802536[/C][C]42.1527400696013[/C][/ROW]
[ROW][C]Trimmed Mean ( 8 / 24 )[/C][C]12191.3035714286[/C][C]290.194964601882[/C][C]42.0107343632023[/C][/ROW]
[ROW][C]Trimmed Mean ( 9 / 24 )[/C][C]12156.7407407407[/C][C]290.169486106818[/C][C]41.8953105781273[/C][/ROW]
[ROW][C]Trimmed Mean ( 10 / 24 )[/C][C]12119.8269230769[/C][C]290.077256991124[/C][C]41.7813759299571[/C][/ROW]
[ROW][C]Trimmed Mean ( 11 / 24 )[/C][C]12080.12[/C][C]289.438821761797[/C][C]41.7363501083546[/C][/ROW]
[ROW][C]Trimmed Mean ( 12 / 24 )[/C][C]12037.4791666667[/C][C]288.752304939349[/C][C]41.6879067656104[/C][/ROW]
[ROW][C]Trimmed Mean ( 13 / 24 )[/C][C]11993.8043478261[/C][C]288.026918729176[/C][C]41.6412618679698[/C][/ROW]
[ROW][C]Trimmed Mean ( 14 / 24 )[/C][C]11946.5681818182[/C][C]286.613922532671[/C][C]41.6817441255193[/C][/ROW]
[ROW][C]Trimmed Mean ( 15 / 24 )[/C][C]11895.0952380952[/C][C]284.359011458791[/C][C]41.8312582290681[/C][/ROW]
[ROW][C]Trimmed Mean ( 16 / 24 )[/C][C]11839.675[/C][C]281.068979095195[/C][C]42.1237343164434[/C][/ROW]
[ROW][C]Trimmed Mean ( 17 / 24 )[/C][C]11778.3421052632[/C][C]276.033916413195[/C][C]42.6699090398449[/C][/ROW]
[ROW][C]Trimmed Mean ( 18 / 24 )[/C][C]11717.0833333333[/C][C]271.403502027329[/C][C]43.1721891788761[/C][/ROW]
[ROW][C]Trimmed Mean ( 19 / 24 )[/C][C]11652.4705882353[/C][C]265.664220657918[/C][C]43.8616482090735[/C][/ROW]
[ROW][C]Trimmed Mean ( 20 / 24 )[/C][C]11579.25[/C][C]257.099731966837[/C][C]45.0379699403716[/C][/ROW]
[ROW][C]Trimmed Mean ( 21 / 24 )[/C][C]11500.8666666667[/C][C]246.705123128357[/C][C]46.6178671963895[/C][/ROW]
[ROW][C]Trimmed Mean ( 22 / 24 )[/C][C]11411.6071428571[/C][C]230.297032372984[/C][C]49.5516899426439[/C][/ROW]
[ROW][C]Trimmed Mean ( 23 / 24 )[/C][C]11310.1923076923[/C][C]204.018709694296[/C][C]55.4370347927385[/C][/ROW]
[ROW][C]Trimmed Mean ( 24 / 24 )[/C][C]11204[/C][C]169.492625208296[/C][C]66.1031710744403[/C][/ROW]
[ROW][C]Median[/C][C]10859[/C][C][/C][C][/C][/ROW]
[ROW][C]Midrange[/C][C]13733[/C][C][/C][C][/C][/ROW]
[ROW][C]Midmean - Weighted Average at Xnp[/C][C]11683.0270270270[/C][C][/C][C][/C][/ROW]
[ROW][C]Midmean - Weighted Average at X(n+1)p[/C][C]11717.0833333333[/C][C][/C][C][/C][/ROW]
[ROW][C]Midmean - Empirical Distribution Function[/C][C]11683.0270270270[/C][C][/C][C][/C][/ROW]
[ROW][C]Midmean - Empirical Distribution Function - Averaging[/C][C]11717.0833333333[/C][C][/C][C][/C][/ROW]
[ROW][C]Midmean - Empirical Distribution Function - Interpolation[/C][C]11717.0833333333[/C][C][/C][C][/C][/ROW]
[ROW][C]Midmean - Closest Observation[/C][C]11683.0270270270[/C][C][/C][C][/C][/ROW]
[ROW][C]Midmean - True Basic - Statistics Graphics Toolkit[/C][C]11717.0833333333[/C][C][/C][C][/C][/ROW]
[ROW][C]Midmean - MS Excel (old versions)[/C][C]11778.3421052632[/C][C][/C][C][/C][/ROW]
[ROW][C]Number of observations[/C][C]72[/C][C][/C][C][/C][/ROW]
[/TABLE]
Source: https://freestatistics.org/blog/index.php?pk=10436&T=1

Globally Unique Identifier (entire table): ba.freestatistics.org/blog/index.php?pk=10436&T=1

As an alternative you can also use a QR Code:  

The GUIDs for individual cells are displayed in the table below:

Central Tendency - Ungrouped Data
MeasureValueS.E.Value/S.E.
Arithmetic Mean12463.6944444444302.09074647785341.2581139599990
Geometric Mean12222.1692291736
Harmonic Mean12002.7095824196
Quadratic Mean12720.9691203584
Winsorized Mean ( 1 / 24 )12464.5301.73739930229941.3090986693111
Winsorized Mean ( 2 / 24 )12448.8611111111297.44025208842241.8533168382683
Winsorized Mean ( 3 / 24 )12448.6527777778297.01435035893541.9126306952303
Winsorized Mean ( 4 / 24 )12429.0972222222288.64743682474343.059787257937
Winsorized Mean ( 5 / 24 )12423.1944444444287.39671386773943.2266405459376
Winsorized Mean ( 6 / 24 )12409.6944444444284.46670765081443.6244175880064
Winsorized Mean ( 7 / 24 )12402.7916666667281.76799156577344.0177452298427
Winsorized Mean ( 8 / 24 )12398.6805555556280.76375534789744.1605453673757
Winsorized Mean ( 9 / 24 )12396.6805555556278.53747948007544.5063284793685
Winsorized Mean ( 10 / 24 )12395.5694444444278.29910659815144.5404571935726
Winsorized Mean ( 11 / 24 )12392.8194444444274.74343582105145.1068809247776
Winsorized Mean ( 12 / 24 )12372.3194444444271.01332251494645.6520710112401
Winsorized Mean ( 13 / 24 )12369.0694444444269.84968525386045.8368866830742
Winsorized Mean ( 14 / 24 )12366.9305555556268.19273160500646.1121018513267
Winsorized Mean ( 15 / 24 )12356.9305555556266.13118501865346.4317270998868
Winsorized Mean ( 16 / 24 )12357.5972222222265.1500237189146.6060573893168
Winsorized Mean ( 17 / 24 )12299.0416666667253.58308546771948.5010332766548
Winsorized Mean ( 18 / 24 )12266.2916666667247.74491323425949.5117801069363
Winsorized Mean ( 19 / 24 )12270.7777777778245.10671418567450.0630014095917
Winsorized Mean ( 20 / 24 )12232.4444444444235.52429517674251.9370812054229
Winsorized Mean ( 21 / 24 )12229.8194444444234.02448553592852.2587173578763
Winsorized Mean ( 22 / 24 )12217.2916666667231.66928042358152.7359158034624
Winsorized Mean ( 23 / 24 )12124.3333333333212.41445576328957.0786639250413
Winsorized Mean ( 24 / 24 )11883.6666666667173.3449289638968.5550291992804
Trimmed Mean ( 1 / 24 )12427.4285714286298.72345976270441.6017830715422
Trimmed Mean ( 2 / 24 )12388.1764705882294.96387997884741.9989609286284
Trimmed Mean ( 3 / 24 )12355.0757575758292.98210110297942.1700701546718
Trimmed Mean ( 4 / 24 )12319.984375290.5525724669442.4019111942359
Trimmed Mean ( 5 / 24 )12288.3064516129290.30005865547642.3296726446635
Trimmed Mean ( 6 / 24 )12255.9333333333289.99208918361442.2629919589746
Trimmed Mean ( 7 / 24 )12224.1206896552289.99587380253642.1527400696013
Trimmed Mean ( 8 / 24 )12191.3035714286290.19496460188242.0107343632023
Trimmed Mean ( 9 / 24 )12156.7407407407290.16948610681841.8953105781273
Trimmed Mean ( 10 / 24 )12119.8269230769290.07725699112441.7813759299571
Trimmed Mean ( 11 / 24 )12080.12289.43882176179741.7363501083546
Trimmed Mean ( 12 / 24 )12037.4791666667288.75230493934941.6879067656104
Trimmed Mean ( 13 / 24 )11993.8043478261288.02691872917641.6412618679698
Trimmed Mean ( 14 / 24 )11946.5681818182286.61392253267141.6817441255193
Trimmed Mean ( 15 / 24 )11895.0952380952284.35901145879141.8312582290681
Trimmed Mean ( 16 / 24 )11839.675281.06897909519542.1237343164434
Trimmed Mean ( 17 / 24 )11778.3421052632276.03391641319542.6699090398449
Trimmed Mean ( 18 / 24 )11717.0833333333271.40350202732943.1721891788761
Trimmed Mean ( 19 / 24 )11652.4705882353265.66422065791843.8616482090735
Trimmed Mean ( 20 / 24 )11579.25257.09973196683745.0379699403716
Trimmed Mean ( 21 / 24 )11500.8666666667246.70512312835746.6178671963895
Trimmed Mean ( 22 / 24 )11411.6071428571230.29703237298449.5516899426439
Trimmed Mean ( 23 / 24 )11310.1923076923204.01870969429655.4370347927385
Trimmed Mean ( 24 / 24 )11204169.49262520829666.1031710744403
Median10859
Midrange13733
Midmean - Weighted Average at Xnp11683.0270270270
Midmean - Weighted Average at X(n+1)p11717.0833333333
Midmean - Empirical Distribution Function11683.0270270270
Midmean - Empirical Distribution Function - Averaging11717.0833333333
Midmean - Empirical Distribution Function - Interpolation11717.0833333333
Midmean - Closest Observation11683.0270270270
Midmean - True Basic - Statistics Graphics Toolkit11717.0833333333
Midmean - MS Excel (old versions)11778.3421052632
Number of observations72


Parameters (Session):
Parameters (R input):
R code (references can be found in the software module):
geomean <- function(x) {
return(exp(mean(log(x))))
}
harmean <- function(x) {
return(1/mean(1/x))
}
quamean <- function(x) {
return(sqrt(mean(x*x)))
}
winmean <- function(x) {
x <-sort(x[!is.na(x)])
n<-length(x)
denom <- 3
nodenom <- n/denom
if (nodenom>40) denom <- n/40
sqrtn = sqrt(n)
roundnodenom = floor(nodenom)
win <- array(NA,dim=c(roundnodenom,2))
for (j in 1:roundnodenom) {
win[j,1] <- (j*x[j+1]+sum(x[(j+1):(n-j)])+j*x[n-j])/n
win[j,2] <- sd(c(rep(x[j+1],j),x[(j+1):(n-j)],rep(x[n-j],j)))/sqrtn
}
return(win)
}
trimean <- function(x) {
x <-sort(x[!is.na(x)])
n<-length(x)
denom <- 3
nodenom <- n/denom
if (nodenom>40) denom <- n/40
sqrtn = sqrt(n)
roundnodenom = floor(nodenom)
tri <- array(NA,dim=c(roundnodenom,2))
for (j in 1:roundnodenom) {
tri[j,1] <- mean(x,trim=j/n)
tri[j,2] <- sd(x[(j+1):(n-j)]) / sqrt(n-j*2)
}
return(tri)
}
midrange <- function(x) {
return((max(x)+min(x))/2)
}
q1 <- function(data,n,p,i,f) {
np <- n*p;
i <<- floor(np)
f <<- np - i
qvalue <- (1-f)*data[i] + f*data[i+1]
}
q2 <- function(data,n,p,i,f) {
np <- (n+1)*p
i <<- floor(np)
f <<- np - i
qvalue <- (1-f)*data[i] + f*data[i+1]
}
q3 <- function(data,n,p,i,f) {
np <- n*p
i <<- floor(np)
f <<- np - i
if (f==0) {
qvalue <- data[i]
} else {
qvalue <- data[i+1]
}
}
q4 <- function(data,n,p,i,f) {
np <- n*p
i <<- floor(np)
f <<- np - i
if (f==0) {
qvalue <- (data[i]+data[i+1])/2
} else {
qvalue <- data[i+1]
}
}
q5 <- function(data,n,p,i,f) {
np <- (n-1)*p
i <<- floor(np)
f <<- np - i
if (f==0) {
qvalue <- data[i+1]
} else {
qvalue <- data[i+1] + f*(data[i+2]-data[i+1])
}
}
q6 <- function(data,n,p,i,f) {
np <- n*p+0.5
i <<- floor(np)
f <<- np - i
qvalue <- data[i]
}
q7 <- function(data,n,p,i,f) {
np <- (n+1)*p
i <<- floor(np)
f <<- np - i
if (f==0) {
qvalue <- data[i]
} else {
qvalue <- f*data[i] + (1-f)*data[i+1]
}
}
q8 <- function(data,n,p,i,f) {
np <- (n+1)*p
i <<- floor(np)
f <<- np - i
if (f==0) {
qvalue <- data[i]
} else {
if (f == 0.5) {
qvalue <- (data[i]+data[i+1])/2
} else {
if (f < 0.5) {
qvalue <- data[i]
} else {
qvalue <- data[i+1]
}
}
}
}
midmean <- function(x,def) {
x <-sort(x[!is.na(x)])
n<-length(x)
if (def==1) {
qvalue1 <- q1(x,n,0.25,i,f)
qvalue3 <- q1(x,n,0.75,i,f)
}
if (def==2) {
qvalue1 <- q2(x,n,0.25,i,f)
qvalue3 <- q2(x,n,0.75,i,f)
}
if (def==3) {
qvalue1 <- q3(x,n,0.25,i,f)
qvalue3 <- q3(x,n,0.75,i,f)
}
if (def==4) {
qvalue1 <- q4(x,n,0.25,i,f)
qvalue3 <- q4(x,n,0.75,i,f)
}
if (def==5) {
qvalue1 <- q5(x,n,0.25,i,f)
qvalue3 <- q5(x,n,0.75,i,f)
}
if (def==6) {
qvalue1 <- q6(x,n,0.25,i,f)
qvalue3 <- q6(x,n,0.75,i,f)
}
if (def==7) {
qvalue1 <- q7(x,n,0.25,i,f)
qvalue3 <- q7(x,n,0.75,i,f)
}
if (def==8) {
qvalue1 <- q8(x,n,0.25,i,f)
qvalue3 <- q8(x,n,0.75,i,f)
}
midm <- 0
myn <- 0
roundno4 <- round(n/4)
round3no4 <- round(3*n/4)
for (i in 1:n) {
if ((x[i]>=qvalue1) & (x[i]<=qvalue3)){
midm = midm + x[i]
myn = myn + 1
}
}
midm = midm / myn
return(midm)
}
(arm <- mean(x))
sqrtn <- sqrt(length(x))
(armse <- sd(x) / sqrtn)
(armose <- arm / armse)
(geo <- geomean(x))
(har <- harmean(x))
(qua <- quamean(x))
(win <- winmean(x))
(tri <- trimean(x))
(midr <- midrange(x))
midm <- array(NA,dim=8)
for (j in 1:8) midm[j] <- midmean(x,j)
midm
bitmap(file='test1.png')
lb <- win[,1] - 2*win[,2]
ub <- win[,1] + 2*win[,2]
if ((ylimmin == '') | (ylimmax == '')) plot(win[,1],type='b',main=main, xlab='j', pch=19, ylab='Winsorized Mean(j/n)', ylim=c(min(lb),max(ub))) else plot(win[,1],type='l',main=main, xlab='j', pch=19, ylab='Winsorized Mean(j/n)', ylim=c(ylimmin,ylimmax))
lines(ub,lty=3)
lines(lb,lty=3)
grid()
dev.off()
bitmap(file='test2.png')
lb <- tri[,1] - 2*tri[,2]
ub <- tri[,1] + 2*tri[,2]
if ((ylimmin == '') | (ylimmax == '')) plot(tri[,1],type='b',main=main, xlab='j', pch=19, ylab='Trimmed Mean(j/n)', ylim=c(min(lb),max(ub))) else plot(tri[,1],type='l',main=main, xlab='j', pch=19, ylab='Trimmed Mean(j/n)', ylim=c(ylimmin,ylimmax))
lines(ub,lty=3)
lines(lb,lty=3)
grid()
dev.off()
load(file='createtable')
a<-table.start()
a<-table.row.start(a)
a<-table.element(a,'Central Tendency - Ungrouped Data',4,TRUE)
a<-table.row.end(a)
a<-table.row.start(a)
a<-table.element(a,'Measure',header=TRUE)
a<-table.element(a,'Value',header=TRUE)
a<-table.element(a,'S.E.',header=TRUE)
a<-table.element(a,'Value/S.E.',header=TRUE)
a<-table.row.end(a)
a<-table.row.start(a)
a<-table.element(a,hyperlink('arithmetic_mean.htm', 'Arithmetic Mean', 'click to view the definition of the Arithmetic Mean'),header=TRUE)
a<-table.element(a,arm)
a<-table.element(a,hyperlink('arithmetic_mean_standard_error.htm', armse, 'click to view the definition of the Standard Error of the Arithmetic Mean'))
a<-table.element(a,armose)
a<-table.row.end(a)
a<-table.row.start(a)
a<-table.element(a,hyperlink('geometric_mean.htm', 'Geometric Mean', 'click to view the definition of the Geometric Mean'),header=TRUE)
a<-table.element(a,geo)
a<-table.element(a,'')
a<-table.row.end(a)
a<-table.row.start(a)
a<-table.element(a,hyperlink('harmonic_mean.htm', 'Harmonic Mean', 'click to view the definition of the Harmonic Mean'),header=TRUE)
a<-table.element(a,har)
a<-table.element(a,'')
a<-table.row.end(a)
a<-table.row.start(a)
a<-table.element(a,hyperlink('quadratic_mean.htm', 'Quadratic Mean', 'click to view the definition of the Quadratic Mean'),header=TRUE)
a<-table.element(a,qua)
a<-table.element(a,'')
a<-table.row.end(a)
for (j in 1:length(win[,1])) {
a<-table.row.start(a)
mylabel <- paste('Winsorized Mean (',j)
mylabel <- paste(mylabel,'/')
mylabel <- paste(mylabel,length(win[,1]))
mylabel <- paste(mylabel,')')
a<-table.element(a,hyperlink('winsorized_mean.htm', mylabel, 'click to view the definition of the Winsorized Mean'),header=TRUE)
a<-table.element(a,win[j,1])
a<-table.element(a,win[j,2])
a<-table.element(a,win[j,1]/win[j,2])
a<-table.row.end(a)
}
for (j in 1:length(tri[,1])) {
a<-table.row.start(a)
mylabel <- paste('Trimmed Mean (',j)
mylabel <- paste(mylabel,'/')
mylabel <- paste(mylabel,length(tri[,1]))
mylabel <- paste(mylabel,')')
a<-table.element(a,hyperlink('arithmetic_mean.htm', mylabel, 'click to view the definition of the Trimmed Mean'),header=TRUE)
a<-table.element(a,tri[j,1])
a<-table.element(a,tri[j,2])
a<-table.element(a,tri[j,1]/tri[j,2])
a<-table.row.end(a)
}
a<-table.row.start(a)
a<-table.element(a,hyperlink('median_1.htm', 'Median', 'click to view the definition of the Median'),header=TRUE)
a<-table.element(a,median(x))
a<-table.element(a,'')
a<-table.row.end(a)
a<-table.row.start(a)
a<-table.element(a,hyperlink('midrange.htm', 'Midrange', 'click to view the definition of the Midrange'),header=TRUE)
a<-table.element(a,midr)
a<-table.element(a,'')
a<-table.row.end(a)
a<-table.row.start(a)
mymid <- hyperlink('midmean.htm', 'Midmean', 'click to view the definition of the Midmean')
mylabel <- paste(mymid,hyperlink('method_1.htm','Weighted Average at Xnp',''),sep=' - ')
a<-table.element(a,mylabel,header=TRUE)
a<-table.element(a,midm[1])
a<-table.element(a,'')
a<-table.row.end(a)
a<-table.row.start(a)
mymid <- hyperlink('midmean.htm', 'Midmean', 'click to view the definition of the Midmean')
mylabel <- paste(mymid,hyperlink('method_2.htm','Weighted Average at X(n+1)p',''),sep=' - ')
a<-table.element(a,mylabel,header=TRUE)
a<-table.element(a,midm[2])
a<-table.element(a,'')
a<-table.row.end(a)
a<-table.row.start(a)
mymid <- hyperlink('midmean.htm', 'Midmean', 'click to view the definition of the Midmean')
mylabel <- paste(mymid,hyperlink('method_3.htm','Empirical Distribution Function',''),sep=' - ')
a<-table.element(a,mylabel,header=TRUE)
a<-table.element(a,midm[3])
a<-table.element(a,'')
a<-table.row.end(a)
a<-table.row.start(a)
mymid <- hyperlink('midmean.htm', 'Midmean', 'click to view the definition of the Midmean')
mylabel <- paste(mymid,hyperlink('method_4.htm','Empirical Distribution Function - Averaging',''),sep=' - ')
a<-table.element(a,mylabel,header=TRUE)
a<-table.element(a,midm[4])
a<-table.element(a,'')
a<-table.row.end(a)
a<-table.row.start(a)
mymid <- hyperlink('midmean.htm', 'Midmean', 'click to view the definition of the Midmean')
mylabel <- paste(mymid,hyperlink('method_5.htm','Empirical Distribution Function - Interpolation',''),sep=' - ')
a<-table.element(a,mylabel,header=TRUE)
a<-table.element(a,midm[5])
a<-table.element(a,'')
a<-table.row.end(a)
a<-table.row.start(a)
mymid <- hyperlink('midmean.htm', 'Midmean', 'click to view the definition of the Midmean')
mylabel <- paste(mymid,hyperlink('method_6.htm','Closest Observation',''),sep=' - ')
a<-table.element(a,mylabel,header=TRUE)
a<-table.element(a,midm[6])
a<-table.element(a,'')
a<-table.row.end(a)
a<-table.row.start(a)
mymid <- hyperlink('midmean.htm', 'Midmean', 'click to view the definition of the Midmean')
mylabel <- paste(mymid,hyperlink('method_7.htm','True Basic - Statistics Graphics Toolkit',''),sep=' - ')
a<-table.element(a,mylabel,header=TRUE)
a<-table.element(a,midm[7])
a<-table.element(a,'')
a<-table.row.end(a)
a<-table.row.start(a)
mymid <- hyperlink('midmean.htm', 'Midmean', 'click to view the definition of the Midmean')
mylabel <- paste(mymid,hyperlink('method_8.htm','MS Excel (old versions)',''),sep=' - ')
a<-table.element(a,mylabel,header=TRUE)
a<-table.element(a,midm[8])
a<-table.element(a,'')
a<-table.row.end(a)
a<-table.row.start(a)
a<-table.element(a,'Number of observations',header=TRUE)
a<-table.element(a,length(x))
a<-table.element(a,'')
a<-table.row.end(a)
a<-table.end(a)
table.save(a,file='mytable.tab')