Free Statistics

of Irreproducible Research!

Author's title

Author*Unverified author*
R Software Modulerwasp_centraltendency.wasp
Title produced by softwareCentral Tendency
Date of computationThu, 24 Apr 2008 11:57:09 -0600
Cite this page as followsStatistical Computations at FreeStatistics.org, Office for Research Development and Education, URL https://freestatistics.org/blog/index.php?v=date/2008/Apr/24/t120905988740avmvr2zd2bsyr.htm/, Retrieved Sun, 12 May 2024 09:26:00 +0000
Statistical Computations at FreeStatistics.org, Office for Research Development and Education, URL https://freestatistics.org/blog/index.php?pk=10705, Retrieved Sun, 12 May 2024 09:26:00 +0000
QR Codes:

Original text written by user:
IsPrivate?No (this computation is public)
User-defined keywords
Estimated Impact271
Family? (F = Feedback message, R = changed R code, M = changed R Module, P = changed Parameters, D = changed Data)
-       [Central Tendency] [Cijferreeks - Oli...] [2008-04-24 17:57:09] [e744b461908af7c125bdbb2f3548f5e0] [Current]
Feedback Forum

Post a new message
Dataseries X:
90,2
94,3
96
99
103,3
113,1
112,8
112,1
107,4
111
110,5
110,8
112,4
111,5
116,2
122,5
121,3
113,9
110,7
120,8
141,1
147,4
148
158,1
165
187
190,3
182,4
168,8
151,2
120,1
112,5
106,2
107,1
108,5
106,5
108,3
125,6
124
127,2
136,9
135,8
124,3
115,4
113,6
114,4
118,4
117
116,5
115,4
113,6
117,4
116,9
116,4
111,1
110,2
118,9
131,8
130,6
138,3
148,4
148,7
144,3
152,5
162,9
167,2
166,5
185,6
193,2
207,8
223,4
246,4


Summary of computational transaction
Raw Inputview raw input (R code)
Raw Outputview raw output of R engine
Computing time2 seconds
R Server'Gwilym Jenkins' @ 72.249.127.135

\begin{tabular}{lllllllll}
\hline
Summary of computational transaction \tabularnewline
Raw Input & view raw input (R code)  \tabularnewline
Raw Output & view raw output of R engine  \tabularnewline
Computing time & 2 seconds \tabularnewline
R Server & 'Gwilym Jenkins' @ 72.249.127.135 \tabularnewline
\hline
\end{tabular}
%Source: https://freestatistics.org/blog/index.php?pk=10705&T=0

[TABLE]
[ROW][C]Summary of computational transaction[/C][/ROW]
[ROW][C]Raw Input[/C][C]view raw input (R code) [/C][/ROW]
[ROW][C]Raw Output[/C][C]view raw output of R engine [/C][/ROW]
[ROW][C]Computing time[/C][C]2 seconds[/C][/ROW]
[ROW][C]R Server[/C][C]'Gwilym Jenkins' @ 72.249.127.135[/C][/ROW]
[/TABLE]
Source: https://freestatistics.org/blog/index.php?pk=10705&T=0

Globally Unique Identifier (entire table): ba.freestatistics.org/blog/index.php?pk=10705&T=0

As an alternative you can also use a QR Code:  

The GUIDs for individual cells are displayed in the table below:

Summary of computational transaction
Raw Inputview raw input (R code)
Raw Outputview raw output of R engine
Computing time2 seconds
R Server'Gwilym Jenkins' @ 72.249.127.135


Central Tendency - Ungrouped Data
MeasureValueS.E.Value/S.E.
Arithmetic Mean132.4291666666673.7201258863024335.5980336994168
Geometric Mean129.272300875257
Harmonic Mean126.583629411952
Quadratic Mean136.088489900261
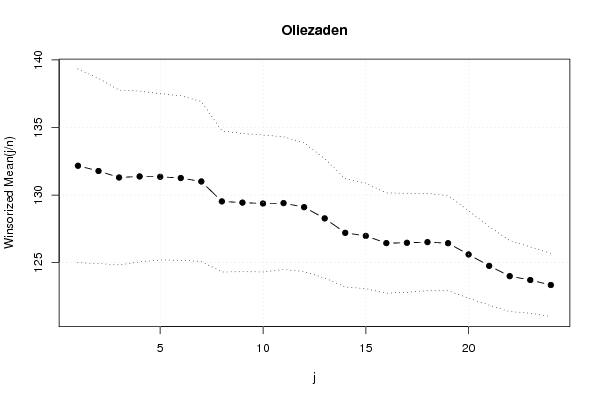
Winsorized Mean ( 1 / 24 )132.1666666666673.5849461377601836.8671275907209
Winsorized Mean ( 2 / 24 )131.7805555555563.432501174785238.3919913920502
Winsorized Mean ( 3 / 24 )131.2972222222223.2373571183884740.5569164663492
Winsorized Mean ( 4 / 24 )131.3753.1627791494754841.5378354893315
Winsorized Mean ( 5 / 24 )131.3472222222223.0793483779517942.6542261871608
Winsorized Mean ( 6 / 24 )131.2555555555563.0469769317937043.0773053074240
Winsorized Mean ( 7 / 24 )131.0027777777782.9632325512300144.2094150603873
Winsorized Mean ( 8 / 24 )129.5252.6133001803372849.563766525774
Winsorized Mean ( 9 / 24 )129.43752.5580815183222550.5994430094993
Winsorized Mean ( 10 / 24 )129.3680555555562.5347173344433851.0384545833253
Winsorized Mean ( 11 / 24 )129.3986111111112.4583458605995452.6364549370418
Winsorized Mean ( 12 / 24 )129.0986111111112.3821671307596254.1937672819558
Winsorized Mean ( 13 / 24 )128.2680555555562.2089772968326558.0667151896368
Winsorized Mean ( 14 / 24 )127.1986111111112.0061724909881663.4036263992725
Winsorized Mean ( 15 / 24 )126.9694444444441.9536607815808464.9905273430862
Winsorized Mean ( 16 / 24 )126.4361111111111.8555823503636468.1382376192215
Winsorized Mean ( 17 / 24 )126.4597222222221.8326990577175969.0019027890553
Winsorized Mean ( 18 / 24 )126.5097222222221.7987684446687670.3312995050447
Winsorized Mean ( 19 / 24 )126.4305555555561.7632836318164971.7017689464456
Winsorized Mean ( 20 / 24 )125.5972222222221.6178374979841177.6327797932246
Winsorized Mean ( 21 / 24 )124.7513888888891.4579982754673885.5634680698767
Winsorized Mean ( 22 / 24 )123.98751.3140788997816494.3531625236527
Winsorized Mean ( 23 / 24 )123.71.22731050668207100.789489967304
Winsorized Mean ( 24 / 24 )123.3333333333331.17206664447562105.227235938032
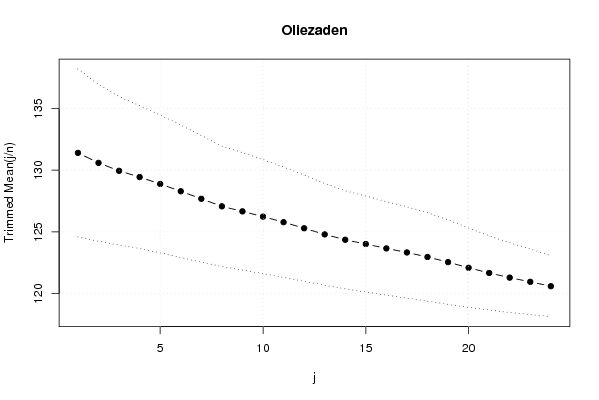
Trimmed Mean ( 1 / 24 )131.4042857142863.4020000424268138.6255979057981
Trimmed Mean ( 2 / 24 )130.5970588235293.1780724873425241.0931655409577
Trimmed Mean ( 3 / 24 )129.9515151515153.0085931648886443.1934489076476
Trimmed Mean ( 4 / 24 )129.4468752.8977635471426644.6713035394627
Trimmed Mean ( 5 / 24 )128.8870967741942.7905298828977246.1873200369944
Trimmed Mean ( 6 / 24 )128.2966666666672.6859079482721247.7665910885746
Trimmed Mean ( 7 / 24 )127.6844827586212.5653831240272449.7720911791827
Trimmed Mean ( 8 / 24 )127.0752.4388032646436252.1054739602251
Trimmed Mean ( 9 / 24 )126.6666666666672.3778341065841153.2697660934094
Trimmed Mean ( 10 / 24 )126.2403846153852.3133396679740354.570622015894
Trimmed Mean ( 11 / 24 )125.792.235756275278956.262841075693
Trimmed Mean ( 12 / 24 )125.2979166666672.1526918856311558.2052255146262
Trimmed Mean ( 13 / 24 )124.8021739130432.0630508086184960.4939894798891
Trimmed Mean ( 14 / 24 )124.3659090909091.9902376518930862.4879691993639
Trimmed Mean ( 15 / 24 )124.0190476190481.9448978431151063.7663556767636
Trimmed Mean ( 16 / 24 )123.6651.8947246264975865.2680596803114
Trimmed Mean ( 17 / 24 )123.3368421052631.8499256878413566.6712413995304
Trimmed Mean ( 18 / 24 )122.9694444444441.7902993429070568.6865271618597
Trimmed Mean ( 19 / 24 )122.5529411764711.7118504612487871.5909151825498
Trimmed Mean ( 20 / 24 )122.093751.6066704294756975.9917826083616
Trimmed Mean ( 21 / 24 )121.6733333333331.5048880764380380.852081452679
Trimmed Mean ( 22 / 24 )121.2964285714291.4133573124543585.8214886657308
Trimmed Mean ( 23 / 24 )120.9576923076921.3306351644340490.9022213907442
Trimmed Mean ( 24 / 24 )120.61.2332354054345897.7915485304298
Median118.65
Midrange168.3
Midmean - Weighted Average at Xnp122.659459459459
Midmean - Weighted Average at X(n+1)p122.969444444444
Midmean - Empirical Distribution Function122.659459459459
Midmean - Empirical Distribution Function - Averaging122.969444444444
Midmean - Empirical Distribution Function - Interpolation122.969444444444
Midmean - Closest Observation122.659459459459
Midmean - True Basic - Statistics Graphics Toolkit122.969444444444
Midmean - MS Excel (old versions)123.336842105263
Number of observations72

\begin{tabular}{lllllllll}
\hline
Central Tendency - Ungrouped Data \tabularnewline
Measure & Value & S.E. & Value/S.E. \tabularnewline
Arithmetic Mean & 132.429166666667 & 3.72012588630243 & 35.5980336994168 \tabularnewline
Geometric Mean & 129.272300875257 &  &  \tabularnewline
Harmonic Mean & 126.583629411952 &  &  \tabularnewline
Quadratic Mean & 136.088489900261 &  &  \tabularnewline
Winsorized Mean ( 1 / 24 ) & 132.166666666667 & 3.58494613776018 & 36.8671275907209 \tabularnewline
Winsorized Mean ( 2 / 24 ) & 131.780555555556 & 3.4325011747852 & 38.3919913920502 \tabularnewline
Winsorized Mean ( 3 / 24 ) & 131.297222222222 & 3.23735711838847 & 40.5569164663492 \tabularnewline
Winsorized Mean ( 4 / 24 ) & 131.375 & 3.16277914947548 & 41.5378354893315 \tabularnewline
Winsorized Mean ( 5 / 24 ) & 131.347222222222 & 3.07934837795179 & 42.6542261871608 \tabularnewline
Winsorized Mean ( 6 / 24 ) & 131.255555555556 & 3.04697693179370 & 43.0773053074240 \tabularnewline
Winsorized Mean ( 7 / 24 ) & 131.002777777778 & 2.96323255123001 & 44.2094150603873 \tabularnewline
Winsorized Mean ( 8 / 24 ) & 129.525 & 2.61330018033728 & 49.563766525774 \tabularnewline
Winsorized Mean ( 9 / 24 ) & 129.4375 & 2.55808151832225 & 50.5994430094993 \tabularnewline
Winsorized Mean ( 10 / 24 ) & 129.368055555556 & 2.53471733444338 & 51.0384545833253 \tabularnewline
Winsorized Mean ( 11 / 24 ) & 129.398611111111 & 2.45834586059954 & 52.6364549370418 \tabularnewline
Winsorized Mean ( 12 / 24 ) & 129.098611111111 & 2.38216713075962 & 54.1937672819558 \tabularnewline
Winsorized Mean ( 13 / 24 ) & 128.268055555556 & 2.20897729683265 & 58.0667151896368 \tabularnewline
Winsorized Mean ( 14 / 24 ) & 127.198611111111 & 2.00617249098816 & 63.4036263992725 \tabularnewline
Winsorized Mean ( 15 / 24 ) & 126.969444444444 & 1.95366078158084 & 64.9905273430862 \tabularnewline
Winsorized Mean ( 16 / 24 ) & 126.436111111111 & 1.85558235036364 & 68.1382376192215 \tabularnewline
Winsorized Mean ( 17 / 24 ) & 126.459722222222 & 1.83269905771759 & 69.0019027890553 \tabularnewline
Winsorized Mean ( 18 / 24 ) & 126.509722222222 & 1.79876844466876 & 70.3312995050447 \tabularnewline
Winsorized Mean ( 19 / 24 ) & 126.430555555556 & 1.76328363181649 & 71.7017689464456 \tabularnewline
Winsorized Mean ( 20 / 24 ) & 125.597222222222 & 1.61783749798411 & 77.6327797932246 \tabularnewline
Winsorized Mean ( 21 / 24 ) & 124.751388888889 & 1.45799827546738 & 85.5634680698767 \tabularnewline
Winsorized Mean ( 22 / 24 ) & 123.9875 & 1.31407889978164 & 94.3531625236527 \tabularnewline
Winsorized Mean ( 23 / 24 ) & 123.7 & 1.22731050668207 & 100.789489967304 \tabularnewline
Winsorized Mean ( 24 / 24 ) & 123.333333333333 & 1.17206664447562 & 105.227235938032 \tabularnewline
Trimmed Mean ( 1 / 24 ) & 131.404285714286 & 3.40200004242681 & 38.6255979057981 \tabularnewline
Trimmed Mean ( 2 / 24 ) & 130.597058823529 & 3.17807248734252 & 41.0931655409577 \tabularnewline
Trimmed Mean ( 3 / 24 ) & 129.951515151515 & 3.00859316488864 & 43.1934489076476 \tabularnewline
Trimmed Mean ( 4 / 24 ) & 129.446875 & 2.89776354714266 & 44.6713035394627 \tabularnewline
Trimmed Mean ( 5 / 24 ) & 128.887096774194 & 2.79052988289772 & 46.1873200369944 \tabularnewline
Trimmed Mean ( 6 / 24 ) & 128.296666666667 & 2.68590794827212 & 47.7665910885746 \tabularnewline
Trimmed Mean ( 7 / 24 ) & 127.684482758621 & 2.56538312402724 & 49.7720911791827 \tabularnewline
Trimmed Mean ( 8 / 24 ) & 127.075 & 2.43880326464362 & 52.1054739602251 \tabularnewline
Trimmed Mean ( 9 / 24 ) & 126.666666666667 & 2.37783410658411 & 53.2697660934094 \tabularnewline
Trimmed Mean ( 10 / 24 ) & 126.240384615385 & 2.31333966797403 & 54.570622015894 \tabularnewline
Trimmed Mean ( 11 / 24 ) & 125.79 & 2.2357562752789 & 56.262841075693 \tabularnewline
Trimmed Mean ( 12 / 24 ) & 125.297916666667 & 2.15269188563115 & 58.2052255146262 \tabularnewline
Trimmed Mean ( 13 / 24 ) & 124.802173913043 & 2.06305080861849 & 60.4939894798891 \tabularnewline
Trimmed Mean ( 14 / 24 ) & 124.365909090909 & 1.99023765189308 & 62.4879691993639 \tabularnewline
Trimmed Mean ( 15 / 24 ) & 124.019047619048 & 1.94489784311510 & 63.7663556767636 \tabularnewline
Trimmed Mean ( 16 / 24 ) & 123.665 & 1.89472462649758 & 65.2680596803114 \tabularnewline
Trimmed Mean ( 17 / 24 ) & 123.336842105263 & 1.84992568784135 & 66.6712413995304 \tabularnewline
Trimmed Mean ( 18 / 24 ) & 122.969444444444 & 1.79029934290705 & 68.6865271618597 \tabularnewline
Trimmed Mean ( 19 / 24 ) & 122.552941176471 & 1.71185046124878 & 71.5909151825498 \tabularnewline
Trimmed Mean ( 20 / 24 ) & 122.09375 & 1.60667042947569 & 75.9917826083616 \tabularnewline
Trimmed Mean ( 21 / 24 ) & 121.673333333333 & 1.50488807643803 & 80.852081452679 \tabularnewline
Trimmed Mean ( 22 / 24 ) & 121.296428571429 & 1.41335731245435 & 85.8214886657308 \tabularnewline
Trimmed Mean ( 23 / 24 ) & 120.957692307692 & 1.33063516443404 & 90.9022213907442 \tabularnewline
Trimmed Mean ( 24 / 24 ) & 120.6 & 1.23323540543458 & 97.7915485304298 \tabularnewline
Median & 118.65 &  &  \tabularnewline
Midrange & 168.3 &  &  \tabularnewline
Midmean - Weighted Average at Xnp & 122.659459459459 &  &  \tabularnewline
Midmean - Weighted Average at X(n+1)p & 122.969444444444 &  &  \tabularnewline
Midmean - Empirical Distribution Function & 122.659459459459 &  &  \tabularnewline
Midmean - Empirical Distribution Function - Averaging & 122.969444444444 &  &  \tabularnewline
Midmean - Empirical Distribution Function - Interpolation & 122.969444444444 &  &  \tabularnewline
Midmean - Closest Observation & 122.659459459459 &  &  \tabularnewline
Midmean - True Basic - Statistics Graphics Toolkit & 122.969444444444 &  &  \tabularnewline
Midmean - MS Excel (old versions) & 123.336842105263 &  &  \tabularnewline
Number of observations & 72 &  &  \tabularnewline
\hline
\end{tabular}
%Source: https://freestatistics.org/blog/index.php?pk=10705&T=1

[TABLE]
[ROW][C]Central Tendency - Ungrouped Data[/C][/ROW]
[ROW][C]Measure[/C][C]Value[/C][C]S.E.[/C][C]Value/S.E.[/C][/ROW]
[ROW][C]Arithmetic Mean[/C][C]132.429166666667[/C][C]3.72012588630243[/C][C]35.5980336994168[/C][/ROW]
[ROW][C]Geometric Mean[/C][C]129.272300875257[/C][C][/C][C][/C][/ROW]
[ROW][C]Harmonic Mean[/C][C]126.583629411952[/C][C][/C][C][/C][/ROW]
[ROW][C]Quadratic Mean[/C][C]136.088489900261[/C][C][/C][C][/C][/ROW]
[ROW][C]Winsorized Mean ( 1 / 24 )[/C][C]132.166666666667[/C][C]3.58494613776018[/C][C]36.8671275907209[/C][/ROW]
[ROW][C]Winsorized Mean ( 2 / 24 )[/C][C]131.780555555556[/C][C]3.4325011747852[/C][C]38.3919913920502[/C][/ROW]
[ROW][C]Winsorized Mean ( 3 / 24 )[/C][C]131.297222222222[/C][C]3.23735711838847[/C][C]40.5569164663492[/C][/ROW]
[ROW][C]Winsorized Mean ( 4 / 24 )[/C][C]131.375[/C][C]3.16277914947548[/C][C]41.5378354893315[/C][/ROW]
[ROW][C]Winsorized Mean ( 5 / 24 )[/C][C]131.347222222222[/C][C]3.07934837795179[/C][C]42.6542261871608[/C][/ROW]
[ROW][C]Winsorized Mean ( 6 / 24 )[/C][C]131.255555555556[/C][C]3.04697693179370[/C][C]43.0773053074240[/C][/ROW]
[ROW][C]Winsorized Mean ( 7 / 24 )[/C][C]131.002777777778[/C][C]2.96323255123001[/C][C]44.2094150603873[/C][/ROW]
[ROW][C]Winsorized Mean ( 8 / 24 )[/C][C]129.525[/C][C]2.61330018033728[/C][C]49.563766525774[/C][/ROW]
[ROW][C]Winsorized Mean ( 9 / 24 )[/C][C]129.4375[/C][C]2.55808151832225[/C][C]50.5994430094993[/C][/ROW]
[ROW][C]Winsorized Mean ( 10 / 24 )[/C][C]129.368055555556[/C][C]2.53471733444338[/C][C]51.0384545833253[/C][/ROW]
[ROW][C]Winsorized Mean ( 11 / 24 )[/C][C]129.398611111111[/C][C]2.45834586059954[/C][C]52.6364549370418[/C][/ROW]
[ROW][C]Winsorized Mean ( 12 / 24 )[/C][C]129.098611111111[/C][C]2.38216713075962[/C][C]54.1937672819558[/C][/ROW]
[ROW][C]Winsorized Mean ( 13 / 24 )[/C][C]128.268055555556[/C][C]2.20897729683265[/C][C]58.0667151896368[/C][/ROW]
[ROW][C]Winsorized Mean ( 14 / 24 )[/C][C]127.198611111111[/C][C]2.00617249098816[/C][C]63.4036263992725[/C][/ROW]
[ROW][C]Winsorized Mean ( 15 / 24 )[/C][C]126.969444444444[/C][C]1.95366078158084[/C][C]64.9905273430862[/C][/ROW]
[ROW][C]Winsorized Mean ( 16 / 24 )[/C][C]126.436111111111[/C][C]1.85558235036364[/C][C]68.1382376192215[/C][/ROW]
[ROW][C]Winsorized Mean ( 17 / 24 )[/C][C]126.459722222222[/C][C]1.83269905771759[/C][C]69.0019027890553[/C][/ROW]
[ROW][C]Winsorized Mean ( 18 / 24 )[/C][C]126.509722222222[/C][C]1.79876844466876[/C][C]70.3312995050447[/C][/ROW]
[ROW][C]Winsorized Mean ( 19 / 24 )[/C][C]126.430555555556[/C][C]1.76328363181649[/C][C]71.7017689464456[/C][/ROW]
[ROW][C]Winsorized Mean ( 20 / 24 )[/C][C]125.597222222222[/C][C]1.61783749798411[/C][C]77.6327797932246[/C][/ROW]
[ROW][C]Winsorized Mean ( 21 / 24 )[/C][C]124.751388888889[/C][C]1.45799827546738[/C][C]85.5634680698767[/C][/ROW]
[ROW][C]Winsorized Mean ( 22 / 24 )[/C][C]123.9875[/C][C]1.31407889978164[/C][C]94.3531625236527[/C][/ROW]
[ROW][C]Winsorized Mean ( 23 / 24 )[/C][C]123.7[/C][C]1.22731050668207[/C][C]100.789489967304[/C][/ROW]
[ROW][C]Winsorized Mean ( 24 / 24 )[/C][C]123.333333333333[/C][C]1.17206664447562[/C][C]105.227235938032[/C][/ROW]
[ROW][C]Trimmed Mean ( 1 / 24 )[/C][C]131.404285714286[/C][C]3.40200004242681[/C][C]38.6255979057981[/C][/ROW]
[ROW][C]Trimmed Mean ( 2 / 24 )[/C][C]130.597058823529[/C][C]3.17807248734252[/C][C]41.0931655409577[/C][/ROW]
[ROW][C]Trimmed Mean ( 3 / 24 )[/C][C]129.951515151515[/C][C]3.00859316488864[/C][C]43.1934489076476[/C][/ROW]
[ROW][C]Trimmed Mean ( 4 / 24 )[/C][C]129.446875[/C][C]2.89776354714266[/C][C]44.6713035394627[/C][/ROW]
[ROW][C]Trimmed Mean ( 5 / 24 )[/C][C]128.887096774194[/C][C]2.79052988289772[/C][C]46.1873200369944[/C][/ROW]
[ROW][C]Trimmed Mean ( 6 / 24 )[/C][C]128.296666666667[/C][C]2.68590794827212[/C][C]47.7665910885746[/C][/ROW]
[ROW][C]Trimmed Mean ( 7 / 24 )[/C][C]127.684482758621[/C][C]2.56538312402724[/C][C]49.7720911791827[/C][/ROW]
[ROW][C]Trimmed Mean ( 8 / 24 )[/C][C]127.075[/C][C]2.43880326464362[/C][C]52.1054739602251[/C][/ROW]
[ROW][C]Trimmed Mean ( 9 / 24 )[/C][C]126.666666666667[/C][C]2.37783410658411[/C][C]53.2697660934094[/C][/ROW]
[ROW][C]Trimmed Mean ( 10 / 24 )[/C][C]126.240384615385[/C][C]2.31333966797403[/C][C]54.570622015894[/C][/ROW]
[ROW][C]Trimmed Mean ( 11 / 24 )[/C][C]125.79[/C][C]2.2357562752789[/C][C]56.262841075693[/C][/ROW]
[ROW][C]Trimmed Mean ( 12 / 24 )[/C][C]125.297916666667[/C][C]2.15269188563115[/C][C]58.2052255146262[/C][/ROW]
[ROW][C]Trimmed Mean ( 13 / 24 )[/C][C]124.802173913043[/C][C]2.06305080861849[/C][C]60.4939894798891[/C][/ROW]
[ROW][C]Trimmed Mean ( 14 / 24 )[/C][C]124.365909090909[/C][C]1.99023765189308[/C][C]62.4879691993639[/C][/ROW]
[ROW][C]Trimmed Mean ( 15 / 24 )[/C][C]124.019047619048[/C][C]1.94489784311510[/C][C]63.7663556767636[/C][/ROW]
[ROW][C]Trimmed Mean ( 16 / 24 )[/C][C]123.665[/C][C]1.89472462649758[/C][C]65.2680596803114[/C][/ROW]
[ROW][C]Trimmed Mean ( 17 / 24 )[/C][C]123.336842105263[/C][C]1.84992568784135[/C][C]66.6712413995304[/C][/ROW]
[ROW][C]Trimmed Mean ( 18 / 24 )[/C][C]122.969444444444[/C][C]1.79029934290705[/C][C]68.6865271618597[/C][/ROW]
[ROW][C]Trimmed Mean ( 19 / 24 )[/C][C]122.552941176471[/C][C]1.71185046124878[/C][C]71.5909151825498[/C][/ROW]
[ROW][C]Trimmed Mean ( 20 / 24 )[/C][C]122.09375[/C][C]1.60667042947569[/C][C]75.9917826083616[/C][/ROW]
[ROW][C]Trimmed Mean ( 21 / 24 )[/C][C]121.673333333333[/C][C]1.50488807643803[/C][C]80.852081452679[/C][/ROW]
[ROW][C]Trimmed Mean ( 22 / 24 )[/C][C]121.296428571429[/C][C]1.41335731245435[/C][C]85.8214886657308[/C][/ROW]
[ROW][C]Trimmed Mean ( 23 / 24 )[/C][C]120.957692307692[/C][C]1.33063516443404[/C][C]90.9022213907442[/C][/ROW]
[ROW][C]Trimmed Mean ( 24 / 24 )[/C][C]120.6[/C][C]1.23323540543458[/C][C]97.7915485304298[/C][/ROW]
[ROW][C]Median[/C][C]118.65[/C][C][/C][C][/C][/ROW]
[ROW][C]Midrange[/C][C]168.3[/C][C][/C][C][/C][/ROW]
[ROW][C]Midmean - Weighted Average at Xnp[/C][C]122.659459459459[/C][C][/C][C][/C][/ROW]
[ROW][C]Midmean - Weighted Average at X(n+1)p[/C][C]122.969444444444[/C][C][/C][C][/C][/ROW]
[ROW][C]Midmean - Empirical Distribution Function[/C][C]122.659459459459[/C][C][/C][C][/C][/ROW]
[ROW][C]Midmean - Empirical Distribution Function - Averaging[/C][C]122.969444444444[/C][C][/C][C][/C][/ROW]
[ROW][C]Midmean - Empirical Distribution Function - Interpolation[/C][C]122.969444444444[/C][C][/C][C][/C][/ROW]
[ROW][C]Midmean - Closest Observation[/C][C]122.659459459459[/C][C][/C][C][/C][/ROW]
[ROW][C]Midmean - True Basic - Statistics Graphics Toolkit[/C][C]122.969444444444[/C][C][/C][C][/C][/ROW]
[ROW][C]Midmean - MS Excel (old versions)[/C][C]123.336842105263[/C][C][/C][C][/C][/ROW]
[ROW][C]Number of observations[/C][C]72[/C][C][/C][C][/C][/ROW]
[/TABLE]
Source: https://freestatistics.org/blog/index.php?pk=10705&T=1

Globally Unique Identifier (entire table): ba.freestatistics.org/blog/index.php?pk=10705&T=1

As an alternative you can also use a QR Code:  

The GUIDs for individual cells are displayed in the table below:

Central Tendency - Ungrouped Data
MeasureValueS.E.Value/S.E.
Arithmetic Mean132.4291666666673.7201258863024335.5980336994168
Geometric Mean129.272300875257
Harmonic Mean126.583629411952
Quadratic Mean136.088489900261
Winsorized Mean ( 1 / 24 )132.1666666666673.5849461377601836.8671275907209
Winsorized Mean ( 2 / 24 )131.7805555555563.432501174785238.3919913920502
Winsorized Mean ( 3 / 24 )131.2972222222223.2373571183884740.5569164663492
Winsorized Mean ( 4 / 24 )131.3753.1627791494754841.5378354893315
Winsorized Mean ( 5 / 24 )131.3472222222223.0793483779517942.6542261871608
Winsorized Mean ( 6 / 24 )131.2555555555563.0469769317937043.0773053074240
Winsorized Mean ( 7 / 24 )131.0027777777782.9632325512300144.2094150603873
Winsorized Mean ( 8 / 24 )129.5252.6133001803372849.563766525774
Winsorized Mean ( 9 / 24 )129.43752.5580815183222550.5994430094993
Winsorized Mean ( 10 / 24 )129.3680555555562.5347173344433851.0384545833253
Winsorized Mean ( 11 / 24 )129.3986111111112.4583458605995452.6364549370418
Winsorized Mean ( 12 / 24 )129.0986111111112.3821671307596254.1937672819558
Winsorized Mean ( 13 / 24 )128.2680555555562.2089772968326558.0667151896368
Winsorized Mean ( 14 / 24 )127.1986111111112.0061724909881663.4036263992725
Winsorized Mean ( 15 / 24 )126.9694444444441.9536607815808464.9905273430862
Winsorized Mean ( 16 / 24 )126.4361111111111.8555823503636468.1382376192215
Winsorized Mean ( 17 / 24 )126.4597222222221.8326990577175969.0019027890553
Winsorized Mean ( 18 / 24 )126.5097222222221.7987684446687670.3312995050447
Winsorized Mean ( 19 / 24 )126.4305555555561.7632836318164971.7017689464456
Winsorized Mean ( 20 / 24 )125.5972222222221.6178374979841177.6327797932246
Winsorized Mean ( 21 / 24 )124.7513888888891.4579982754673885.5634680698767
Winsorized Mean ( 22 / 24 )123.98751.3140788997816494.3531625236527
Winsorized Mean ( 23 / 24 )123.71.22731050668207100.789489967304
Winsorized Mean ( 24 / 24 )123.3333333333331.17206664447562105.227235938032
Trimmed Mean ( 1 / 24 )131.4042857142863.4020000424268138.6255979057981
Trimmed Mean ( 2 / 24 )130.5970588235293.1780724873425241.0931655409577
Trimmed Mean ( 3 / 24 )129.9515151515153.0085931648886443.1934489076476
Trimmed Mean ( 4 / 24 )129.4468752.8977635471426644.6713035394627
Trimmed Mean ( 5 / 24 )128.8870967741942.7905298828977246.1873200369944
Trimmed Mean ( 6 / 24 )128.2966666666672.6859079482721247.7665910885746
Trimmed Mean ( 7 / 24 )127.6844827586212.5653831240272449.7720911791827
Trimmed Mean ( 8 / 24 )127.0752.4388032646436252.1054739602251
Trimmed Mean ( 9 / 24 )126.6666666666672.3778341065841153.2697660934094
Trimmed Mean ( 10 / 24 )126.2403846153852.3133396679740354.570622015894
Trimmed Mean ( 11 / 24 )125.792.235756275278956.262841075693
Trimmed Mean ( 12 / 24 )125.2979166666672.1526918856311558.2052255146262
Trimmed Mean ( 13 / 24 )124.8021739130432.0630508086184960.4939894798891
Trimmed Mean ( 14 / 24 )124.3659090909091.9902376518930862.4879691993639
Trimmed Mean ( 15 / 24 )124.0190476190481.9448978431151063.7663556767636
Trimmed Mean ( 16 / 24 )123.6651.8947246264975865.2680596803114
Trimmed Mean ( 17 / 24 )123.3368421052631.8499256878413566.6712413995304
Trimmed Mean ( 18 / 24 )122.9694444444441.7902993429070568.6865271618597
Trimmed Mean ( 19 / 24 )122.5529411764711.7118504612487871.5909151825498
Trimmed Mean ( 20 / 24 )122.093751.6066704294756975.9917826083616
Trimmed Mean ( 21 / 24 )121.6733333333331.5048880764380380.852081452679
Trimmed Mean ( 22 / 24 )121.2964285714291.4133573124543585.8214886657308
Trimmed Mean ( 23 / 24 )120.9576923076921.3306351644340490.9022213907442
Trimmed Mean ( 24 / 24 )120.61.2332354054345897.7915485304298
Median118.65
Midrange168.3
Midmean - Weighted Average at Xnp122.659459459459
Midmean - Weighted Average at X(n+1)p122.969444444444
Midmean - Empirical Distribution Function122.659459459459
Midmean - Empirical Distribution Function - Averaging122.969444444444
Midmean - Empirical Distribution Function - Interpolation122.969444444444
Midmean - Closest Observation122.659459459459
Midmean - True Basic - Statistics Graphics Toolkit122.969444444444
Midmean - MS Excel (old versions)123.336842105263
Number of observations72


Parameters (Session):
Parameters (R input):
R code (references can be found in the software module):
geomean <- function(x) {
return(exp(mean(log(x))))
}
harmean <- function(x) {
return(1/mean(1/x))
}
quamean <- function(x) {
return(sqrt(mean(x*x)))
}
winmean <- function(x) {
x <-sort(x[!is.na(x)])
n<-length(x)
denom <- 3
nodenom <- n/denom
if (nodenom>40) denom <- n/40
sqrtn = sqrt(n)
roundnodenom = floor(nodenom)
win <- array(NA,dim=c(roundnodenom,2))
for (j in 1:roundnodenom) {
win[j,1] <- (j*x[j+1]+sum(x[(j+1):(n-j)])+j*x[n-j])/n
win[j,2] <- sd(c(rep(x[j+1],j),x[(j+1):(n-j)],rep(x[n-j],j)))/sqrtn
}
return(win)
}
trimean <- function(x) {
x <-sort(x[!is.na(x)])
n<-length(x)
denom <- 3
nodenom <- n/denom
if (nodenom>40) denom <- n/40
sqrtn = sqrt(n)
roundnodenom = floor(nodenom)
tri <- array(NA,dim=c(roundnodenom,2))
for (j in 1:roundnodenom) {
tri[j,1] <- mean(x,trim=j/n)
tri[j,2] <- sd(x[(j+1):(n-j)]) / sqrt(n-j*2)
}
return(tri)
}
midrange <- function(x) {
return((max(x)+min(x))/2)
}
q1 <- function(data,n,p,i,f) {
np <- n*p;
i <<- floor(np)
f <<- np - i
qvalue <- (1-f)*data[i] + f*data[i+1]
}
q2 <- function(data,n,p,i,f) {
np <- (n+1)*p
i <<- floor(np)
f <<- np - i
qvalue <- (1-f)*data[i] + f*data[i+1]
}
q3 <- function(data,n,p,i,f) {
np <- n*p
i <<- floor(np)
f <<- np - i
if (f==0) {
qvalue <- data[i]
} else {
qvalue <- data[i+1]
}
}
q4 <- function(data,n,p,i,f) {
np <- n*p
i <<- floor(np)
f <<- np - i
if (f==0) {
qvalue <- (data[i]+data[i+1])/2
} else {
qvalue <- data[i+1]
}
}
q5 <- function(data,n,p,i,f) {
np <- (n-1)*p
i <<- floor(np)
f <<- np - i
if (f==0) {
qvalue <- data[i+1]
} else {
qvalue <- data[i+1] + f*(data[i+2]-data[i+1])
}
}
q6 <- function(data,n,p,i,f) {
np <- n*p+0.5
i <<- floor(np)
f <<- np - i
qvalue <- data[i]
}
q7 <- function(data,n,p,i,f) {
np <- (n+1)*p
i <<- floor(np)
f <<- np - i
if (f==0) {
qvalue <- data[i]
} else {
qvalue <- f*data[i] + (1-f)*data[i+1]
}
}
q8 <- function(data,n,p,i,f) {
np <- (n+1)*p
i <<- floor(np)
f <<- np - i
if (f==0) {
qvalue <- data[i]
} else {
if (f == 0.5) {
qvalue <- (data[i]+data[i+1])/2
} else {
if (f < 0.5) {
qvalue <- data[i]
} else {
qvalue <- data[i+1]
}
}
}
}
midmean <- function(x,def) {
x <-sort(x[!is.na(x)])
n<-length(x)
if (def==1) {
qvalue1 <- q1(x,n,0.25,i,f)
qvalue3 <- q1(x,n,0.75,i,f)
}
if (def==2) {
qvalue1 <- q2(x,n,0.25,i,f)
qvalue3 <- q2(x,n,0.75,i,f)
}
if (def==3) {
qvalue1 <- q3(x,n,0.25,i,f)
qvalue3 <- q3(x,n,0.75,i,f)
}
if (def==4) {
qvalue1 <- q4(x,n,0.25,i,f)
qvalue3 <- q4(x,n,0.75,i,f)
}
if (def==5) {
qvalue1 <- q5(x,n,0.25,i,f)
qvalue3 <- q5(x,n,0.75,i,f)
}
if (def==6) {
qvalue1 <- q6(x,n,0.25,i,f)
qvalue3 <- q6(x,n,0.75,i,f)
}
if (def==7) {
qvalue1 <- q7(x,n,0.25,i,f)
qvalue3 <- q7(x,n,0.75,i,f)
}
if (def==8) {
qvalue1 <- q8(x,n,0.25,i,f)
qvalue3 <- q8(x,n,0.75,i,f)
}
midm <- 0
myn <- 0
roundno4 <- round(n/4)
round3no4 <- round(3*n/4)
for (i in 1:n) {
if ((x[i]>=qvalue1) & (x[i]<=qvalue3)){
midm = midm + x[i]
myn = myn + 1
}
}
midm = midm / myn
return(midm)
}
(arm <- mean(x))
sqrtn <- sqrt(length(x))
(armse <- sd(x) / sqrtn)
(armose <- arm / armse)
(geo <- geomean(x))
(har <- harmean(x))
(qua <- quamean(x))
(win <- winmean(x))
(tri <- trimean(x))
(midr <- midrange(x))
midm <- array(NA,dim=8)
for (j in 1:8) midm[j] <- midmean(x,j)
midm
bitmap(file='test1.png')
lb <- win[,1] - 2*win[,2]
ub <- win[,1] + 2*win[,2]
if ((ylimmin == '') | (ylimmax == '')) plot(win[,1],type='b',main=main, xlab='j', pch=19, ylab='Winsorized Mean(j/n)', ylim=c(min(lb),max(ub))) else plot(win[,1],type='l',main=main, xlab='j', pch=19, ylab='Winsorized Mean(j/n)', ylim=c(ylimmin,ylimmax))
lines(ub,lty=3)
lines(lb,lty=3)
grid()
dev.off()
bitmap(file='test2.png')
lb <- tri[,1] - 2*tri[,2]
ub <- tri[,1] + 2*tri[,2]
if ((ylimmin == '') | (ylimmax == '')) plot(tri[,1],type='b',main=main, xlab='j', pch=19, ylab='Trimmed Mean(j/n)', ylim=c(min(lb),max(ub))) else plot(tri[,1],type='l',main=main, xlab='j', pch=19, ylab='Trimmed Mean(j/n)', ylim=c(ylimmin,ylimmax))
lines(ub,lty=3)
lines(lb,lty=3)
grid()
dev.off()
load(file='createtable')
a<-table.start()
a<-table.row.start(a)
a<-table.element(a,'Central Tendency - Ungrouped Data',4,TRUE)
a<-table.row.end(a)
a<-table.row.start(a)
a<-table.element(a,'Measure',header=TRUE)
a<-table.element(a,'Value',header=TRUE)
a<-table.element(a,'S.E.',header=TRUE)
a<-table.element(a,'Value/S.E.',header=TRUE)
a<-table.row.end(a)
a<-table.row.start(a)
a<-table.element(a,hyperlink('arithmetic_mean.htm', 'Arithmetic Mean', 'click to view the definition of the Arithmetic Mean'),header=TRUE)
a<-table.element(a,arm)
a<-table.element(a,hyperlink('arithmetic_mean_standard_error.htm', armse, 'click to view the definition of the Standard Error of the Arithmetic Mean'))
a<-table.element(a,armose)
a<-table.row.end(a)
a<-table.row.start(a)
a<-table.element(a,hyperlink('geometric_mean.htm', 'Geometric Mean', 'click to view the definition of the Geometric Mean'),header=TRUE)
a<-table.element(a,geo)
a<-table.element(a,'')
a<-table.row.end(a)
a<-table.row.start(a)
a<-table.element(a,hyperlink('harmonic_mean.htm', 'Harmonic Mean', 'click to view the definition of the Harmonic Mean'),header=TRUE)
a<-table.element(a,har)
a<-table.element(a,'')
a<-table.row.end(a)
a<-table.row.start(a)
a<-table.element(a,hyperlink('quadratic_mean.htm', 'Quadratic Mean', 'click to view the definition of the Quadratic Mean'),header=TRUE)
a<-table.element(a,qua)
a<-table.element(a,'')
a<-table.row.end(a)
for (j in 1:length(win[,1])) {
a<-table.row.start(a)
mylabel <- paste('Winsorized Mean (',j)
mylabel <- paste(mylabel,'/')
mylabel <- paste(mylabel,length(win[,1]))
mylabel <- paste(mylabel,')')
a<-table.element(a,hyperlink('winsorized_mean.htm', mylabel, 'click to view the definition of the Winsorized Mean'),header=TRUE)
a<-table.element(a,win[j,1])
a<-table.element(a,win[j,2])
a<-table.element(a,win[j,1]/win[j,2])
a<-table.row.end(a)
}
for (j in 1:length(tri[,1])) {
a<-table.row.start(a)
mylabel <- paste('Trimmed Mean (',j)
mylabel <- paste(mylabel,'/')
mylabel <- paste(mylabel,length(tri[,1]))
mylabel <- paste(mylabel,')')
a<-table.element(a,hyperlink('arithmetic_mean.htm', mylabel, 'click to view the definition of the Trimmed Mean'),header=TRUE)
a<-table.element(a,tri[j,1])
a<-table.element(a,tri[j,2])
a<-table.element(a,tri[j,1]/tri[j,2])
a<-table.row.end(a)
}
a<-table.row.start(a)
a<-table.element(a,hyperlink('median_1.htm', 'Median', 'click to view the definition of the Median'),header=TRUE)
a<-table.element(a,median(x))
a<-table.element(a,'')
a<-table.row.end(a)
a<-table.row.start(a)
a<-table.element(a,hyperlink('midrange.htm', 'Midrange', 'click to view the definition of the Midrange'),header=TRUE)
a<-table.element(a,midr)
a<-table.element(a,'')
a<-table.row.end(a)
a<-table.row.start(a)
mymid <- hyperlink('midmean.htm', 'Midmean', 'click to view the definition of the Midmean')
mylabel <- paste(mymid,hyperlink('method_1.htm','Weighted Average at Xnp',''),sep=' - ')
a<-table.element(a,mylabel,header=TRUE)
a<-table.element(a,midm[1])
a<-table.element(a,'')
a<-table.row.end(a)
a<-table.row.start(a)
mymid <- hyperlink('midmean.htm', 'Midmean', 'click to view the definition of the Midmean')
mylabel <- paste(mymid,hyperlink('method_2.htm','Weighted Average at X(n+1)p',''),sep=' - ')
a<-table.element(a,mylabel,header=TRUE)
a<-table.element(a,midm[2])
a<-table.element(a,'')
a<-table.row.end(a)
a<-table.row.start(a)
mymid <- hyperlink('midmean.htm', 'Midmean', 'click to view the definition of the Midmean')
mylabel <- paste(mymid,hyperlink('method_3.htm','Empirical Distribution Function',''),sep=' - ')
a<-table.element(a,mylabel,header=TRUE)
a<-table.element(a,midm[3])
a<-table.element(a,'')
a<-table.row.end(a)
a<-table.row.start(a)
mymid <- hyperlink('midmean.htm', 'Midmean', 'click to view the definition of the Midmean')
mylabel <- paste(mymid,hyperlink('method_4.htm','Empirical Distribution Function - Averaging',''),sep=' - ')
a<-table.element(a,mylabel,header=TRUE)
a<-table.element(a,midm[4])
a<-table.element(a,'')
a<-table.row.end(a)
a<-table.row.start(a)
mymid <- hyperlink('midmean.htm', 'Midmean', 'click to view the definition of the Midmean')
mylabel <- paste(mymid,hyperlink('method_5.htm','Empirical Distribution Function - Interpolation',''),sep=' - ')
a<-table.element(a,mylabel,header=TRUE)
a<-table.element(a,midm[5])
a<-table.element(a,'')
a<-table.row.end(a)
a<-table.row.start(a)
mymid <- hyperlink('midmean.htm', 'Midmean', 'click to view the definition of the Midmean')
mylabel <- paste(mymid,hyperlink('method_6.htm','Closest Observation',''),sep=' - ')
a<-table.element(a,mylabel,header=TRUE)
a<-table.element(a,midm[6])
a<-table.element(a,'')
a<-table.row.end(a)
a<-table.row.start(a)
mymid <- hyperlink('midmean.htm', 'Midmean', 'click to view the definition of the Midmean')
mylabel <- paste(mymid,hyperlink('method_7.htm','True Basic - Statistics Graphics Toolkit',''),sep=' - ')
a<-table.element(a,mylabel,header=TRUE)
a<-table.element(a,midm[7])
a<-table.element(a,'')
a<-table.row.end(a)
a<-table.row.start(a)
mymid <- hyperlink('midmean.htm', 'Midmean', 'click to view the definition of the Midmean')
mylabel <- paste(mymid,hyperlink('method_8.htm','MS Excel (old versions)',''),sep=' - ')
a<-table.element(a,mylabel,header=TRUE)
a<-table.element(a,midm[8])
a<-table.element(a,'')
a<-table.row.end(a)
a<-table.row.start(a)
a<-table.element(a,'Number of observations',header=TRUE)
a<-table.element(a,length(x))
a<-table.element(a,'')
a<-table.row.end(a)
a<-table.end(a)
table.save(a,file='mytable.tab')