Free Statistics

of Irreproducible Research!

Author's title

Author*The author of this computation has been verified*
R Software Modulerwasp_autocorrelation.wasp
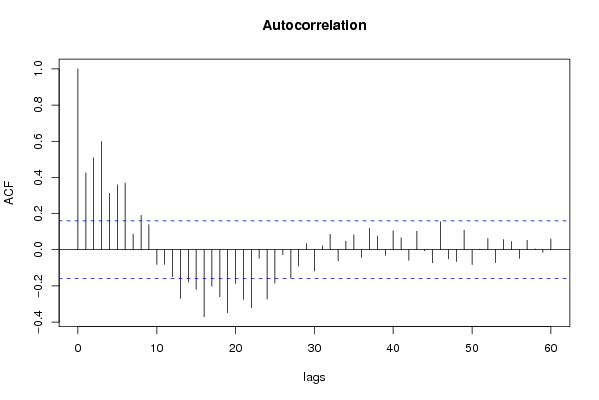
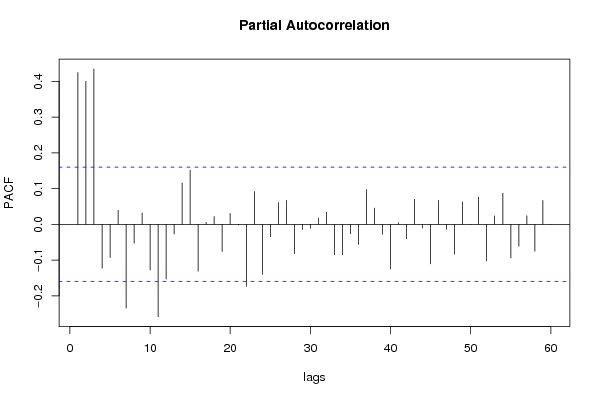
Title produced by software(Partial) Autocorrelation Function
Date of computationSun, 07 Dec 2008 07:59:34 -0700
Cite this page as followsStatistical Computations at FreeStatistics.org, Office for Research Development and Education, URL https://freestatistics.org/blog/index.php?v=date/2008/Dec/07/t122866203862wtpqs6ehoirlo.htm/, Retrieved Sat, 18 May 2024 21:19:33 +0000
Statistical Computations at FreeStatistics.org, Office for Research Development and Education, URL https://freestatistics.org/blog/index.php?pk=30042, Retrieved Sat, 18 May 2024 21:19:33 +0000
QR Codes:

Original text written by user:
IsPrivate?No (this computation is public)
User-defined keywords
Estimated Impact94
Family? (F = Feedback message, R = changed R code, M = changed R Module, P = changed Parameters, D = changed Data)
-     [Univariate Data Series] [data set] [2008-12-01 19:54:57] [b98453cac15ba1066b407e146608df68]
F RMPD    [(Partial) Autocorrelation Function] [Q2:ACF eigen tijd...] [2008-12-07 14:59:34] [8758b22b4a10c08c31202f233362e983] [Current]
- RMPD      [ARIMA Backward Selection] [Q5: Backword] [2008-12-07 16:06:21] [1ce0d16c8f4225c977b42c8fa93bc163]
F RMP       [ARIMA Backward Selection] [ARIMA Backward Se...] [2008-12-08 17:43:42] [1ce0d16c8f4225c977b42c8fa93bc163]
-   P         [ARIMA Backward Selection] [ARIMA Backward] [2008-12-14 13:35:58] [1ce0d16c8f4225c977b42c8fa93bc163]
Feedback Forum
2008-12-14 13:33:04 [Matthieu Blondeau] [reply
Men moet eerst de berekening uitvoeren met d=0 en D=0 en daarna pas differentiëren zodat men het verschil tussen de berekeningen duidelijk kan zien. Dit heb ik niet gedaan.
2008-12-14 20:39:44 [Michaël De Kuyer] [reply
Het bepalen van P had je wat kunnen nuanceren. Het is zo dat lag 12 in de ACF niet significant verschillend is. De andere variabelen zijn naar mijn mening wel correct bepaald.
2008-12-15 22:46:54 [Niels Herremans] [reply
De coefficient bij lag 12 is inderdaad niet significant verschillend van 0.

Post a new message
Dataseries X:
9568.3
9920.3
11353.5
9247.5
10114.2
10763.1
8456.1
8071.6
10328
10551.4
10186.1
8821.6
9841.3
10233.6
10794.6
10289.3
10513.4
10607.6
9707.4
8103.5
10982.6
11836.9
10517.5
9810.5
10374.8
10855.3
11671.3
11901.2
10846.4
11917.5
11362.8
9314.5
12605.9
12815.1
11254.5
11111.8
11282.9
11554.5
12935.6
12146.3
11615.3
13214.8
11735.5
9522.3
12694.8
12317.6
11450
11380.9
10604.6
10972.2
13331.5
11733.1
11284.7
13295.8
11881.4
10374.2
13828
13490.5
13092.2
13184.4
12398.4
13882.3
15861.5
13286.1
15634.9
14211
13646.8
12224.6
15916.4
16535.9
15796
14418.6
15044.5
14944.2
16754.8
14254
15454.9
15644.8
14568.3
12520.2
14803
15873.2
14755.3
12875.1
14291.1
14205.3
15859.4
15258.9
15498.6
15106.5
15023.6
12083
15761.3
16943
15070.3
13659.6
14768.9
14725.1
15998.1
15370.6
14956.9
15469.7
15101.8
11703.7
16283.6
16726.5
14968.9
14861
14583.3
15305.8
17903.9
16379.4
15420.3
17870.5
15912.8
13866.5
17823.2
17872
17420.4
16704.4
15991.2
16583.6
19123.5
17838.7
17209.4
18586.5
16258.1
15141.6
19202.1
17746.5
19090.1
18040.3
17515.5
17751.8
21072.4
17170
19439.5
19795.4
17574.9
16165.4
19464.6
19932.1
19961.2
17343.4
18924.2
18574.1
21350.6
18594.6
19823.1
20844.4
19640.2
17735.4
19813.6
22238.5
20682.2
17818.6
21872.1
22117
21865.9
23451.3
20953.7
22497.3


Summary of computational transaction
Raw Inputview raw input (R code)
Raw Outputview raw output of R engine
Computing time1 seconds
R Server'Gwilym Jenkins' @ 72.249.127.135

\begin{tabular}{lllllllll}
\hline
Summary of computational transaction \tabularnewline
Raw Input & view raw input (R code)  \tabularnewline
Raw Output & view raw output of R engine  \tabularnewline
Computing time & 1 seconds \tabularnewline
R Server & 'Gwilym Jenkins' @ 72.249.127.135 \tabularnewline
\hline
\end{tabular}
%Source: https://freestatistics.org/blog/index.php?pk=30042&T=0

[TABLE]
[ROW][C]Summary of computational transaction[/C][/ROW]
[ROW][C]Raw Input[/C][C]view raw input (R code) [/C][/ROW]
[ROW][C]Raw Output[/C][C]view raw output of R engine [/C][/ROW]
[ROW][C]Computing time[/C][C]1 seconds[/C][/ROW]
[ROW][C]R Server[/C][C]'Gwilym Jenkins' @ 72.249.127.135[/C][/ROW]
[/TABLE]
Source: https://freestatistics.org/blog/index.php?pk=30042&T=0

Globally Unique Identifier (entire table): ba.freestatistics.org/blog/index.php?pk=30042&T=0

As an alternative you can also use a QR Code:  

The GUIDs for individual cells are displayed in the table below:

Summary of computational transaction
Raw Inputview raw input (R code)
Raw Outputview raw output of R engine
Computing time1 seconds
R Server'Gwilym Jenkins' @ 72.249.127.135


Autocorrelation Function
Time lag kACF(k)T-STATP-value
10.4247755.20240
20.5084626.22740
30.5989177.33520
40.3117153.81779.8e-05
50.3592914.40041e-05
60.3685014.51326e-06
70.0866731.06150.145078
80.1895082.3210.010817
90.1384381.69550.046026
10-0.081261-0.99520.160611
11-0.081683-1.00040.159362
12-0.149495-1.83090.034547
13-0.268653-3.29030.000624
14-0.178305-2.18380.015266
15-0.219198-2.68460.004039
16-0.370292-4.53516e-06
17-0.20149-2.46770.00736
18-0.260267-3.18760.000873
19-0.348911-4.27331.7e-05
20-0.18737-2.29480.011566
21-0.274775-3.36530.000486
22-0.321663-3.93966.2e-05
23-0.047436-0.5810.281068
24-0.272462-3.3370.000534
25-0.185376-2.27040.012304
26-0.027944-0.34220.366324
27-0.155696-1.90690.029224
28-0.090411-1.10730.134967
290.0338480.41450.339533
30-0.118388-1.450.07458
310.0216530.26520.395614
320.0854341.04630.148542
33-0.061895-0.75810.224804
340.0473330.57970.28149
350.0823611.00870.157367
36-0.042357-0.51880.302343
370.1186681.45340.074103
380.0754140.92360.178581
39-0.031348-0.38390.350787
400.1046251.28140.101018
410.0668560.81880.207094
42-0.058531-0.71690.237288
430.1026421.25710.105335
44-0.00637-0.0780.46896
45-0.072721-0.89070.187271
460.1543021.88980.030357
47-0.050302-0.61610.269392
48-0.065577-0.80310.21158
490.1078691.32110.094237
50-0.081952-1.00370.158568
510.002760.03380.486538
520.0627460.76850.221705
53-0.071246-0.87260.192143
540.0565320.69240.244887
550.0454170.55620.289436
56-0.047712-0.58430.279932
570.0518510.6350.263183
580.0045740.0560.477702
59-0.015284-0.18720.425882
600.0594980.72870.233661

\begin{tabular}{lllllllll}
\hline
Autocorrelation Function \tabularnewline
Time lag k & ACF(k) & T-STAT & P-value \tabularnewline
1 & 0.424775 & 5.2024 & 0 \tabularnewline
2 & 0.508462 & 6.2274 & 0 \tabularnewline
3 & 0.598917 & 7.3352 & 0 \tabularnewline
4 & 0.311715 & 3.8177 & 9.8e-05 \tabularnewline
5 & 0.359291 & 4.4004 & 1e-05 \tabularnewline
6 & 0.368501 & 4.5132 & 6e-06 \tabularnewline
7 & 0.086673 & 1.0615 & 0.145078 \tabularnewline
8 & 0.189508 & 2.321 & 0.010817 \tabularnewline
9 & 0.138438 & 1.6955 & 0.046026 \tabularnewline
10 & -0.081261 & -0.9952 & 0.160611 \tabularnewline
11 & -0.081683 & -1.0004 & 0.159362 \tabularnewline
12 & -0.149495 & -1.8309 & 0.034547 \tabularnewline
13 & -0.268653 & -3.2903 & 0.000624 \tabularnewline
14 & -0.178305 & -2.1838 & 0.015266 \tabularnewline
15 & -0.219198 & -2.6846 & 0.004039 \tabularnewline
16 & -0.370292 & -4.5351 & 6e-06 \tabularnewline
17 & -0.20149 & -2.4677 & 0.00736 \tabularnewline
18 & -0.260267 & -3.1876 & 0.000873 \tabularnewline
19 & -0.348911 & -4.2733 & 1.7e-05 \tabularnewline
20 & -0.18737 & -2.2948 & 0.011566 \tabularnewline
21 & -0.274775 & -3.3653 & 0.000486 \tabularnewline
22 & -0.321663 & -3.9396 & 6.2e-05 \tabularnewline
23 & -0.047436 & -0.581 & 0.281068 \tabularnewline
24 & -0.272462 & -3.337 & 0.000534 \tabularnewline
25 & -0.185376 & -2.2704 & 0.012304 \tabularnewline
26 & -0.027944 & -0.3422 & 0.366324 \tabularnewline
27 & -0.155696 & -1.9069 & 0.029224 \tabularnewline
28 & -0.090411 & -1.1073 & 0.134967 \tabularnewline
29 & 0.033848 & 0.4145 & 0.339533 \tabularnewline
30 & -0.118388 & -1.45 & 0.07458 \tabularnewline
31 & 0.021653 & 0.2652 & 0.395614 \tabularnewline
32 & 0.085434 & 1.0463 & 0.148542 \tabularnewline
33 & -0.061895 & -0.7581 & 0.224804 \tabularnewline
34 & 0.047333 & 0.5797 & 0.28149 \tabularnewline
35 & 0.082361 & 1.0087 & 0.157367 \tabularnewline
36 & -0.042357 & -0.5188 & 0.302343 \tabularnewline
37 & 0.118668 & 1.4534 & 0.074103 \tabularnewline
38 & 0.075414 & 0.9236 & 0.178581 \tabularnewline
39 & -0.031348 & -0.3839 & 0.350787 \tabularnewline
40 & 0.104625 & 1.2814 & 0.101018 \tabularnewline
41 & 0.066856 & 0.8188 & 0.207094 \tabularnewline
42 & -0.058531 & -0.7169 & 0.237288 \tabularnewline
43 & 0.102642 & 1.2571 & 0.105335 \tabularnewline
44 & -0.00637 & -0.078 & 0.46896 \tabularnewline
45 & -0.072721 & -0.8907 & 0.187271 \tabularnewline
46 & 0.154302 & 1.8898 & 0.030357 \tabularnewline
47 & -0.050302 & -0.6161 & 0.269392 \tabularnewline
48 & -0.065577 & -0.8031 & 0.21158 \tabularnewline
49 & 0.107869 & 1.3211 & 0.094237 \tabularnewline
50 & -0.081952 & -1.0037 & 0.158568 \tabularnewline
51 & 0.00276 & 0.0338 & 0.486538 \tabularnewline
52 & 0.062746 & 0.7685 & 0.221705 \tabularnewline
53 & -0.071246 & -0.8726 & 0.192143 \tabularnewline
54 & 0.056532 & 0.6924 & 0.244887 \tabularnewline
55 & 0.045417 & 0.5562 & 0.289436 \tabularnewline
56 & -0.047712 & -0.5843 & 0.279932 \tabularnewline
57 & 0.051851 & 0.635 & 0.263183 \tabularnewline
58 & 0.004574 & 0.056 & 0.477702 \tabularnewline
59 & -0.015284 & -0.1872 & 0.425882 \tabularnewline
60 & 0.059498 & 0.7287 & 0.233661 \tabularnewline
\hline
\end{tabular}
%Source: https://freestatistics.org/blog/index.php?pk=30042&T=1

[TABLE]
[ROW][C]Autocorrelation Function[/C][/ROW]
[ROW][C]Time lag k[/C][C]ACF(k)[/C][C]T-STAT[/C][C]P-value[/C][/ROW]
[ROW][C]1[/C][C]0.424775[/C][C]5.2024[/C][C]0[/C][/ROW]
[ROW][C]2[/C][C]0.508462[/C][C]6.2274[/C][C]0[/C][/ROW]
[ROW][C]3[/C][C]0.598917[/C][C]7.3352[/C][C]0[/C][/ROW]
[ROW][C]4[/C][C]0.311715[/C][C]3.8177[/C][C]9.8e-05[/C][/ROW]
[ROW][C]5[/C][C]0.359291[/C][C]4.4004[/C][C]1e-05[/C][/ROW]
[ROW][C]6[/C][C]0.368501[/C][C]4.5132[/C][C]6e-06[/C][/ROW]
[ROW][C]7[/C][C]0.086673[/C][C]1.0615[/C][C]0.145078[/C][/ROW]
[ROW][C]8[/C][C]0.189508[/C][C]2.321[/C][C]0.010817[/C][/ROW]
[ROW][C]9[/C][C]0.138438[/C][C]1.6955[/C][C]0.046026[/C][/ROW]
[ROW][C]10[/C][C]-0.081261[/C][C]-0.9952[/C][C]0.160611[/C][/ROW]
[ROW][C]11[/C][C]-0.081683[/C][C]-1.0004[/C][C]0.159362[/C][/ROW]
[ROW][C]12[/C][C]-0.149495[/C][C]-1.8309[/C][C]0.034547[/C][/ROW]
[ROW][C]13[/C][C]-0.268653[/C][C]-3.2903[/C][C]0.000624[/C][/ROW]
[ROW][C]14[/C][C]-0.178305[/C][C]-2.1838[/C][C]0.015266[/C][/ROW]
[ROW][C]15[/C][C]-0.219198[/C][C]-2.6846[/C][C]0.004039[/C][/ROW]
[ROW][C]16[/C][C]-0.370292[/C][C]-4.5351[/C][C]6e-06[/C][/ROW]
[ROW][C]17[/C][C]-0.20149[/C][C]-2.4677[/C][C]0.00736[/C][/ROW]
[ROW][C]18[/C][C]-0.260267[/C][C]-3.1876[/C][C]0.000873[/C][/ROW]
[ROW][C]19[/C][C]-0.348911[/C][C]-4.2733[/C][C]1.7e-05[/C][/ROW]
[ROW][C]20[/C][C]-0.18737[/C][C]-2.2948[/C][C]0.011566[/C][/ROW]
[ROW][C]21[/C][C]-0.274775[/C][C]-3.3653[/C][C]0.000486[/C][/ROW]
[ROW][C]22[/C][C]-0.321663[/C][C]-3.9396[/C][C]6.2e-05[/C][/ROW]
[ROW][C]23[/C][C]-0.047436[/C][C]-0.581[/C][C]0.281068[/C][/ROW]
[ROW][C]24[/C][C]-0.272462[/C][C]-3.337[/C][C]0.000534[/C][/ROW]
[ROW][C]25[/C][C]-0.185376[/C][C]-2.2704[/C][C]0.012304[/C][/ROW]
[ROW][C]26[/C][C]-0.027944[/C][C]-0.3422[/C][C]0.366324[/C][/ROW]
[ROW][C]27[/C][C]-0.155696[/C][C]-1.9069[/C][C]0.029224[/C][/ROW]
[ROW][C]28[/C][C]-0.090411[/C][C]-1.1073[/C][C]0.134967[/C][/ROW]
[ROW][C]29[/C][C]0.033848[/C][C]0.4145[/C][C]0.339533[/C][/ROW]
[ROW][C]30[/C][C]-0.118388[/C][C]-1.45[/C][C]0.07458[/C][/ROW]
[ROW][C]31[/C][C]0.021653[/C][C]0.2652[/C][C]0.395614[/C][/ROW]
[ROW][C]32[/C][C]0.085434[/C][C]1.0463[/C][C]0.148542[/C][/ROW]
[ROW][C]33[/C][C]-0.061895[/C][C]-0.7581[/C][C]0.224804[/C][/ROW]
[ROW][C]34[/C][C]0.047333[/C][C]0.5797[/C][C]0.28149[/C][/ROW]
[ROW][C]35[/C][C]0.082361[/C][C]1.0087[/C][C]0.157367[/C][/ROW]
[ROW][C]36[/C][C]-0.042357[/C][C]-0.5188[/C][C]0.302343[/C][/ROW]
[ROW][C]37[/C][C]0.118668[/C][C]1.4534[/C][C]0.074103[/C][/ROW]
[ROW][C]38[/C][C]0.075414[/C][C]0.9236[/C][C]0.178581[/C][/ROW]
[ROW][C]39[/C][C]-0.031348[/C][C]-0.3839[/C][C]0.350787[/C][/ROW]
[ROW][C]40[/C][C]0.104625[/C][C]1.2814[/C][C]0.101018[/C][/ROW]
[ROW][C]41[/C][C]0.066856[/C][C]0.8188[/C][C]0.207094[/C][/ROW]
[ROW][C]42[/C][C]-0.058531[/C][C]-0.7169[/C][C]0.237288[/C][/ROW]
[ROW][C]43[/C][C]0.102642[/C][C]1.2571[/C][C]0.105335[/C][/ROW]
[ROW][C]44[/C][C]-0.00637[/C][C]-0.078[/C][C]0.46896[/C][/ROW]
[ROW][C]45[/C][C]-0.072721[/C][C]-0.8907[/C][C]0.187271[/C][/ROW]
[ROW][C]46[/C][C]0.154302[/C][C]1.8898[/C][C]0.030357[/C][/ROW]
[ROW][C]47[/C][C]-0.050302[/C][C]-0.6161[/C][C]0.269392[/C][/ROW]
[ROW][C]48[/C][C]-0.065577[/C][C]-0.8031[/C][C]0.21158[/C][/ROW]
[ROW][C]49[/C][C]0.107869[/C][C]1.3211[/C][C]0.094237[/C][/ROW]
[ROW][C]50[/C][C]-0.081952[/C][C]-1.0037[/C][C]0.158568[/C][/ROW]
[ROW][C]51[/C][C]0.00276[/C][C]0.0338[/C][C]0.486538[/C][/ROW]
[ROW][C]52[/C][C]0.062746[/C][C]0.7685[/C][C]0.221705[/C][/ROW]
[ROW][C]53[/C][C]-0.071246[/C][C]-0.8726[/C][C]0.192143[/C][/ROW]
[ROW][C]54[/C][C]0.056532[/C][C]0.6924[/C][C]0.244887[/C][/ROW]
[ROW][C]55[/C][C]0.045417[/C][C]0.5562[/C][C]0.289436[/C][/ROW]
[ROW][C]56[/C][C]-0.047712[/C][C]-0.5843[/C][C]0.279932[/C][/ROW]
[ROW][C]57[/C][C]0.051851[/C][C]0.635[/C][C]0.263183[/C][/ROW]
[ROW][C]58[/C][C]0.004574[/C][C]0.056[/C][C]0.477702[/C][/ROW]
[ROW][C]59[/C][C]-0.015284[/C][C]-0.1872[/C][C]0.425882[/C][/ROW]
[ROW][C]60[/C][C]0.059498[/C][C]0.7287[/C][C]0.233661[/C][/ROW]
[/TABLE]
Source: https://freestatistics.org/blog/index.php?pk=30042&T=1

Globally Unique Identifier (entire table): ba.freestatistics.org/blog/index.php?pk=30042&T=1

As an alternative you can also use a QR Code:  

The GUIDs for individual cells are displayed in the table below:

Autocorrelation Function
Time lag kACF(k)T-STATP-value
10.4247755.20240
20.5084626.22740
30.5989177.33520
40.3117153.81779.8e-05
50.3592914.40041e-05
60.3685014.51326e-06
70.0866731.06150.145078
80.1895082.3210.010817
90.1384381.69550.046026
10-0.081261-0.99520.160611
11-0.081683-1.00040.159362
12-0.149495-1.83090.034547
13-0.268653-3.29030.000624
14-0.178305-2.18380.015266
15-0.219198-2.68460.004039
16-0.370292-4.53516e-06
17-0.20149-2.46770.00736
18-0.260267-3.18760.000873
19-0.348911-4.27331.7e-05
20-0.18737-2.29480.011566
21-0.274775-3.36530.000486
22-0.321663-3.93966.2e-05
23-0.047436-0.5810.281068
24-0.272462-3.3370.000534
25-0.185376-2.27040.012304
26-0.027944-0.34220.366324
27-0.155696-1.90690.029224
28-0.090411-1.10730.134967
290.0338480.41450.339533
30-0.118388-1.450.07458
310.0216530.26520.395614
320.0854341.04630.148542
33-0.061895-0.75810.224804
340.0473330.57970.28149
350.0823611.00870.157367
36-0.042357-0.51880.302343
370.1186681.45340.074103
380.0754140.92360.178581
39-0.031348-0.38390.350787
400.1046251.28140.101018
410.0668560.81880.207094
42-0.058531-0.71690.237288
430.1026421.25710.105335
44-0.00637-0.0780.46896
45-0.072721-0.89070.187271
460.1543021.88980.030357
47-0.050302-0.61610.269392
48-0.065577-0.80310.21158
490.1078691.32110.094237
50-0.081952-1.00370.158568
510.002760.03380.486538
520.0627460.76850.221705
53-0.071246-0.87260.192143
540.0565320.69240.244887
550.0454170.55620.289436
56-0.047712-0.58430.279932
570.0518510.6350.263183
580.0045740.0560.477702
59-0.015284-0.18720.425882
600.0594980.72870.233661


Partial Autocorrelation Function
Time lag kPACF(k)T-STATP-value
10.4247755.20240
20.4002474.9021e-06
30.4349535.32710
4-0.122792-1.50390.067356
5-0.093104-1.14030.127993
60.0390990.47890.316365
7-0.234447-2.87140.002339
8-0.052891-0.64780.25906
90.0318160.38970.348668
10-0.127663-1.56350.060016
11-0.258443-3.16530.000938
12-0.1532-1.87630.031278
13-0.027175-0.33280.369865
140.1159811.42050.078773
150.1514151.85450.032819
16-0.131312-1.60820.054943
170.0058150.07120.471659
180.0216220.26480.395756
19-0.076136-0.93250.176297
200.030460.37310.354817
21-0.001558-0.01910.492402
22-0.173657-2.12690.017534
230.0918331.12470.131252
24-0.140374-1.71920.043818
25-0.034562-0.42330.336342
260.0610230.74740.228005
270.0670540.82120.206405
28-0.082328-1.00830.157465
29-0.014742-0.18050.428483
30-0.010862-0.1330.447171
310.0172640.21140.416416
320.0339910.41630.33889
33-0.084894-1.03970.150068
34-0.085375-1.04560.148707
35-0.026545-0.32510.372774
36-0.056007-0.68590.246902
370.0974971.19410.117163
380.0453630.55560.289662
39-0.02788-0.34150.366616
40-0.12497-1.53060.063992
410.0044870.0550.478122
42-0.040213-0.49250.31154
430.0700710.85820.196076
44-0.010344-0.12670.449678
45-0.110675-1.35550.088651
460.0670420.82110.206447
47-0.013715-0.1680.433417
48-0.083713-1.02530.153443
490.0627740.76880.221606
50-0.000303-0.00370.498521
510.0760190.9310.176664
52-0.102754-1.25850.105088
530.0235670.28860.386629
540.0871231.0670.143835
55-0.094006-1.15130.125713
56-0.061059-0.74780.227871
570.0243120.29780.383147
58-0.075335-0.92270.178833
590.0667440.81740.207486
60-3e-05-4e-040.499853

\begin{tabular}{lllllllll}
\hline
Partial Autocorrelation Function \tabularnewline
Time lag k & PACF(k) & T-STAT & P-value \tabularnewline
1 & 0.424775 & 5.2024 & 0 \tabularnewline
2 & 0.400247 & 4.902 & 1e-06 \tabularnewline
3 & 0.434953 & 5.3271 & 0 \tabularnewline
4 & -0.122792 & -1.5039 & 0.067356 \tabularnewline
5 & -0.093104 & -1.1403 & 0.127993 \tabularnewline
6 & 0.039099 & 0.4789 & 0.316365 \tabularnewline
7 & -0.234447 & -2.8714 & 0.002339 \tabularnewline
8 & -0.052891 & -0.6478 & 0.25906 \tabularnewline
9 & 0.031816 & 0.3897 & 0.348668 \tabularnewline
10 & -0.127663 & -1.5635 & 0.060016 \tabularnewline
11 & -0.258443 & -3.1653 & 0.000938 \tabularnewline
12 & -0.1532 & -1.8763 & 0.031278 \tabularnewline
13 & -0.027175 & -0.3328 & 0.369865 \tabularnewline
14 & 0.115981 & 1.4205 & 0.078773 \tabularnewline
15 & 0.151415 & 1.8545 & 0.032819 \tabularnewline
16 & -0.131312 & -1.6082 & 0.054943 \tabularnewline
17 & 0.005815 & 0.0712 & 0.471659 \tabularnewline
18 & 0.021622 & 0.2648 & 0.395756 \tabularnewline
19 & -0.076136 & -0.9325 & 0.176297 \tabularnewline
20 & 0.03046 & 0.3731 & 0.354817 \tabularnewline
21 & -0.001558 & -0.0191 & 0.492402 \tabularnewline
22 & -0.173657 & -2.1269 & 0.017534 \tabularnewline
23 & 0.091833 & 1.1247 & 0.131252 \tabularnewline
24 & -0.140374 & -1.7192 & 0.043818 \tabularnewline
25 & -0.034562 & -0.4233 & 0.336342 \tabularnewline
26 & 0.061023 & 0.7474 & 0.228005 \tabularnewline
27 & 0.067054 & 0.8212 & 0.206405 \tabularnewline
28 & -0.082328 & -1.0083 & 0.157465 \tabularnewline
29 & -0.014742 & -0.1805 & 0.428483 \tabularnewline
30 & -0.010862 & -0.133 & 0.447171 \tabularnewline
31 & 0.017264 & 0.2114 & 0.416416 \tabularnewline
32 & 0.033991 & 0.4163 & 0.33889 \tabularnewline
33 & -0.084894 & -1.0397 & 0.150068 \tabularnewline
34 & -0.085375 & -1.0456 & 0.148707 \tabularnewline
35 & -0.026545 & -0.3251 & 0.372774 \tabularnewline
36 & -0.056007 & -0.6859 & 0.246902 \tabularnewline
37 & 0.097497 & 1.1941 & 0.117163 \tabularnewline
38 & 0.045363 & 0.5556 & 0.289662 \tabularnewline
39 & -0.02788 & -0.3415 & 0.366616 \tabularnewline
40 & -0.12497 & -1.5306 & 0.063992 \tabularnewline
41 & 0.004487 & 0.055 & 0.478122 \tabularnewline
42 & -0.040213 & -0.4925 & 0.31154 \tabularnewline
43 & 0.070071 & 0.8582 & 0.196076 \tabularnewline
44 & -0.010344 & -0.1267 & 0.449678 \tabularnewline
45 & -0.110675 & -1.3555 & 0.088651 \tabularnewline
46 & 0.067042 & 0.8211 & 0.206447 \tabularnewline
47 & -0.013715 & -0.168 & 0.433417 \tabularnewline
48 & -0.083713 & -1.0253 & 0.153443 \tabularnewline
49 & 0.062774 & 0.7688 & 0.221606 \tabularnewline
50 & -0.000303 & -0.0037 & 0.498521 \tabularnewline
51 & 0.076019 & 0.931 & 0.176664 \tabularnewline
52 & -0.102754 & -1.2585 & 0.105088 \tabularnewline
53 & 0.023567 & 0.2886 & 0.386629 \tabularnewline
54 & 0.087123 & 1.067 & 0.143835 \tabularnewline
55 & -0.094006 & -1.1513 & 0.125713 \tabularnewline
56 & -0.061059 & -0.7478 & 0.227871 \tabularnewline
57 & 0.024312 & 0.2978 & 0.383147 \tabularnewline
58 & -0.075335 & -0.9227 & 0.178833 \tabularnewline
59 & 0.066744 & 0.8174 & 0.207486 \tabularnewline
60 & -3e-05 & -4e-04 & 0.499853 \tabularnewline
\hline
\end{tabular}
%Source: https://freestatistics.org/blog/index.php?pk=30042&T=2

[TABLE]
[ROW][C]Partial Autocorrelation Function[/C][/ROW]
[ROW][C]Time lag k[/C][C]PACF(k)[/C][C]T-STAT[/C][C]P-value[/C][/ROW]
[ROW][C]1[/C][C]0.424775[/C][C]5.2024[/C][C]0[/C][/ROW]
[ROW][C]2[/C][C]0.400247[/C][C]4.902[/C][C]1e-06[/C][/ROW]
[ROW][C]3[/C][C]0.434953[/C][C]5.3271[/C][C]0[/C][/ROW]
[ROW][C]4[/C][C]-0.122792[/C][C]-1.5039[/C][C]0.067356[/C][/ROW]
[ROW][C]5[/C][C]-0.093104[/C][C]-1.1403[/C][C]0.127993[/C][/ROW]
[ROW][C]6[/C][C]0.039099[/C][C]0.4789[/C][C]0.316365[/C][/ROW]
[ROW][C]7[/C][C]-0.234447[/C][C]-2.8714[/C][C]0.002339[/C][/ROW]
[ROW][C]8[/C][C]-0.052891[/C][C]-0.6478[/C][C]0.25906[/C][/ROW]
[ROW][C]9[/C][C]0.031816[/C][C]0.3897[/C][C]0.348668[/C][/ROW]
[ROW][C]10[/C][C]-0.127663[/C][C]-1.5635[/C][C]0.060016[/C][/ROW]
[ROW][C]11[/C][C]-0.258443[/C][C]-3.1653[/C][C]0.000938[/C][/ROW]
[ROW][C]12[/C][C]-0.1532[/C][C]-1.8763[/C][C]0.031278[/C][/ROW]
[ROW][C]13[/C][C]-0.027175[/C][C]-0.3328[/C][C]0.369865[/C][/ROW]
[ROW][C]14[/C][C]0.115981[/C][C]1.4205[/C][C]0.078773[/C][/ROW]
[ROW][C]15[/C][C]0.151415[/C][C]1.8545[/C][C]0.032819[/C][/ROW]
[ROW][C]16[/C][C]-0.131312[/C][C]-1.6082[/C][C]0.054943[/C][/ROW]
[ROW][C]17[/C][C]0.005815[/C][C]0.0712[/C][C]0.471659[/C][/ROW]
[ROW][C]18[/C][C]0.021622[/C][C]0.2648[/C][C]0.395756[/C][/ROW]
[ROW][C]19[/C][C]-0.076136[/C][C]-0.9325[/C][C]0.176297[/C][/ROW]
[ROW][C]20[/C][C]0.03046[/C][C]0.3731[/C][C]0.354817[/C][/ROW]
[ROW][C]21[/C][C]-0.001558[/C][C]-0.0191[/C][C]0.492402[/C][/ROW]
[ROW][C]22[/C][C]-0.173657[/C][C]-2.1269[/C][C]0.017534[/C][/ROW]
[ROW][C]23[/C][C]0.091833[/C][C]1.1247[/C][C]0.131252[/C][/ROW]
[ROW][C]24[/C][C]-0.140374[/C][C]-1.7192[/C][C]0.043818[/C][/ROW]
[ROW][C]25[/C][C]-0.034562[/C][C]-0.4233[/C][C]0.336342[/C][/ROW]
[ROW][C]26[/C][C]0.061023[/C][C]0.7474[/C][C]0.228005[/C][/ROW]
[ROW][C]27[/C][C]0.067054[/C][C]0.8212[/C][C]0.206405[/C][/ROW]
[ROW][C]28[/C][C]-0.082328[/C][C]-1.0083[/C][C]0.157465[/C][/ROW]
[ROW][C]29[/C][C]-0.014742[/C][C]-0.1805[/C][C]0.428483[/C][/ROW]
[ROW][C]30[/C][C]-0.010862[/C][C]-0.133[/C][C]0.447171[/C][/ROW]
[ROW][C]31[/C][C]0.017264[/C][C]0.2114[/C][C]0.416416[/C][/ROW]
[ROW][C]32[/C][C]0.033991[/C][C]0.4163[/C][C]0.33889[/C][/ROW]
[ROW][C]33[/C][C]-0.084894[/C][C]-1.0397[/C][C]0.150068[/C][/ROW]
[ROW][C]34[/C][C]-0.085375[/C][C]-1.0456[/C][C]0.148707[/C][/ROW]
[ROW][C]35[/C][C]-0.026545[/C][C]-0.3251[/C][C]0.372774[/C][/ROW]
[ROW][C]36[/C][C]-0.056007[/C][C]-0.6859[/C][C]0.246902[/C][/ROW]
[ROW][C]37[/C][C]0.097497[/C][C]1.1941[/C][C]0.117163[/C][/ROW]
[ROW][C]38[/C][C]0.045363[/C][C]0.5556[/C][C]0.289662[/C][/ROW]
[ROW][C]39[/C][C]-0.02788[/C][C]-0.3415[/C][C]0.366616[/C][/ROW]
[ROW][C]40[/C][C]-0.12497[/C][C]-1.5306[/C][C]0.063992[/C][/ROW]
[ROW][C]41[/C][C]0.004487[/C][C]0.055[/C][C]0.478122[/C][/ROW]
[ROW][C]42[/C][C]-0.040213[/C][C]-0.4925[/C][C]0.31154[/C][/ROW]
[ROW][C]43[/C][C]0.070071[/C][C]0.8582[/C][C]0.196076[/C][/ROW]
[ROW][C]44[/C][C]-0.010344[/C][C]-0.1267[/C][C]0.449678[/C][/ROW]
[ROW][C]45[/C][C]-0.110675[/C][C]-1.3555[/C][C]0.088651[/C][/ROW]
[ROW][C]46[/C][C]0.067042[/C][C]0.8211[/C][C]0.206447[/C][/ROW]
[ROW][C]47[/C][C]-0.013715[/C][C]-0.168[/C][C]0.433417[/C][/ROW]
[ROW][C]48[/C][C]-0.083713[/C][C]-1.0253[/C][C]0.153443[/C][/ROW]
[ROW][C]49[/C][C]0.062774[/C][C]0.7688[/C][C]0.221606[/C][/ROW]
[ROW][C]50[/C][C]-0.000303[/C][C]-0.0037[/C][C]0.498521[/C][/ROW]
[ROW][C]51[/C][C]0.076019[/C][C]0.931[/C][C]0.176664[/C][/ROW]
[ROW][C]52[/C][C]-0.102754[/C][C]-1.2585[/C][C]0.105088[/C][/ROW]
[ROW][C]53[/C][C]0.023567[/C][C]0.2886[/C][C]0.386629[/C][/ROW]
[ROW][C]54[/C][C]0.087123[/C][C]1.067[/C][C]0.143835[/C][/ROW]
[ROW][C]55[/C][C]-0.094006[/C][C]-1.1513[/C][C]0.125713[/C][/ROW]
[ROW][C]56[/C][C]-0.061059[/C][C]-0.7478[/C][C]0.227871[/C][/ROW]
[ROW][C]57[/C][C]0.024312[/C][C]0.2978[/C][C]0.383147[/C][/ROW]
[ROW][C]58[/C][C]-0.075335[/C][C]-0.9227[/C][C]0.178833[/C][/ROW]
[ROW][C]59[/C][C]0.066744[/C][C]0.8174[/C][C]0.207486[/C][/ROW]
[ROW][C]60[/C][C]-3e-05[/C][C]-4e-04[/C][C]0.499853[/C][/ROW]
[/TABLE]
Source: https://freestatistics.org/blog/index.php?pk=30042&T=2

Globally Unique Identifier (entire table): ba.freestatistics.org/blog/index.php?pk=30042&T=2

As an alternative you can also use a QR Code:  

The GUIDs for individual cells are displayed in the table below:

Partial Autocorrelation Function
Time lag kPACF(k)T-STATP-value
10.4247755.20240
20.4002474.9021e-06
30.4349535.32710
4-0.122792-1.50390.067356
5-0.093104-1.14030.127993
60.0390990.47890.316365
7-0.234447-2.87140.002339
8-0.052891-0.64780.25906
90.0318160.38970.348668
10-0.127663-1.56350.060016
11-0.258443-3.16530.000938
12-0.1532-1.87630.031278
13-0.027175-0.33280.369865
140.1159811.42050.078773
150.1514151.85450.032819
16-0.131312-1.60820.054943
170.0058150.07120.471659
180.0216220.26480.395756
19-0.076136-0.93250.176297
200.030460.37310.354817
21-0.001558-0.01910.492402
22-0.173657-2.12690.017534
230.0918331.12470.131252
24-0.140374-1.71920.043818
25-0.034562-0.42330.336342
260.0610230.74740.228005
270.0670540.82120.206405
28-0.082328-1.00830.157465
29-0.014742-0.18050.428483
30-0.010862-0.1330.447171
310.0172640.21140.416416
320.0339910.41630.33889
33-0.084894-1.03970.150068
34-0.085375-1.04560.148707
35-0.026545-0.32510.372774
36-0.056007-0.68590.246902
370.0974971.19410.117163
380.0453630.55560.289662
39-0.02788-0.34150.366616
40-0.12497-1.53060.063992
410.0044870.0550.478122
42-0.040213-0.49250.31154
430.0700710.85820.196076
44-0.010344-0.12670.449678
45-0.110675-1.35550.088651
460.0670420.82110.206447
47-0.013715-0.1680.433417
48-0.083713-1.02530.153443
490.0627740.76880.221606
50-0.000303-0.00370.498521
510.0760190.9310.176664
52-0.102754-1.25850.105088
530.0235670.28860.386629
540.0871231.0670.143835
55-0.094006-1.15130.125713
56-0.061059-0.74780.227871
570.0243120.29780.383147
58-0.075335-0.92270.178833
590.0667440.81740.207486
60-3e-05-4e-040.499853


Parameters (Session):
par1 = 60 ; par2 = 0.3 ; par3 = 0 ; par4 = 1 ; par5 = 12 ;
Parameters (R input):
par1 = 60 ; par2 = 0.3 ; par3 = 0 ; par4 = 1 ; par5 = 12 ;
R code (references can be found in the software module):
if (par1 == 'Default') {
par1 = 10*log10(length(x))
} else {
par1 <- as.numeric(par1)
}
par2 <- as.numeric(par2)
par3 <- as.numeric(par3)
par4 <- as.numeric(par4)
par5 <- as.numeric(par5)
if (par2 == 0) {
x <- log(x)
} else {
x <- (x ^ par2 - 1) / par2
}
if (par3 > 0) x <- diff(x,lag=1,difference=par3)
if (par4 > 0) x <- diff(x,lag=par5,difference=par4)
bitmap(file='pic1.png')
racf <- acf(x,par1,main='Autocorrelation',xlab='lags',ylab='ACF')
dev.off()
bitmap(file='pic2.png')
rpacf <- pacf(x,par1,main='Partial Autocorrelation',xlab='lags',ylab='PACF')
dev.off()
(myacf <- c(racf$acf))
(mypacf <- c(rpacf$acf))
lengthx <- length(x)
sqrtn <- sqrt(lengthx)
load(file='createtable')
a<-table.start()
a<-table.row.start(a)
a<-table.element(a,'Autocorrelation Function',4,TRUE)
a<-table.row.end(a)
a<-table.row.start(a)
a<-table.element(a,'Time lag k',header=TRUE)
a<-table.element(a,hyperlink('basics.htm','ACF(k)','click here for more information about the Autocorrelation Function'),header=TRUE)
a<-table.element(a,'T-STAT',header=TRUE)
a<-table.element(a,'P-value',header=TRUE)
a<-table.row.end(a)
for (i in 2:(par1+1)) {
a<-table.row.start(a)
a<-table.element(a,i-1,header=TRUE)
a<-table.element(a,round(myacf[i],6))
mytstat <- myacf[i]*sqrtn
a<-table.element(a,round(mytstat,4))
a<-table.element(a,round(1-pt(abs(mytstat),lengthx),6))
a<-table.row.end(a)
}
a<-table.end(a)
table.save(a,file='mytable.tab')
a<-table.start()
a<-table.row.start(a)
a<-table.element(a,'Partial Autocorrelation Function',4,TRUE)
a<-table.row.end(a)
a<-table.row.start(a)
a<-table.element(a,'Time lag k',header=TRUE)
a<-table.element(a,hyperlink('basics.htm','PACF(k)','click here for more information about the Partial Autocorrelation Function'),header=TRUE)
a<-table.element(a,'T-STAT',header=TRUE)
a<-table.element(a,'P-value',header=TRUE)
a<-table.row.end(a)
for (i in 1:par1) {
a<-table.row.start(a)
a<-table.element(a,i,header=TRUE)
a<-table.element(a,round(mypacf[i],6))
mytstat <- mypacf[i]*sqrtn
a<-table.element(a,round(mytstat,4))
a<-table.element(a,round(1-pt(abs(mytstat),lengthx),6))
a<-table.row.end(a)
}
a<-table.end(a)
table.save(a,file='mytable1.tab')