Free Statistics

of Irreproducible Research!

Author's title

Author*The author of this computation has been verified*
R Software Modulerwasp_arimaforecasting.wasp
Title produced by softwareARIMA Forecasting
Date of computationTue, 16 Dec 2008 03:54:27 -0700
Cite this page as followsStatistical Computations at FreeStatistics.org, Office for Research Development and Education, URL https://freestatistics.org/blog/index.php?v=date/2008/Dec/16/t1229425012s00gi4c4ic2qx9k.htm/, Retrieved Sat, 25 May 2024 00:30:10 +0000
Statistical Computations at FreeStatistics.org, Office for Research Development and Education, URL https://freestatistics.org/blog/index.php?pk=33906, Retrieved Sat, 25 May 2024 00:30:10 +0000
QR Codes:

Original text written by user:
IsPrivate?No (this computation is public)
User-defined keywords
Estimated Impact231
Family? (F = Feedback message, R = changed R code, M = changed R Module, P = changed Parameters, D = changed Data)
-     [ARIMA Forecasting] [step 1] [2008-12-16 10:15:11] [d811f621c525a990f9b60f1ae1e2e8fd]
-   PD  [ARIMA Forecasting] [step 1] [2008-12-16 10:47:55] [d811f621c525a990f9b60f1ae1e2e8fd]
F   P       [ARIMA Forecasting] [step 1] [2008-12-16 10:54:27] [f4914427e726625a358be9269a8b7d03] [Current]
Feedback Forum
2008-12-18 10:46:39 [72e979bcc364082694890d2eccc1a66f] [reply
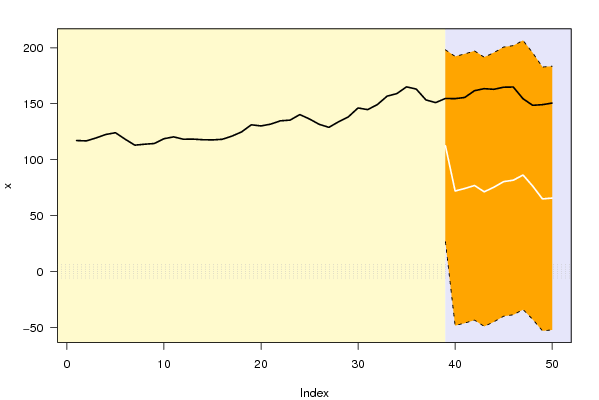
Voor stap 1 moeten we eigenlijk enkel naar de eerste grafiek kijken uit de software. Je moet dan kijken of de lijn van de voorspelde waarden in het betrouwbaarheidsinterval ligt. Hier ligt die er duidelijk binnen. Dit wil dus zeggen dat er geen explosiviteit is. Wat er toe leidt dat de AR processen stabiel zijn en de MA processen omkeerbaar.
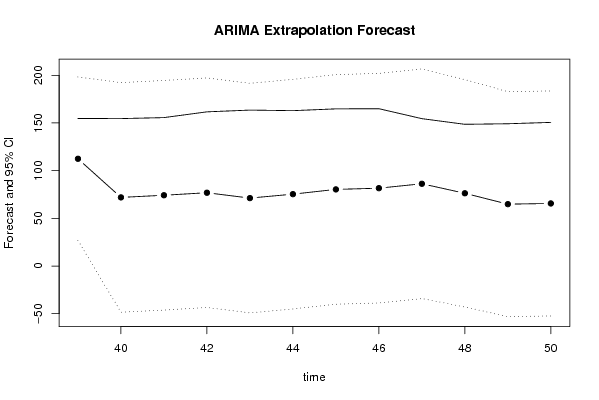
Voor stap 2 moet je kijken naar beide grafieken. Hier zie je dan inderdaad dat er geen sprake is van seizoenaliteit of conjunctuur.
Voor stap 3 zie je hier dat bijna alle PE-waarden groter zijn dan de %SE-waarden. Ofwel wordt de werkelijke fout hier overschat, ofwel is er iets exceptioneel gebeurd.
Voor stap 5 wordt er gekeken naar de p-value. Hier is die altijd groter dan 5% wat ertoe leidt dat het verschil tussen de voorspelde waarde en de werkelijke waarde niet significant is.
2008-12-23 08:49:07 [Katrijn Truyman] [reply
STEP 1: de p-waarden zijn allemaal groter dan 5%, dus er is geen significant verschil. Zowel uit de tweede tabel (kolom 2 en 3: SE en PE) als de eerste grafiek tonen aan dat de voorspelde waarden heel wat lager liggen dan de werkelijke waarden.
STEP 2: Er is geen seizonaliteit, in de eerste grafiek is er een licht stijgende trend (gezien over de gehele periode), maar de 12 voorspelde maanden vertonen geen ander patroon dan voorheen. In de tweede grafiek valt de voorspelling (curve met de bollen) binnen het betrouwbaarheidsinterval, dus geen significant verschil.
STEP 3: Hoe verder we in de toekomst gaan voorspellen, hoe groter de standaardafwijking wordt, omdat de onzekerheid toeneemt over wat er zich in de toekomst zal voordoen. De voorspelde waarden zijn lager dan de werkelijke waarden.
STEP 4: P(F[t]>Y[t-1]) geeft de waarschijnlijkheid weer dat de huidige waarde groter is dan de waarde van vorig jaar, niet van de vorige periode, hiervoor moeten we kijken naar de kolom P(F[t]>Y[t-s]). Als we de waarschijnlijkheid willen weten dat de huidige waarde groter is dan de laatst gekende waarde, moeten we kijken naar de laatste kolom P(F[t]>Y[38]).
STEP 5: In tabel 1 zien we dat de p-waarde steeds groter is dan 5%, dus geen significant verschil tussen de voorspelde waarde en de werkelijke waarde. In de tweede tabel zien we dat de SE (voorspelde waarde) kleiner is dan de PE (werkelijke waarde).

Post a new message
Dataseries X:
117.09
116.77
119.39
122.49
124.08
118.29
112.94
113.79
114.43
118.70
120.36
118.27
118.34
117.82
117.65
118.18
121.02
124.78
131.16
130.14
131.75
134.73
135.35
140.32
136.35
131.60
128.90
133.89
138.25
146.23
144.76
149.30
156.80
159.08
165.12
163.14
153.43
151.01
154.72
154.58
155.63
161.67
163.51
162.91
164.80
164.98
154.54
148.60
149.19
150.61


Summary of computational transaction
Raw Inputview raw input (R code)
Raw Outputview raw output of R engine
Computing time1 seconds
R Server'Gwilym Jenkins' @ 72.249.127.135

\begin{tabular}{lllllllll}
\hline
Summary of computational transaction \tabularnewline
Raw Input & view raw input (R code)  \tabularnewline
Raw Output & view raw output of R engine  \tabularnewline
Computing time & 1 seconds \tabularnewline
R Server & 'Gwilym Jenkins' @ 72.249.127.135 \tabularnewline
\hline
\end{tabular}
%Source: https://freestatistics.org/blog/index.php?pk=33906&T=0

[TABLE]
[ROW][C]Summary of computational transaction[/C][/ROW]
[ROW][C]Raw Input[/C][C]view raw input (R code) [/C][/ROW]
[ROW][C]Raw Output[/C][C]view raw output of R engine [/C][/ROW]
[ROW][C]Computing time[/C][C]1 seconds[/C][/ROW]
[ROW][C]R Server[/C][C]'Gwilym Jenkins' @ 72.249.127.135[/C][/ROW]
[/TABLE]
Source: https://freestatistics.org/blog/index.php?pk=33906&T=0

Globally Unique Identifier (entire table): ba.freestatistics.org/blog/index.php?pk=33906&T=0

As an alternative you can also use a QR Code:  

The GUIDs for individual cells are displayed in the table below:

Summary of computational transaction
Raw Inputview raw input (R code)
Raw Outputview raw output of R engine
Computing time1 seconds
R Server'Gwilym Jenkins' @ 72.249.127.135


Univariate ARIMA Extrapolation Forecast
timeY[t]F[t]95% LB95% UBp-value(H0: Y[t] = F[t])P(F[t]>Y[t-1])P(F[t]>Y[t-s])P(F[t]>Y[38])
26131.6-------
27128.9-------
28133.89-------
29138.25-------
30146.23-------
31144.76-------
32149.3-------
33156.8-------
34159.08-------
35165.12-------
36163.14-------
37153.43-------
38151.01-------
39154.72112.471326.6644198.27820.16730.18930.35370.1893
40154.5871.95-48.4475192.34740.08930.08890.15660.099
41155.6374.1975-46.2194.59490.09250.09530.14850.1056
42161.6776.855-43.5425197.25240.08370.09980.12940.1137
43163.5171.225-49.1725191.62250.06650.07050.11560.097
44162.9175.3525-45.045195.750.0770.07560.11430.109
45164.880.3325-40.065200.72990.08460.08940.10660.125
46164.9881.62-38.7775202.01740.08740.08780.10370.1293
47154.5486.255-34.1425206.65240.13310.10.09960.1459
48148.676.2702-42.9365195.47690.11720.09910.07660.1096
49149.1964.852-53.113182.8170.08060.0820.07050.0761
50150.6165.622-52.343183.5870.0790.08250.0780.078

\begin{tabular}{lllllllll}
\hline
Univariate ARIMA Extrapolation Forecast \tabularnewline
time & Y[t] & F[t] & 95% LB & 95% UB & p-value(H0: Y[t] = F[t]) & P(F[t]>Y[t-1]) & P(F[t]>Y[t-s]) & P(F[t]>Y[38]) \tabularnewline
26 & 131.6 & - & - & - & - & - & - & - \tabularnewline
27 & 128.9 & - & - & - & - & - & - & - \tabularnewline
28 & 133.89 & - & - & - & - & - & - & - \tabularnewline
29 & 138.25 & - & - & - & - & - & - & - \tabularnewline
30 & 146.23 & - & - & - & - & - & - & - \tabularnewline
31 & 144.76 & - & - & - & - & - & - & - \tabularnewline
32 & 149.3 & - & - & - & - & - & - & - \tabularnewline
33 & 156.8 & - & - & - & - & - & - & - \tabularnewline
34 & 159.08 & - & - & - & - & - & - & - \tabularnewline
35 & 165.12 & - & - & - & - & - & - & - \tabularnewline
36 & 163.14 & - & - & - & - & - & - & - \tabularnewline
37 & 153.43 & - & - & - & - & - & - & - \tabularnewline
38 & 151.01 & - & - & - & - & - & - & - \tabularnewline
39 & 154.72 & 112.4713 & 26.6644 & 198.2782 & 0.1673 & 0.1893 & 0.3537 & 0.1893 \tabularnewline
40 & 154.58 & 71.95 & -48.4475 & 192.3474 & 0.0893 & 0.0889 & 0.1566 & 0.099 \tabularnewline
41 & 155.63 & 74.1975 & -46.2 & 194.5949 & 0.0925 & 0.0953 & 0.1485 & 0.1056 \tabularnewline
42 & 161.67 & 76.855 & -43.5425 & 197.2524 & 0.0837 & 0.0998 & 0.1294 & 0.1137 \tabularnewline
43 & 163.51 & 71.225 & -49.1725 & 191.6225 & 0.0665 & 0.0705 & 0.1156 & 0.097 \tabularnewline
44 & 162.91 & 75.3525 & -45.045 & 195.75 & 0.077 & 0.0756 & 0.1143 & 0.109 \tabularnewline
45 & 164.8 & 80.3325 & -40.065 & 200.7299 & 0.0846 & 0.0894 & 0.1066 & 0.125 \tabularnewline
46 & 164.98 & 81.62 & -38.7775 & 202.0174 & 0.0874 & 0.0878 & 0.1037 & 0.1293 \tabularnewline
47 & 154.54 & 86.255 & -34.1425 & 206.6524 & 0.1331 & 0.1 & 0.0996 & 0.1459 \tabularnewline
48 & 148.6 & 76.2702 & -42.9365 & 195.4769 & 0.1172 & 0.0991 & 0.0766 & 0.1096 \tabularnewline
49 & 149.19 & 64.852 & -53.113 & 182.817 & 0.0806 & 0.082 & 0.0705 & 0.0761 \tabularnewline
50 & 150.61 & 65.622 & -52.343 & 183.587 & 0.079 & 0.0825 & 0.078 & 0.078 \tabularnewline
\hline
\end{tabular}
%Source: https://freestatistics.org/blog/index.php?pk=33906&T=1

[TABLE]
[ROW][C]Univariate ARIMA Extrapolation Forecast[/C][/ROW]
[ROW][C]time[/C][C]Y[t][/C][C]F[t][/C][C]95% LB[/C][C]95% UB[/C][C]p-value(H0: Y[t] = F[t])[/C][C]P(F[t]>Y[t-1])[/C][C]P(F[t]>Y[t-s])[/C][C]P(F[t]>Y[38])[/C][/ROW]
[ROW][C]26[/C][C]131.6[/C][C]-[/C][C]-[/C][C]-[/C][C]-[/C][C]-[/C][C]-[/C][C]-[/C][/ROW]
[ROW][C]27[/C][C]128.9[/C][C]-[/C][C]-[/C][C]-[/C][C]-[/C][C]-[/C][C]-[/C][C]-[/C][/ROW]
[ROW][C]28[/C][C]133.89[/C][C]-[/C][C]-[/C][C]-[/C][C]-[/C][C]-[/C][C]-[/C][C]-[/C][/ROW]
[ROW][C]29[/C][C]138.25[/C][C]-[/C][C]-[/C][C]-[/C][C]-[/C][C]-[/C][C]-[/C][C]-[/C][/ROW]
[ROW][C]30[/C][C]146.23[/C][C]-[/C][C]-[/C][C]-[/C][C]-[/C][C]-[/C][C]-[/C][C]-[/C][/ROW]
[ROW][C]31[/C][C]144.76[/C][C]-[/C][C]-[/C][C]-[/C][C]-[/C][C]-[/C][C]-[/C][C]-[/C][/ROW]
[ROW][C]32[/C][C]149.3[/C][C]-[/C][C]-[/C][C]-[/C][C]-[/C][C]-[/C][C]-[/C][C]-[/C][/ROW]
[ROW][C]33[/C][C]156.8[/C][C]-[/C][C]-[/C][C]-[/C][C]-[/C][C]-[/C][C]-[/C][C]-[/C][/ROW]
[ROW][C]34[/C][C]159.08[/C][C]-[/C][C]-[/C][C]-[/C][C]-[/C][C]-[/C][C]-[/C][C]-[/C][/ROW]
[ROW][C]35[/C][C]165.12[/C][C]-[/C][C]-[/C][C]-[/C][C]-[/C][C]-[/C][C]-[/C][C]-[/C][/ROW]
[ROW][C]36[/C][C]163.14[/C][C]-[/C][C]-[/C][C]-[/C][C]-[/C][C]-[/C][C]-[/C][C]-[/C][/ROW]
[ROW][C]37[/C][C]153.43[/C][C]-[/C][C]-[/C][C]-[/C][C]-[/C][C]-[/C][C]-[/C][C]-[/C][/ROW]
[ROW][C]38[/C][C]151.01[/C][C]-[/C][C]-[/C][C]-[/C][C]-[/C][C]-[/C][C]-[/C][C]-[/C][/ROW]
[ROW][C]39[/C][C]154.72[/C][C]112.4713[/C][C]26.6644[/C][C]198.2782[/C][C]0.1673[/C][C]0.1893[/C][C]0.3537[/C][C]0.1893[/C][/ROW]
[ROW][C]40[/C][C]154.58[/C][C]71.95[/C][C]-48.4475[/C][C]192.3474[/C][C]0.0893[/C][C]0.0889[/C][C]0.1566[/C][C]0.099[/C][/ROW]
[ROW][C]41[/C][C]155.63[/C][C]74.1975[/C][C]-46.2[/C][C]194.5949[/C][C]0.0925[/C][C]0.0953[/C][C]0.1485[/C][C]0.1056[/C][/ROW]
[ROW][C]42[/C][C]161.67[/C][C]76.855[/C][C]-43.5425[/C][C]197.2524[/C][C]0.0837[/C][C]0.0998[/C][C]0.1294[/C][C]0.1137[/C][/ROW]
[ROW][C]43[/C][C]163.51[/C][C]71.225[/C][C]-49.1725[/C][C]191.6225[/C][C]0.0665[/C][C]0.0705[/C][C]0.1156[/C][C]0.097[/C][/ROW]
[ROW][C]44[/C][C]162.91[/C][C]75.3525[/C][C]-45.045[/C][C]195.75[/C][C]0.077[/C][C]0.0756[/C][C]0.1143[/C][C]0.109[/C][/ROW]
[ROW][C]45[/C][C]164.8[/C][C]80.3325[/C][C]-40.065[/C][C]200.7299[/C][C]0.0846[/C][C]0.0894[/C][C]0.1066[/C][C]0.125[/C][/ROW]
[ROW][C]46[/C][C]164.98[/C][C]81.62[/C][C]-38.7775[/C][C]202.0174[/C][C]0.0874[/C][C]0.0878[/C][C]0.1037[/C][C]0.1293[/C][/ROW]
[ROW][C]47[/C][C]154.54[/C][C]86.255[/C][C]-34.1425[/C][C]206.6524[/C][C]0.1331[/C][C]0.1[/C][C]0.0996[/C][C]0.1459[/C][/ROW]
[ROW][C]48[/C][C]148.6[/C][C]76.2702[/C][C]-42.9365[/C][C]195.4769[/C][C]0.1172[/C][C]0.0991[/C][C]0.0766[/C][C]0.1096[/C][/ROW]
[ROW][C]49[/C][C]149.19[/C][C]64.852[/C][C]-53.113[/C][C]182.817[/C][C]0.0806[/C][C]0.082[/C][C]0.0705[/C][C]0.0761[/C][/ROW]
[ROW][C]50[/C][C]150.61[/C][C]65.622[/C][C]-52.343[/C][C]183.587[/C][C]0.079[/C][C]0.0825[/C][C]0.078[/C][C]0.078[/C][/ROW]
[/TABLE]
Source: https://freestatistics.org/blog/index.php?pk=33906&T=1

Globally Unique Identifier (entire table): ba.freestatistics.org/blog/index.php?pk=33906&T=1

As an alternative you can also use a QR Code:  

The GUIDs for individual cells are displayed in the table below:

Univariate ARIMA Extrapolation Forecast
timeY[t]F[t]95% LB95% UBp-value(H0: Y[t] = F[t])P(F[t]>Y[t-1])P(F[t]>Y[t-s])P(F[t]>Y[38])
26131.6-------
27128.9-------
28133.89-------
29138.25-------
30146.23-------
31144.76-------
32149.3-------
33156.8-------
34159.08-------
35165.12-------
36163.14-------
37153.43-------
38151.01-------
39154.72112.471326.6644198.27820.16730.18930.35370.1893
40154.5871.95-48.4475192.34740.08930.08890.15660.099
41155.6374.1975-46.2194.59490.09250.09530.14850.1056
42161.6776.855-43.5425197.25240.08370.09980.12940.1137
43163.5171.225-49.1725191.62250.06650.07050.11560.097
44162.9175.3525-45.045195.750.0770.07560.11430.109
45164.880.3325-40.065200.72990.08460.08940.10660.125
46164.9881.62-38.7775202.01740.08740.08780.10370.1293
47154.5486.255-34.1425206.65240.13310.10.09960.1459
48148.676.2702-42.9365195.47690.11720.09910.07660.1096
49149.1964.852-53.113182.8170.08060.0820.07050.0761
50150.6165.622-52.343183.5870.0790.08250.0780.078


Univariate ARIMA Extrapolation Forecast Performance
time% S.E.PEMAPESq.EMSERMSE
390.38920.37560.03131784.9503148.745912.1961
400.85381.14840.09576827.7233568.976923.8532
410.82791.09750.09156631.2585552.604923.5075
420.79931.10360.0927193.5909599.465924.484
430.86241.29570.1088516.5275709.710626.6404
440.81521.1620.09687666.3222638.860225.2757
450.76471.05150.08767134.7652594.563824.3837
460.75261.02130.08516948.8963579.074724.064
470.71220.79170.0664662.8471388.570619.7122
480.79740.94830.0795231.6001435.966720.8798
490.92811.30050.10847112.9015592.741824.3463
500.91721.29510.10797222.9638601.913724.5339

\begin{tabular}{lllllllll}
\hline
Univariate ARIMA Extrapolation Forecast Performance \tabularnewline
time & % S.E. & PE & MAPE & Sq.E & MSE & RMSE \tabularnewline
39 & 0.3892 & 0.3756 & 0.0313 & 1784.9503 & 148.7459 & 12.1961 \tabularnewline
40 & 0.8538 & 1.1484 & 0.0957 & 6827.7233 & 568.9769 & 23.8532 \tabularnewline
41 & 0.8279 & 1.0975 & 0.0915 & 6631.2585 & 552.6049 & 23.5075 \tabularnewline
42 & 0.7993 & 1.1036 & 0.092 & 7193.5909 & 599.4659 & 24.484 \tabularnewline
43 & 0.8624 & 1.2957 & 0.108 & 8516.5275 & 709.7106 & 26.6404 \tabularnewline
44 & 0.8152 & 1.162 & 0.0968 & 7666.3222 & 638.8602 & 25.2757 \tabularnewline
45 & 0.7647 & 1.0515 & 0.0876 & 7134.7652 & 594.5638 & 24.3837 \tabularnewline
46 & 0.7526 & 1.0213 & 0.0851 & 6948.8963 & 579.0747 & 24.064 \tabularnewline
47 & 0.7122 & 0.7917 & 0.066 & 4662.8471 & 388.5706 & 19.7122 \tabularnewline
48 & 0.7974 & 0.9483 & 0.079 & 5231.6001 & 435.9667 & 20.8798 \tabularnewline
49 & 0.9281 & 1.3005 & 0.1084 & 7112.9015 & 592.7418 & 24.3463 \tabularnewline
50 & 0.9172 & 1.2951 & 0.1079 & 7222.9638 & 601.9137 & 24.5339 \tabularnewline
\hline
\end{tabular}
%Source: https://freestatistics.org/blog/index.php?pk=33906&T=2

[TABLE]
[ROW][C]Univariate ARIMA Extrapolation Forecast Performance[/C][/ROW]
[ROW][C]time[/C][C]% S.E.[/C][C]PE[/C][C]MAPE[/C][C]Sq.E[/C][C]MSE[/C][C]RMSE[/C][/ROW]
[ROW][C]39[/C][C]0.3892[/C][C]0.3756[/C][C]0.0313[/C][C]1784.9503[/C][C]148.7459[/C][C]12.1961[/C][/ROW]
[ROW][C]40[/C][C]0.8538[/C][C]1.1484[/C][C]0.0957[/C][C]6827.7233[/C][C]568.9769[/C][C]23.8532[/C][/ROW]
[ROW][C]41[/C][C]0.8279[/C][C]1.0975[/C][C]0.0915[/C][C]6631.2585[/C][C]552.6049[/C][C]23.5075[/C][/ROW]
[ROW][C]42[/C][C]0.7993[/C][C]1.1036[/C][C]0.092[/C][C]7193.5909[/C][C]599.4659[/C][C]24.484[/C][/ROW]
[ROW][C]43[/C][C]0.8624[/C][C]1.2957[/C][C]0.108[/C][C]8516.5275[/C][C]709.7106[/C][C]26.6404[/C][/ROW]
[ROW][C]44[/C][C]0.8152[/C][C]1.162[/C][C]0.0968[/C][C]7666.3222[/C][C]638.8602[/C][C]25.2757[/C][/ROW]
[ROW][C]45[/C][C]0.7647[/C][C]1.0515[/C][C]0.0876[/C][C]7134.7652[/C][C]594.5638[/C][C]24.3837[/C][/ROW]
[ROW][C]46[/C][C]0.7526[/C][C]1.0213[/C][C]0.0851[/C][C]6948.8963[/C][C]579.0747[/C][C]24.064[/C][/ROW]
[ROW][C]47[/C][C]0.7122[/C][C]0.7917[/C][C]0.066[/C][C]4662.8471[/C][C]388.5706[/C][C]19.7122[/C][/ROW]
[ROW][C]48[/C][C]0.7974[/C][C]0.9483[/C][C]0.079[/C][C]5231.6001[/C][C]435.9667[/C][C]20.8798[/C][/ROW]
[ROW][C]49[/C][C]0.9281[/C][C]1.3005[/C][C]0.1084[/C][C]7112.9015[/C][C]592.7418[/C][C]24.3463[/C][/ROW]
[ROW][C]50[/C][C]0.9172[/C][C]1.2951[/C][C]0.1079[/C][C]7222.9638[/C][C]601.9137[/C][C]24.5339[/C][/ROW]
[/TABLE]
Source: https://freestatistics.org/blog/index.php?pk=33906&T=2

Globally Unique Identifier (entire table): ba.freestatistics.org/blog/index.php?pk=33906&T=2

As an alternative you can also use a QR Code:  

The GUIDs for individual cells are displayed in the table below:

Univariate ARIMA Extrapolation Forecast Performance
time% S.E.PEMAPESq.EMSERMSE
390.38920.37560.03131784.9503148.745912.1961
400.85381.14840.09576827.7233568.976923.8532
410.82791.09750.09156631.2585552.604923.5075
420.79931.10360.0927193.5909599.465924.484
430.86241.29570.1088516.5275709.710626.6404
440.81521.1620.09687666.3222638.860225.2757
450.76471.05150.08767134.7652594.563824.3837
460.75261.02130.08516948.8963579.074724.064
470.71220.79170.0664662.8471388.570619.7122
480.79740.94830.0795231.6001435.966720.8798
490.92811.30050.10847112.9015592.741824.3463
500.91721.29510.10797222.9638601.913724.5339


Parameters (Session):
par1 = 12 ; par2 = 1 ; par3 = 0 ; par4 = 0 ; par5 = 12 ; par6 = 0 ; par7 = 1 ; par8 = 0 ; par9 = 1 ; par10 = FALSE ;
Parameters (R input):
par1 = 12 ; par2 = 1 ; par3 = 0 ; par4 = 0 ; par5 = 12 ; par6 = 0 ; par7 = 1 ; par8 = 0 ; par9 = 1 ; par10 = FALSE ;
R code (references can be found in the software module):
par1 <- as.numeric(par1) #cut off periods
par2 <- as.numeric(par2) #lambda
par3 <- as.numeric(par3) #degree of non-seasonal differencing
par4 <- as.numeric(par4) #degree of seasonal differencing
par5 <- as.numeric(par5) #seasonal period
par6 <- as.numeric(par6) #p
par7 <- as.numeric(par7) #q
par8 <- as.numeric(par8) #P
par9 <- as.numeric(par9) #Q
if (par10 == 'TRUE') par10 <- TRUE
if (par10 == 'FALSE') par10 <- FALSE
if (par2 == 0) x <- log(x)
if (par2 != 0) x <- x^par2
lx <- length(x)
first <- lx - 2*par1
nx <- lx - par1
nx1 <- nx + 1
fx <- lx - nx
if (fx < 1) {
fx <- par5
nx1 <- lx + fx - 1
first <- lx - 2*fx
}
first <- 1
if (fx < 3) fx <- round(lx/10,0)
(arima.out <- arima(x[1:nx], order=c(par6,par3,par7), seasonal=list(order=c(par8,par4,par9), period=par5), include.mean=par10, method='ML'))
(forecast <- predict(arima.out,fx))
(lb <- forecast$pred - 1.96 * forecast$se)
(ub <- forecast$pred + 1.96 * forecast$se)
if (par2 == 0) {
x <- exp(x)
forecast$pred <- exp(forecast$pred)
lb <- exp(lb)
ub <- exp(ub)
}
if (par2 != 0) {
x <- x^(1/par2)
forecast$pred <- forecast$pred^(1/par2)
lb <- lb^(1/par2)
ub <- ub^(1/par2)
}
if (par2 < 0) {
olb <- lb
lb <- ub
ub <- olb
}
(actandfor <- c(x[1:nx], forecast$pred))
(perc.se <- (ub-forecast$pred)/1.96/forecast$pred)
bitmap(file='test1.png')
opar <- par(mar=c(4,4,2,2),las=1)
ylim <- c( min(x[first:nx],lb), max(x[first:nx],ub))
plot(x,ylim=ylim,type='n',xlim=c(first,lx))
usr <- par('usr')
rect(usr[1],usr[3],nx+1,usr[4],border=NA,col='lemonchiffon')
rect(nx1,usr[3],usr[2],usr[4],border=NA,col='lavender')
abline(h= (-3:3)*2 , col ='gray', lty =3)
polygon( c(nx1:lx,lx:nx1), c(lb,rev(ub)), col = 'orange', lty=2,border=NA)
lines(nx1:lx, lb , lty=2)
lines(nx1:lx, ub , lty=2)
lines(x, lwd=2)
lines(nx1:lx, forecast$pred , lwd=2 , col ='white')
box()
par(opar)
dev.off()
prob.dec <- array(NA, dim=fx)
prob.sdec <- array(NA, dim=fx)
prob.ldec <- array(NA, dim=fx)
prob.pval <- array(NA, dim=fx)
perf.pe <- array(0, dim=fx)
perf.mape <- array(0, dim=fx)
perf.se <- array(0, dim=fx)
perf.mse <- array(0, dim=fx)
perf.rmse <- array(0, dim=fx)
for (i in 1:fx) {
locSD <- (ub[i] - forecast$pred[i]) / 1.96
perf.pe[i] = (x[nx+i] - forecast$pred[i]) / forecast$pred[i]
perf.mape[i] = perf.mape[i] + abs(perf.pe[i])
perf.se[i] = (x[nx+i] - forecast$pred[i])^2
perf.mse[i] = perf.mse[i] + perf.se[i]
prob.dec[i] = pnorm((x[nx+i-1] - forecast$pred[i]) / locSD)
prob.sdec[i] = pnorm((x[nx+i-par5] - forecast$pred[i]) / locSD)
prob.ldec[i] = pnorm((x[nx] - forecast$pred[i]) / locSD)
prob.pval[i] = pnorm(abs(x[nx+i] - forecast$pred[i]) / locSD)
}
perf.mape = perf.mape / fx
perf.mse = perf.mse / fx
perf.rmse = sqrt(perf.mse)
bitmap(file='test2.png')
plot(forecast$pred, pch=19, type='b',main='ARIMA Extrapolation Forecast', ylab='Forecast and 95% CI', xlab='time',ylim=c(min(lb),max(ub)))
dum <- forecast$pred
dum[1:12] <- x[(nx+1):lx]
lines(dum, lty=1)
lines(ub,lty=3)
lines(lb,lty=3)
dev.off()
load(file='createtable')
a<-table.start()
a<-table.row.start(a)
a<-table.element(a,'Univariate ARIMA Extrapolation Forecast',9,TRUE)
a<-table.row.end(a)
a<-table.row.start(a)
a<-table.element(a,'time',1,header=TRUE)
a<-table.element(a,'Y[t]',1,header=TRUE)
a<-table.element(a,'F[t]',1,header=TRUE)
a<-table.element(a,'95% LB',1,header=TRUE)
a<-table.element(a,'95% UB',1,header=TRUE)
a<-table.element(a,'p-value
(H0: Y[t] = F[t])',1,header=TRUE)
a<-table.element(a,'P(F[t]>Y[t-1])',1,header=TRUE)
a<-table.element(a,'P(F[t]>Y[t-s])',1,header=TRUE)
mylab <- paste('P(F[t]>Y[',nx,sep='')
mylab <- paste(mylab,'])',sep='')
a<-table.element(a,mylab,1,header=TRUE)
a<-table.row.end(a)
for (i in (nx-par5):nx) {
a<-table.row.start(a)
a<-table.element(a,i,header=TRUE)
a<-table.element(a,x[i])
a<-table.element(a,'-')
a<-table.row.end(a)
}
for (i in 1:fx) {
a<-table.row.start(a)
a<-table.element(a,nx+i,header=TRUE)
a<-table.element(a,round(x[nx+i],4))
a<-table.element(a,round(forecast$pred[i],4))
a<-table.element(a,round(lb[i],4))
a<-table.element(a,round(ub[i],4))
a<-table.element(a,round((1-prob.pval[i]),4))
a<-table.element(a,round((1-prob.dec[i]),4))
a<-table.element(a,round((1-prob.sdec[i]),4))
a<-table.element(a,round((1-prob.ldec[i]),4))
a<-table.row.end(a)
}
a<-table.end(a)
table.save(a,file='mytable.tab')
a<-table.start()
a<-table.row.start(a)
a<-table.element(a,'Univariate ARIMA Extrapolation Forecast Performance',7,TRUE)
a<-table.row.end(a)
a<-table.row.start(a)
a<-table.element(a,'time',1,header=TRUE)
a<-table.element(a,'% S.E.',1,header=TRUE)
a<-table.element(a,'PE',1,header=TRUE)
a<-table.element(a,'MAPE',1,header=TRUE)
a<-table.element(a,'Sq.E',1,header=TRUE)
a<-table.element(a,'MSE',1,header=TRUE)
a<-table.element(a,'RMSE',1,header=TRUE)
a<-table.row.end(a)
for (i in 1:fx) {
a<-table.row.start(a)
a<-table.element(a,nx+i,header=TRUE)
a<-table.element(a,round(perc.se[i],4))
a<-table.element(a,round(perf.pe[i],4))
a<-table.element(a,round(perf.mape[i],4))
a<-table.element(a,round(perf.se[i],4))
a<-table.element(a,round(perf.mse[i],4))
a<-table.element(a,round(perf.rmse[i],4))
a<-table.row.end(a)
}
a<-table.end(a)
table.save(a,file='mytable1.tab')