Free Statistics

of Irreproducible Research!

Author's title

Author*The author of this computation has been verified*
R Software Modulerwasp_arimaforecasting.wasp
Title produced by softwareARIMA Forecasting
Date of computationTue, 16 Dec 2008 17:30:49 -0700
Cite this page as followsStatistical Computations at FreeStatistics.org, Office for Research Development and Education, URL https://freestatistics.org/blog/index.php?v=date/2008/Dec/17/t1229473916g3ol4feu0te49ec.htm/, Retrieved Sun, 19 May 2024 00:53:29 +0000
Statistical Computations at FreeStatistics.org, Office for Research Development and Education, URL https://freestatistics.org/blog/index.php?pk=34254, Retrieved Sun, 19 May 2024 00:53:29 +0000
QR Codes:

Original text written by user:
IsPrivate?No (this computation is public)
User-defined keywords
Estimated Impact224
Family? (F = Feedback message, R = changed R code, M = changed R Module, P = changed Parameters, D = changed Data)
-     [ARIMA Forecasting] [VAC ARIMA forecas...] [2008-12-16 19:07:58] [379d6c32f73e3218fd773d79e4063d07]
-       [ARIMA Forecasting] [ARIMA] [2008-12-16 23:58:39] [74be16979710d4c4e7c6647856088456]
F R PD      [ARIMA Forecasting] [Arima forecasting] [2008-12-17 00:30:49] [52d1f7c78552cd0e785e1b7a3cade101] [Current]
Feedback Forum
2008-12-17 20:47:08 [Julie Govaerts] [reply
De software gaat de voorspellingen berekenen adhv differentievergelijkingen als dit mogelijk is uiteraard.
in de eerste tabel zien we de tijdsindex staan en de voorspelde waarden = F(t) = forecast
-in kolom 2 staat de werkelijke waarde Y(t)
-in de 3e en 4e kolom staan de boven- en ondergrens van het 95% betrouwbaarheidsinterval
- de p waarde is hier soms klein dus dit betekent dat de voorspelde waarde en de werkelijke waarde significant verschillen
2008-12-17 20:52:50 [Julie Govaerts] [reply
step 2 -->
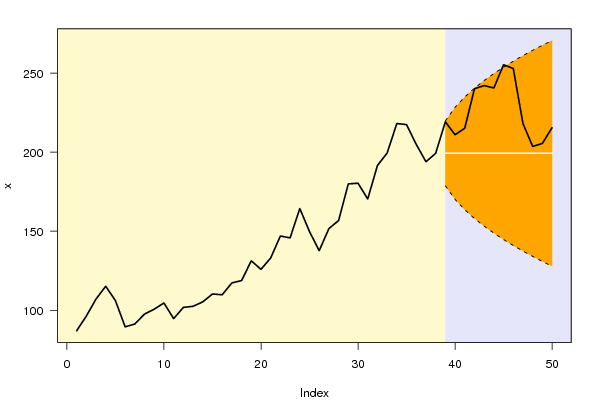
De grafiek
-1e grafiek = Het grijze gedeelte stelt de voorspelling voor
-Het donkeroranje oppervlak van deze grafiek geeft het 95%-betrouwbaarheidsinterval weer. De volle lijn is onze werkelijke waarde en de witte lijn is onze voorspelde waarde.
-2e grafiek = het laatste deel van de eerste grafiek wordt hier uitvergroot
-Deze toont het 95% betrouwbaarheidsinterval = de stippellijnen
-Hier is het duidelijk dat de voorspellingen (bollenlijn) lager liggen dan onze werkelijke observaties (volle lijn) = dit zagen we ook al in de tabel. De voorspellingen volgen ook niet de schommelingen (pieken en dalen) en dus de seizoenaliteit van de werkelijke observaties.

step 3 -->
-De procentuele standaardfout = obv het model = een theoretische schatting = kolom 2
-En de procentuele werkelijke fout = kolom 3
-Hoe verder we in de toekomst gaan voorspellen hoe groter de S.E. wordt, dit valt te verklaren doordat de berekening rekening houdt met alle gegevens. Dit wil zeggen dat als maand 46 wordt berekend dat er ook rekening wordt gehouden met de voorspelling van de maand 45. Maar de maand 45 is ook slechts een voorspelling dus we houden voor het berekenen van de maand 46 rekening met de voorafgaande voorspellingen en de gegeven tijdsreeks. Daardoor is de verwachte voorspellingsfout een stijgend gegeven in de tijd.

2008-12-18 15:52:24 [Natalie De Wilde] [reply
De eerste kolom geeft de tijdsindex weer. De kolom met Y(t) geeft de werkelijke waarde weer, de kolom F(t) geeft de voorspelde waarde weer. De derde en vierde kolom geven de onder- en bovengrens aan van het 95% betrouwbaarheidsinterval.
De p-waarde is hier soms groter en soms kleiner dan 0,05.
2008-12-18 15:56:39 [Natalie De Wilde] [reply
Step 2: In de eerste grafiek stelt het grijze gebied de laatste 12 perioden weer. In de tweede grafiek worden deze 12 maanden uitvergroot. Er wordt de werkelijke waarde en de voorspelde waarde weergegeven. De werkelijke waarden liggen inderdaad juist binnen het betrouwbaarheidsinterval. Wat hier wel zeer opvallend is, is dat de voorspelling een horizontale lijn is, terwijl de werkelijke waarden toch duidelijk op en neer gaat. Dit is toch een groot verschil.
2008-12-18 15:59:28 [Natalie De Wilde] [reply
Step 3: waar de hoogste procentuele standaardfout is, vinden we de kleinste p-waarden terug. Hoe verder in de tijd, hoe groter de procentuele standaardfout is. Dit is logisch, hoe verder in de toekomst hoe moeilijker de voorspelling wordt. Je had nog wel wat meer uitleg mogen geven.
2008-12-18 16:00:47 [Natalie De Wilde] [reply
Step 4 en 5: slechts zeer kort besproken. Onvoldoende.
2008-12-23 15:10:12 [Annemiek Hoofman] [reply
Stap 4:
In de 7de kolom wordt de waarschijnlijkheid weergegeven dat aantoont dat er een stijging is t.o.v. de vorige maand. Vb: voor maand 40 is het zo dat er 8.96% is kans dat deze waarde hoger zal liggen dan maand 39.
Terwijl er in kolom 8 een waarschijnlijkheid is dat de waarde groter is dan exact 1 jaar geleden (12m). Zo zal de waarde van maand 50 7.04% hoger liggen dan exact 1 jaar geleden, dan maand 38.
In de 9de wordt dan de waarschijnlijkheid aangetoond dat de waarde groter is dan de laatst gekende maand (hier: maand 38). Voor iedere maand bestaat er 50% kans dat deze groter zal zijn dan de waarde van maand 38.

Post a new message
Dataseries X:
87
96.3
107.1
115.2
106.1
89.5
91.3
97.6
100.7
104.6
94.7
101.8
102.5
105.3
110.3
109.8
117.3
118.8
131.3
125.9
133.1
147
145.8
164.4
149.8
137.7
151.7
156.8
180
180.4
170.4
191.6
199.5
218.2
217.5
205
194
199.3
219.3
211.1
215.2
240.2
242.2
240.7
255.4
253
218.2
203.7
205.6
215.6


Summary of computational transaction
Raw Inputview raw input (R code)
Raw Outputview raw output of R engine
Computing time8 seconds
R Server'George Udny Yule' @ 72.249.76.132

\begin{tabular}{lllllllll}
\hline
Summary of computational transaction \tabularnewline
Raw Input & view raw input (R code)  \tabularnewline
Raw Output & view raw output of R engine  \tabularnewline
Computing time & 8 seconds \tabularnewline
R Server & 'George Udny Yule' @ 72.249.76.132 \tabularnewline
\hline
\end{tabular}
%Source: https://freestatistics.org/blog/index.php?pk=34254&T=0

[TABLE]
[ROW][C]Summary of computational transaction[/C][/ROW]
[ROW][C]Raw Input[/C][C]view raw input (R code) [/C][/ROW]
[ROW][C]Raw Output[/C][C]view raw output of R engine [/C][/ROW]
[ROW][C]Computing time[/C][C]8 seconds[/C][/ROW]
[ROW][C]R Server[/C][C]'George Udny Yule' @ 72.249.76.132[/C][/ROW]
[/TABLE]
Source: https://freestatistics.org/blog/index.php?pk=34254&T=0

Globally Unique Identifier (entire table): ba.freestatistics.org/blog/index.php?pk=34254&T=0

As an alternative you can also use a QR Code:  

The GUIDs for individual cells are displayed in the table below:

Summary of computational transaction
Raw Inputview raw input (R code)
Raw Outputview raw output of R engine
Computing time8 seconds
R Server'George Udny Yule' @ 72.249.76.132


Univariate ARIMA Extrapolation Forecast
timeY[t]F[t]95% LB95% UBp-value(H0: Y[t] = F[t])P(F[t]>Y[t-1])P(F[t]>Y[t-s])P(F[t]>Y[38])
34218.2-------
35217.5-------
36205-------
37194-------
38199.3-------
39219.3199.3178.6663219.93370.02870.50.04190.5
40211.1199.3170.1195228.48050.2140.08960.35090.5
41215.2199.3163.5614235.03860.19160.25880.61430.5
42240.2199.3158.0326240.56740.0260.22510.50.5
43242.2199.3153.1616245.43840.03420.04120.19780.5
44240.7199.3148.7579249.84210.05420.04810.32360.5
45255.4199.3144.7083253.89170.0220.06860.2840.5
46253199.3140.9391257.66090.03570.02980.08480.5
47218.2199.3137.3989261.20110.27480.04450.08720.5
48203.7199.3134.0505264.54950.44740.28510.10680.5
49205.6199.3130.8657267.73430.42840.44990.05410.5
50215.6199.3127.8227270.77730.32740.43140.07040.5

\begin{tabular}{lllllllll}
\hline
Univariate ARIMA Extrapolation Forecast \tabularnewline
time & Y[t] & F[t] & 95% LB & 95% UB & p-value(H0: Y[t] = F[t]) & P(F[t]>Y[t-1]) & P(F[t]>Y[t-s]) & P(F[t]>Y[38]) \tabularnewline
34 & 218.2 & - & - & - & - & - & - & - \tabularnewline
35 & 217.5 & - & - & - & - & - & - & - \tabularnewline
36 & 205 & - & - & - & - & - & - & - \tabularnewline
37 & 194 & - & - & - & - & - & - & - \tabularnewline
38 & 199.3 & - & - & - & - & - & - & - \tabularnewline
39 & 219.3 & 199.3 & 178.6663 & 219.9337 & 0.0287 & 0.5 & 0.0419 & 0.5 \tabularnewline
40 & 211.1 & 199.3 & 170.1195 & 228.4805 & 0.214 & 0.0896 & 0.3509 & 0.5 \tabularnewline
41 & 215.2 & 199.3 & 163.5614 & 235.0386 & 0.1916 & 0.2588 & 0.6143 & 0.5 \tabularnewline
42 & 240.2 & 199.3 & 158.0326 & 240.5674 & 0.026 & 0.2251 & 0.5 & 0.5 \tabularnewline
43 & 242.2 & 199.3 & 153.1616 & 245.4384 & 0.0342 & 0.0412 & 0.1978 & 0.5 \tabularnewline
44 & 240.7 & 199.3 & 148.7579 & 249.8421 & 0.0542 & 0.0481 & 0.3236 & 0.5 \tabularnewline
45 & 255.4 & 199.3 & 144.7083 & 253.8917 & 0.022 & 0.0686 & 0.284 & 0.5 \tabularnewline
46 & 253 & 199.3 & 140.9391 & 257.6609 & 0.0357 & 0.0298 & 0.0848 & 0.5 \tabularnewline
47 & 218.2 & 199.3 & 137.3989 & 261.2011 & 0.2748 & 0.0445 & 0.0872 & 0.5 \tabularnewline
48 & 203.7 & 199.3 & 134.0505 & 264.5495 & 0.4474 & 0.2851 & 0.1068 & 0.5 \tabularnewline
49 & 205.6 & 199.3 & 130.8657 & 267.7343 & 0.4284 & 0.4499 & 0.0541 & 0.5 \tabularnewline
50 & 215.6 & 199.3 & 127.8227 & 270.7773 & 0.3274 & 0.4314 & 0.0704 & 0.5 \tabularnewline
\hline
\end{tabular}
%Source: https://freestatistics.org/blog/index.php?pk=34254&T=1

[TABLE]
[ROW][C]Univariate ARIMA Extrapolation Forecast[/C][/ROW]
[ROW][C]time[/C][C]Y[t][/C][C]F[t][/C][C]95% LB[/C][C]95% UB[/C][C]p-value(H0: Y[t] = F[t])[/C][C]P(F[t]>Y[t-1])[/C][C]P(F[t]>Y[t-s])[/C][C]P(F[t]>Y[38])[/C][/ROW]
[ROW][C]34[/C][C]218.2[/C][C]-[/C][C]-[/C][C]-[/C][C]-[/C][C]-[/C][C]-[/C][C]-[/C][/ROW]
[ROW][C]35[/C][C]217.5[/C][C]-[/C][C]-[/C][C]-[/C][C]-[/C][C]-[/C][C]-[/C][C]-[/C][/ROW]
[ROW][C]36[/C][C]205[/C][C]-[/C][C]-[/C][C]-[/C][C]-[/C][C]-[/C][C]-[/C][C]-[/C][/ROW]
[ROW][C]37[/C][C]194[/C][C]-[/C][C]-[/C][C]-[/C][C]-[/C][C]-[/C][C]-[/C][C]-[/C][/ROW]
[ROW][C]38[/C][C]199.3[/C][C]-[/C][C]-[/C][C]-[/C][C]-[/C][C]-[/C][C]-[/C][C]-[/C][/ROW]
[ROW][C]39[/C][C]219.3[/C][C]199.3[/C][C]178.6663[/C][C]219.9337[/C][C]0.0287[/C][C]0.5[/C][C]0.0419[/C][C]0.5[/C][/ROW]
[ROW][C]40[/C][C]211.1[/C][C]199.3[/C][C]170.1195[/C][C]228.4805[/C][C]0.214[/C][C]0.0896[/C][C]0.3509[/C][C]0.5[/C][/ROW]
[ROW][C]41[/C][C]215.2[/C][C]199.3[/C][C]163.5614[/C][C]235.0386[/C][C]0.1916[/C][C]0.2588[/C][C]0.6143[/C][C]0.5[/C][/ROW]
[ROW][C]42[/C][C]240.2[/C][C]199.3[/C][C]158.0326[/C][C]240.5674[/C][C]0.026[/C][C]0.2251[/C][C]0.5[/C][C]0.5[/C][/ROW]
[ROW][C]43[/C][C]242.2[/C][C]199.3[/C][C]153.1616[/C][C]245.4384[/C][C]0.0342[/C][C]0.0412[/C][C]0.1978[/C][C]0.5[/C][/ROW]
[ROW][C]44[/C][C]240.7[/C][C]199.3[/C][C]148.7579[/C][C]249.8421[/C][C]0.0542[/C][C]0.0481[/C][C]0.3236[/C][C]0.5[/C][/ROW]
[ROW][C]45[/C][C]255.4[/C][C]199.3[/C][C]144.7083[/C][C]253.8917[/C][C]0.022[/C][C]0.0686[/C][C]0.284[/C][C]0.5[/C][/ROW]
[ROW][C]46[/C][C]253[/C][C]199.3[/C][C]140.9391[/C][C]257.6609[/C][C]0.0357[/C][C]0.0298[/C][C]0.0848[/C][C]0.5[/C][/ROW]
[ROW][C]47[/C][C]218.2[/C][C]199.3[/C][C]137.3989[/C][C]261.2011[/C][C]0.2748[/C][C]0.0445[/C][C]0.0872[/C][C]0.5[/C][/ROW]
[ROW][C]48[/C][C]203.7[/C][C]199.3[/C][C]134.0505[/C][C]264.5495[/C][C]0.4474[/C][C]0.2851[/C][C]0.1068[/C][C]0.5[/C][/ROW]
[ROW][C]49[/C][C]205.6[/C][C]199.3[/C][C]130.8657[/C][C]267.7343[/C][C]0.4284[/C][C]0.4499[/C][C]0.0541[/C][C]0.5[/C][/ROW]
[ROW][C]50[/C][C]215.6[/C][C]199.3[/C][C]127.8227[/C][C]270.7773[/C][C]0.3274[/C][C]0.4314[/C][C]0.0704[/C][C]0.5[/C][/ROW]
[/TABLE]
Source: https://freestatistics.org/blog/index.php?pk=34254&T=1

Globally Unique Identifier (entire table): ba.freestatistics.org/blog/index.php?pk=34254&T=1

As an alternative you can also use a QR Code:  

The GUIDs for individual cells are displayed in the table below:

Univariate ARIMA Extrapolation Forecast
timeY[t]F[t]95% LB95% UBp-value(H0: Y[t] = F[t])P(F[t]>Y[t-1])P(F[t]>Y[t-s])P(F[t]>Y[38])
34218.2-------
35217.5-------
36205-------
37194-------
38199.3-------
39219.3199.3178.6663219.93370.02870.50.04190.5
40211.1199.3170.1195228.48050.2140.08960.35090.5
41215.2199.3163.5614235.03860.19160.25880.61430.5
42240.2199.3158.0326240.56740.0260.22510.50.5
43242.2199.3153.1616245.43840.03420.04120.19780.5
44240.7199.3148.7579249.84210.05420.04810.32360.5
45255.4199.3144.7083253.89170.0220.06860.2840.5
46253199.3140.9391257.66090.03570.02980.08480.5
47218.2199.3137.3989261.20110.27480.04450.08720.5
48203.7199.3134.0505264.54950.44740.28510.10680.5
49205.6199.3130.8657267.73430.42840.44990.05410.5
50215.6199.3127.8227270.77730.32740.43140.07040.5


Univariate ARIMA Extrapolation Forecast Performance
time% S.E.PEMAPESq.EMSERMSE
390.05280.10040.008440033.33335.7735
400.07470.05920.0049139.2411.60333.4064
410.09150.07980.0066252.8121.06754.5899
420.10560.20520.01711672.81139.400811.8068
430.11810.21530.01791840.41153.367512.3842
440.12940.20770.01731713.96142.8311.9512
450.13980.28150.02353147.21262.267516.1947
460.14940.26940.02252883.69240.307515.5019
470.15850.09480.0079357.2129.76755.456
480.1670.02210.001819.361.61331.2702
490.17520.03160.002639.693.30751.8187
500.1830.08180.0068265.6922.14084.7054

\begin{tabular}{lllllllll}
\hline
Univariate ARIMA Extrapolation Forecast Performance \tabularnewline
time & % S.E. & PE & MAPE & Sq.E & MSE & RMSE \tabularnewline
39 & 0.0528 & 0.1004 & 0.0084 & 400 & 33.3333 & 5.7735 \tabularnewline
40 & 0.0747 & 0.0592 & 0.0049 & 139.24 & 11.6033 & 3.4064 \tabularnewline
41 & 0.0915 & 0.0798 & 0.0066 & 252.81 & 21.0675 & 4.5899 \tabularnewline
42 & 0.1056 & 0.2052 & 0.0171 & 1672.81 & 139.4008 & 11.8068 \tabularnewline
43 & 0.1181 & 0.2153 & 0.0179 & 1840.41 & 153.3675 & 12.3842 \tabularnewline
44 & 0.1294 & 0.2077 & 0.0173 & 1713.96 & 142.83 & 11.9512 \tabularnewline
45 & 0.1398 & 0.2815 & 0.0235 & 3147.21 & 262.2675 & 16.1947 \tabularnewline
46 & 0.1494 & 0.2694 & 0.0225 & 2883.69 & 240.3075 & 15.5019 \tabularnewline
47 & 0.1585 & 0.0948 & 0.0079 & 357.21 & 29.7675 & 5.456 \tabularnewline
48 & 0.167 & 0.0221 & 0.0018 & 19.36 & 1.6133 & 1.2702 \tabularnewline
49 & 0.1752 & 0.0316 & 0.0026 & 39.69 & 3.3075 & 1.8187 \tabularnewline
50 & 0.183 & 0.0818 & 0.0068 & 265.69 & 22.1408 & 4.7054 \tabularnewline
\hline
\end{tabular}
%Source: https://freestatistics.org/blog/index.php?pk=34254&T=2

[TABLE]
[ROW][C]Univariate ARIMA Extrapolation Forecast Performance[/C][/ROW]
[ROW][C]time[/C][C]% S.E.[/C][C]PE[/C][C]MAPE[/C][C]Sq.E[/C][C]MSE[/C][C]RMSE[/C][/ROW]
[ROW][C]39[/C][C]0.0528[/C][C]0.1004[/C][C]0.0084[/C][C]400[/C][C]33.3333[/C][C]5.7735[/C][/ROW]
[ROW][C]40[/C][C]0.0747[/C][C]0.0592[/C][C]0.0049[/C][C]139.24[/C][C]11.6033[/C][C]3.4064[/C][/ROW]
[ROW][C]41[/C][C]0.0915[/C][C]0.0798[/C][C]0.0066[/C][C]252.81[/C][C]21.0675[/C][C]4.5899[/C][/ROW]
[ROW][C]42[/C][C]0.1056[/C][C]0.2052[/C][C]0.0171[/C][C]1672.81[/C][C]139.4008[/C][C]11.8068[/C][/ROW]
[ROW][C]43[/C][C]0.1181[/C][C]0.2153[/C][C]0.0179[/C][C]1840.41[/C][C]153.3675[/C][C]12.3842[/C][/ROW]
[ROW][C]44[/C][C]0.1294[/C][C]0.2077[/C][C]0.0173[/C][C]1713.96[/C][C]142.83[/C][C]11.9512[/C][/ROW]
[ROW][C]45[/C][C]0.1398[/C][C]0.2815[/C][C]0.0235[/C][C]3147.21[/C][C]262.2675[/C][C]16.1947[/C][/ROW]
[ROW][C]46[/C][C]0.1494[/C][C]0.2694[/C][C]0.0225[/C][C]2883.69[/C][C]240.3075[/C][C]15.5019[/C][/ROW]
[ROW][C]47[/C][C]0.1585[/C][C]0.0948[/C][C]0.0079[/C][C]357.21[/C][C]29.7675[/C][C]5.456[/C][/ROW]
[ROW][C]48[/C][C]0.167[/C][C]0.0221[/C][C]0.0018[/C][C]19.36[/C][C]1.6133[/C][C]1.2702[/C][/ROW]
[ROW][C]49[/C][C]0.1752[/C][C]0.0316[/C][C]0.0026[/C][C]39.69[/C][C]3.3075[/C][C]1.8187[/C][/ROW]
[ROW][C]50[/C][C]0.183[/C][C]0.0818[/C][C]0.0068[/C][C]265.69[/C][C]22.1408[/C][C]4.7054[/C][/ROW]
[/TABLE]
Source: https://freestatistics.org/blog/index.php?pk=34254&T=2

Globally Unique Identifier (entire table): ba.freestatistics.org/blog/index.php?pk=34254&T=2

As an alternative you can also use a QR Code:  

The GUIDs for individual cells are displayed in the table below:

Univariate ARIMA Extrapolation Forecast Performance
time% S.E.PEMAPESq.EMSERMSE
390.05280.10040.008440033.33335.7735
400.07470.05920.0049139.2411.60333.4064
410.09150.07980.0066252.8121.06754.5899
420.10560.20520.01711672.81139.400811.8068
430.11810.21530.01791840.41153.367512.3842
440.12940.20770.01731713.96142.8311.9512
450.13980.28150.02353147.21262.267516.1947
460.14940.26940.02252883.69240.307515.5019
470.15850.09480.0079357.2129.76755.456
480.1670.02210.001819.361.61331.2702
490.17520.03160.002639.693.30751.8187
500.1830.08180.0068265.6922.14084.7054


Parameters (Session):
par1 = 12 ; par2 = 1 ; par3 = 1 ; par4 = 0 ; par5 = 4 ; par6 = 0 ; par7 = 0 ; par8 = 0 ; par9 = 0 ; par10 = FALSE ;
Parameters (R input):
par1 = 12 ; par2 = 1 ; par3 = 1 ; par4 = 0 ; par5 = 4 ; par6 = 0 ; par7 = 0 ; par8 = 0 ; par9 = 0 ; par10 = FALSE ;
R code (references can be found in the software module):
par1 <- as.numeric(par1) #cut off periods
par2 <- as.numeric(par2) #lambda
par3 <- as.numeric(par3) #degree of non-seasonal differencing
par4 <- as.numeric(par4) #degree of seasonal differencing
par5 <- as.numeric(par5) #seasonal period
par6 <- as.numeric(par6) #p
par7 <- as.numeric(par7) #q
par8 <- as.numeric(par8) #P
par9 <- as.numeric(par9) #Q
if (par10 == 'TRUE') par10 <- TRUE
if (par10 == 'FALSE') par10 <- FALSE
if (par2 == 0) x <- log(x)
if (par2 != 0) x <- x^par2
lx <- length(x)
first <- lx - 2*par1
nx <- lx - par1
nx1 <- nx + 1
fx <- lx - nx
if (fx < 1) {
fx <- par5
nx1 <- lx + fx - 1
first <- lx - 2*fx
}
first <- 1
if (fx < 3) fx <- round(lx/10,0)
(arima.out <- arima(x[1:nx], order=c(par6,par3,par7), seasonal=list(order=c(par8,par4,par9), period=par5), include.mean=par10, method='ML'))
(forecast <- predict(arima.out,fx))
(lb <- forecast$pred - 1.96 * forecast$se)
(ub <- forecast$pred + 1.96 * forecast$se)
if (par2 == 0) {
x <- exp(x)
forecast$pred <- exp(forecast$pred)
lb <- exp(lb)
ub <- exp(ub)
}
if (par2 != 0) {
x <- x^(1/par2)
forecast$pred <- forecast$pred^(1/par2)
lb <- lb^(1/par2)
ub <- ub^(1/par2)
}
if (par2 < 0) {
olb <- lb
lb <- ub
ub <- olb
}
(actandfor <- c(x[1:nx], forecast$pred))
(perc.se <- (ub-forecast$pred)/1.96/forecast$pred)
bitmap(file='test1.png')
opar <- par(mar=c(4,4,2,2),las=1)
ylim <- c( min(x[first:nx],lb), max(x[first:nx],ub))
plot(x,ylim=ylim,type='n',xlim=c(first,lx))
usr <- par('usr')
rect(usr[1],usr[3],nx+1,usr[4],border=NA,col='lemonchiffon')
rect(nx1,usr[3],usr[2],usr[4],border=NA,col='lavender')
abline(h= (-3:3)*2 , col ='gray', lty =3)
polygon( c(nx1:lx,lx:nx1), c(lb,rev(ub)), col = 'orange', lty=2,border=NA)
lines(nx1:lx, lb , lty=2)
lines(nx1:lx, ub , lty=2)
lines(x, lwd=2)
lines(nx1:lx, forecast$pred , lwd=2 , col ='white')
box()
par(opar)
dev.off()
prob.dec <- array(NA, dim=fx)
prob.sdec <- array(NA, dim=fx)
prob.ldec <- array(NA, dim=fx)
prob.pval <- array(NA, dim=fx)
perf.pe <- array(0, dim=fx)
perf.mape <- array(0, dim=fx)
perf.se <- array(0, dim=fx)
perf.mse <- array(0, dim=fx)
perf.rmse <- array(0, dim=fx)
for (i in 1:fx) {
locSD <- (ub[i] - forecast$pred[i]) / 1.96
perf.pe[i] = (x[nx+i] - forecast$pred[i]) / forecast$pred[i]
perf.mape[i] = perf.mape[i] + abs(perf.pe[i])
perf.se[i] = (x[nx+i] - forecast$pred[i])^2
perf.mse[i] = perf.mse[i] + perf.se[i]
prob.dec[i] = pnorm((x[nx+i-1] - forecast$pred[i]) / locSD)
prob.sdec[i] = pnorm((x[nx+i-par5] - forecast$pred[i]) / locSD)
prob.ldec[i] = pnorm((x[nx] - forecast$pred[i]) / locSD)
prob.pval[i] = pnorm(abs(x[nx+i] - forecast$pred[i]) / locSD)
}
perf.mape = perf.mape / fx
perf.mse = perf.mse / fx
perf.rmse = sqrt(perf.mse)
bitmap(file='test2.png')
plot(forecast$pred, pch=19, type='b',main='ARIMA Extrapolation Forecast', ylab='Forecast and 95% CI', xlab='time',ylim=c(min(lb),max(ub)))
dum <- forecast$pred
dum[1:12] <- x[(nx+1):lx]
lines(dum, lty=1)
lines(ub,lty=3)
lines(lb,lty=3)
dev.off()
load(file='createtable')
a<-table.start()
a<-table.row.start(a)
a<-table.element(a,'Univariate ARIMA Extrapolation Forecast',9,TRUE)
a<-table.row.end(a)
a<-table.row.start(a)
a<-table.element(a,'time',1,header=TRUE)
a<-table.element(a,'Y[t]',1,header=TRUE)
a<-table.element(a,'F[t]',1,header=TRUE)
a<-table.element(a,'95% LB',1,header=TRUE)
a<-table.element(a,'95% UB',1,header=TRUE)
a<-table.element(a,'p-value
(H0: Y[t] = F[t])',1,header=TRUE)
a<-table.element(a,'P(F[t]>Y[t-1])',1,header=TRUE)
a<-table.element(a,'P(F[t]>Y[t-s])',1,header=TRUE)
mylab <- paste('P(F[t]>Y[',nx,sep='')
mylab <- paste(mylab,'])',sep='')
a<-table.element(a,mylab,1,header=TRUE)
a<-table.row.end(a)
for (i in (nx-par5):nx) {
a<-table.row.start(a)
a<-table.element(a,i,header=TRUE)
a<-table.element(a,x[i])
a<-table.element(a,'-')
a<-table.row.end(a)
}
for (i in 1:fx) {
a<-table.row.start(a)
a<-table.element(a,nx+i,header=TRUE)
a<-table.element(a,round(x[nx+i],4))
a<-table.element(a,round(forecast$pred[i],4))
a<-table.element(a,round(lb[i],4))
a<-table.element(a,round(ub[i],4))
a<-table.element(a,round((1-prob.pval[i]),4))
a<-table.element(a,round((1-prob.dec[i]),4))
a<-table.element(a,round((1-prob.sdec[i]),4))
a<-table.element(a,round((1-prob.ldec[i]),4))
a<-table.row.end(a)
}
a<-table.end(a)
table.save(a,file='mytable.tab')
a<-table.start()
a<-table.row.start(a)
a<-table.element(a,'Univariate ARIMA Extrapolation Forecast Performance',7,TRUE)
a<-table.row.end(a)
a<-table.row.start(a)
a<-table.element(a,'time',1,header=TRUE)
a<-table.element(a,'% S.E.',1,header=TRUE)
a<-table.element(a,'PE',1,header=TRUE)
a<-table.element(a,'MAPE',1,header=TRUE)
a<-table.element(a,'Sq.E',1,header=TRUE)
a<-table.element(a,'MSE',1,header=TRUE)
a<-table.element(a,'RMSE',1,header=TRUE)
a<-table.row.end(a)
for (i in 1:fx) {
a<-table.row.start(a)
a<-table.element(a,nx+i,header=TRUE)
a<-table.element(a,round(perc.se[i],4))
a<-table.element(a,round(perf.pe[i],4))
a<-table.element(a,round(perf.mape[i],4))
a<-table.element(a,round(perf.se[i],4))
a<-table.element(a,round(perf.mse[i],4))
a<-table.element(a,round(perf.rmse[i],4))
a<-table.row.end(a)
}
a<-table.end(a)
table.save(a,file='mytable1.tab')