Free Statistics

of Irreproducible Research!

Author's title

Author*The author of this computation has been verified*
R Software Modulerwasp_arimaforecasting.wasp
Title produced by softwareARIMA Forecasting
Date of computationTue, 16 Dec 2008 20:10:23 -0700
Cite this page as followsStatistical Computations at FreeStatistics.org, Office for Research Development and Education, URL https://freestatistics.org/blog/index.php?v=date/2008/Dec/17/t1229483568th1egmf4x674c17.htm/, Retrieved Sun, 19 May 2024 00:03:37 +0000
Statistical Computations at FreeStatistics.org, Office for Research Development and Education, URL https://freestatistics.org/blog/index.php?pk=34255, Retrieved Sun, 19 May 2024 00:03:37 +0000
QR Codes:

Original text written by user:
IsPrivate?No (this computation is public)
User-defined keywords
Estimated Impact217
Family? (F = Feedback message, R = changed R code, M = changed R Module, P = changed Parameters, D = changed Data)
-     [ARIMA Backward Selection] [Step 5 Eigen tijd...] [2008-12-10 01:30:15] [2e47c012a41b5d00849693def6142119]
F RMP   [ARIMA Forecasting] [Arima forecasting...] [2008-12-16 23:21:15] [7a4703cb85a198d9845d72899eff0288]
F           [ARIMA Forecasting] [] [2008-12-17 03:10:23] [52492148dbcac26917ed19e489351f79] [Current]
Feedback Forum
2008-12-18 11:02:31 [Loïque Verhasselt] [reply
Stap 1 : De student geeft alle output mooi weer en geeft een duidelijke interpretatie van de eerste tabel. De p-waarde moet groter zijn dan 0,05 (hoe groter, hoe beter zelfs), want dan is er geen significant verschil tussen de werkelijke waarden en de voorspelde waarden wat betekent dat de voorspelling goed zijn. We krijgen overal te zien,buiten de eerste maand, dat alle werkelijke waarden niet significant verschillen met de voorspelde waarden wat dus een goed model weergeeft. We zien duidelijk geen vorm van explosiviteit in de voorspelling dus we hebben hier te maken met 'brave' ARMA processen.
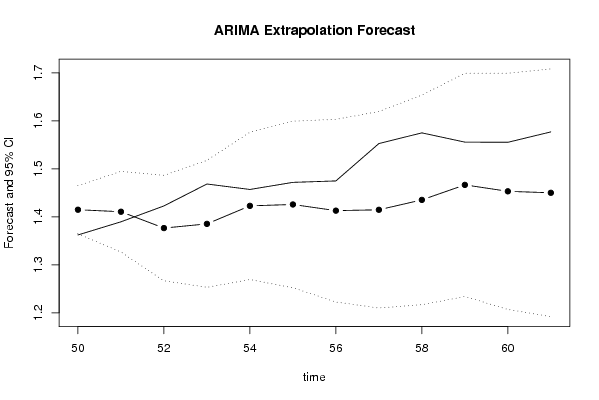
Stap 2 : Niet opgelost door de student. We kunnen in onze werkelijke waarden geen vorm van seizoenaliteit waarnemen dus ook niet in onze voorspelling. We zien aan de voorspelde waarden wel een langzaam stijgende trend die ook aanwezig is in de werkelijke waarden. We kunnen dus besluiten dat de voorspelde waarden de trends van de oorspronkelijke tijdreeks goed overnemen! We zien geen economische trend in de voorspelde waarden!
Stap 3 : De % SE is de theoretische schatting van de gemaakte fout. Ook zien we de werkelijke fout door de voorspelde en de werkelijke waarde met elkaar te vergelijken.(=PE) De rest van de kolommen is niet belangrijk voor dit onderdeel.De Standaardfout moet steeds groter zijn dan de werkelijke fout in % van absolute waarde (PE). Als de PE groter als de SE wat betekent dat we niet goed voorspellingen kunnen maken.
Step 4: Niet opgelost.Het was hier de bedoeling om de kansen (p-waarden) van de verschillende kolommen van de eerste tabel te interpreteren. We zien dat de voorspelde waarneming groter is dan de echte waarneming van één periode geleden. Maar dit in een dalende trend. De eerste kans is zeer groot en voor de volgende maanden zakt deze.De kans dat de voorspelde waarde groter is dan de werkelijke waarde vorig jaar is overal zeer groot! De kans dat de voorspelde waarde groter is dan de laatst gekende werkelijke waarde is ook zeer groot . Er is dus een grote kans op stijging !
Stap 5: Zowel de voorspelde waarde als de werkelijke waarde bevinden zich binnen het betrouwbaarheids interval. Dit is al 1 goede zaak. We zien wel dat de voorspelde waarde afwijkt van de werkelijke maar niet extreem. Geen extreme afwijkingen duiden op een goed model. Dit hadden we ook al kunnen afleiden aan de tabel van de output.

Post a new message
Dataseries X:
1.1372
1.1139
1.1222
1.1692
1.1702
1.2286
1.2613
1.2646
1.2262
1.1985
1.2007
1.2138
1.2266
1.2176
1.2218
1.249
1.2991
1.3408
1.3119
1.3014
1.3201
1.2938
1.2694
1.2165
1.2037
1.2292
1.2256
1.2015
1.1786
1.1856
1.2103
1.1938
1.202
1.2271
1.277
1.265
1.2684
1.2811
1.2727
1.2611
1.2881
1.3213
1.2999
1.3074
1.3242
1.3516
1.3511
1.3419
1.3716
1.3622
1.3896
1.4227
1.4684
1.457
1.4718
1.4748
1.5527
1.575
1.5557
1.5553
1.577


Summary of computational transaction
Raw Inputview raw input (R code)
Raw Outputview raw output of R engine
Computing time13 seconds
R Server'Herman Ole Andreas Wold' @ 193.190.124.10:1001

\begin{tabular}{lllllllll}
\hline
Summary of computational transaction \tabularnewline
Raw Input & view raw input (R code)  \tabularnewline
Raw Output & view raw output of R engine  \tabularnewline
Computing time & 13 seconds \tabularnewline
R Server & 'Herman Ole Andreas Wold' @ 193.190.124.10:1001 \tabularnewline
\hline
\end{tabular}
%Source: https://freestatistics.org/blog/index.php?pk=34255&T=0

[TABLE]
[ROW][C]Summary of computational transaction[/C][/ROW]
[ROW][C]Raw Input[/C][C]view raw input (R code) [/C][/ROW]
[ROW][C]Raw Output[/C][C]view raw output of R engine [/C][/ROW]
[ROW][C]Computing time[/C][C]13 seconds[/C][/ROW]
[ROW][C]R Server[/C][C]'Herman Ole Andreas Wold' @ 193.190.124.10:1001[/C][/ROW]
[/TABLE]
Source: https://freestatistics.org/blog/index.php?pk=34255&T=0

Globally Unique Identifier (entire table): ba.freestatistics.org/blog/index.php?pk=34255&T=0

As an alternative you can also use a QR Code:  

The GUIDs for individual cells are displayed in the table below:

Summary of computational transaction
Raw Inputview raw input (R code)
Raw Outputview raw output of R engine
Computing time13 seconds
R Server'Herman Ole Andreas Wold' @ 193.190.124.10:1001


Univariate ARIMA Extrapolation Forecast
timeY[t]F[t]95% LB95% UBp-value(H0: Y[t] = F[t])P(F[t]>Y[t-1])P(F[t]>Y[t-s])P(F[t]>Y[49])
371.2684-------
381.2811-------
391.2727-------
401.2611-------
411.2881-------
421.3213-------
431.2999-------
441.3074-------
451.3242-------
461.3516-------
471.3511-------
481.3419-------
491.3716-------
501.36221.41481.36471.46490.01990.954410.9544
511.38961.41061.32661.49460.31230.87050.99940.8184
521.42271.37651.26661.48650.20540.4080.98020.5351
531.46841.38531.2531.51750.1090.28950.9250.5802
541.4571.42281.26921.57640.33130.28040.90230.7432
551.47181.42571.25221.59930.30140.3620.92240.7295
561.47481.41281.22241.60330.26180.2720.86110.6644
571.55271.41461.20991.61940.09310.28230.80670.6598
581.5751.43531.21681.65370.1050.1460.77360.7161
591.55571.46661.2341.69920.22630.18040.83470.7882
601.55531.45311.20691.69930.2080.20710.8120.7418
611.5771.451.19191.70820.16750.21210.72430.7243

\begin{tabular}{lllllllll}
\hline
Univariate ARIMA Extrapolation Forecast \tabularnewline
time & Y[t] & F[t] & 95% LB & 95% UB & p-value(H0: Y[t] = F[t]) & P(F[t]>Y[t-1]) & P(F[t]>Y[t-s]) & P(F[t]>Y[49]) \tabularnewline
37 & 1.2684 & - & - & - & - & - & - & - \tabularnewline
38 & 1.2811 & - & - & - & - & - & - & - \tabularnewline
39 & 1.2727 & - & - & - & - & - & - & - \tabularnewline
40 & 1.2611 & - & - & - & - & - & - & - \tabularnewline
41 & 1.2881 & - & - & - & - & - & - & - \tabularnewline
42 & 1.3213 & - & - & - & - & - & - & - \tabularnewline
43 & 1.2999 & - & - & - & - & - & - & - \tabularnewline
44 & 1.3074 & - & - & - & - & - & - & - \tabularnewline
45 & 1.3242 & - & - & - & - & - & - & - \tabularnewline
46 & 1.3516 & - & - & - & - & - & - & - \tabularnewline
47 & 1.3511 & - & - & - & - & - & - & - \tabularnewline
48 & 1.3419 & - & - & - & - & - & - & - \tabularnewline
49 & 1.3716 & - & - & - & - & - & - & - \tabularnewline
50 & 1.3622 & 1.4148 & 1.3647 & 1.4649 & 0.0199 & 0.9544 & 1 & 0.9544 \tabularnewline
51 & 1.3896 & 1.4106 & 1.3266 & 1.4946 & 0.3123 & 0.8705 & 0.9994 & 0.8184 \tabularnewline
52 & 1.4227 & 1.3765 & 1.2666 & 1.4865 & 0.2054 & 0.408 & 0.9802 & 0.5351 \tabularnewline
53 & 1.4684 & 1.3853 & 1.253 & 1.5175 & 0.109 & 0.2895 & 0.925 & 0.5802 \tabularnewline
54 & 1.457 & 1.4228 & 1.2692 & 1.5764 & 0.3313 & 0.2804 & 0.9023 & 0.7432 \tabularnewline
55 & 1.4718 & 1.4257 & 1.2522 & 1.5993 & 0.3014 & 0.362 & 0.9224 & 0.7295 \tabularnewline
56 & 1.4748 & 1.4128 & 1.2224 & 1.6033 & 0.2618 & 0.272 & 0.8611 & 0.6644 \tabularnewline
57 & 1.5527 & 1.4146 & 1.2099 & 1.6194 & 0.0931 & 0.2823 & 0.8067 & 0.6598 \tabularnewline
58 & 1.575 & 1.4353 & 1.2168 & 1.6537 & 0.105 & 0.146 & 0.7736 & 0.7161 \tabularnewline
59 & 1.5557 & 1.4666 & 1.234 & 1.6992 & 0.2263 & 0.1804 & 0.8347 & 0.7882 \tabularnewline
60 & 1.5553 & 1.4531 & 1.2069 & 1.6993 & 0.208 & 0.2071 & 0.812 & 0.7418 \tabularnewline
61 & 1.577 & 1.45 & 1.1919 & 1.7082 & 0.1675 & 0.2121 & 0.7243 & 0.7243 \tabularnewline
\hline
\end{tabular}
%Source: https://freestatistics.org/blog/index.php?pk=34255&T=1

[TABLE]
[ROW][C]Univariate ARIMA Extrapolation Forecast[/C][/ROW]
[ROW][C]time[/C][C]Y[t][/C][C]F[t][/C][C]95% LB[/C][C]95% UB[/C][C]p-value(H0: Y[t] = F[t])[/C][C]P(F[t]>Y[t-1])[/C][C]P(F[t]>Y[t-s])[/C][C]P(F[t]>Y[49])[/C][/ROW]
[ROW][C]37[/C][C]1.2684[/C][C]-[/C][C]-[/C][C]-[/C][C]-[/C][C]-[/C][C]-[/C][C]-[/C][/ROW]
[ROW][C]38[/C][C]1.2811[/C][C]-[/C][C]-[/C][C]-[/C][C]-[/C][C]-[/C][C]-[/C][C]-[/C][/ROW]
[ROW][C]39[/C][C]1.2727[/C][C]-[/C][C]-[/C][C]-[/C][C]-[/C][C]-[/C][C]-[/C][C]-[/C][/ROW]
[ROW][C]40[/C][C]1.2611[/C][C]-[/C][C]-[/C][C]-[/C][C]-[/C][C]-[/C][C]-[/C][C]-[/C][/ROW]
[ROW][C]41[/C][C]1.2881[/C][C]-[/C][C]-[/C][C]-[/C][C]-[/C][C]-[/C][C]-[/C][C]-[/C][/ROW]
[ROW][C]42[/C][C]1.3213[/C][C]-[/C][C]-[/C][C]-[/C][C]-[/C][C]-[/C][C]-[/C][C]-[/C][/ROW]
[ROW][C]43[/C][C]1.2999[/C][C]-[/C][C]-[/C][C]-[/C][C]-[/C][C]-[/C][C]-[/C][C]-[/C][/ROW]
[ROW][C]44[/C][C]1.3074[/C][C]-[/C][C]-[/C][C]-[/C][C]-[/C][C]-[/C][C]-[/C][C]-[/C][/ROW]
[ROW][C]45[/C][C]1.3242[/C][C]-[/C][C]-[/C][C]-[/C][C]-[/C][C]-[/C][C]-[/C][C]-[/C][/ROW]
[ROW][C]46[/C][C]1.3516[/C][C]-[/C][C]-[/C][C]-[/C][C]-[/C][C]-[/C][C]-[/C][C]-[/C][/ROW]
[ROW][C]47[/C][C]1.3511[/C][C]-[/C][C]-[/C][C]-[/C][C]-[/C][C]-[/C][C]-[/C][C]-[/C][/ROW]
[ROW][C]48[/C][C]1.3419[/C][C]-[/C][C]-[/C][C]-[/C][C]-[/C][C]-[/C][C]-[/C][C]-[/C][/ROW]
[ROW][C]49[/C][C]1.3716[/C][C]-[/C][C]-[/C][C]-[/C][C]-[/C][C]-[/C][C]-[/C][C]-[/C][/ROW]
[ROW][C]50[/C][C]1.3622[/C][C]1.4148[/C][C]1.3647[/C][C]1.4649[/C][C]0.0199[/C][C]0.9544[/C][C]1[/C][C]0.9544[/C][/ROW]
[ROW][C]51[/C][C]1.3896[/C][C]1.4106[/C][C]1.3266[/C][C]1.4946[/C][C]0.3123[/C][C]0.8705[/C][C]0.9994[/C][C]0.8184[/C][/ROW]
[ROW][C]52[/C][C]1.4227[/C][C]1.3765[/C][C]1.2666[/C][C]1.4865[/C][C]0.2054[/C][C]0.408[/C][C]0.9802[/C][C]0.5351[/C][/ROW]
[ROW][C]53[/C][C]1.4684[/C][C]1.3853[/C][C]1.253[/C][C]1.5175[/C][C]0.109[/C][C]0.2895[/C][C]0.925[/C][C]0.5802[/C][/ROW]
[ROW][C]54[/C][C]1.457[/C][C]1.4228[/C][C]1.2692[/C][C]1.5764[/C][C]0.3313[/C][C]0.2804[/C][C]0.9023[/C][C]0.7432[/C][/ROW]
[ROW][C]55[/C][C]1.4718[/C][C]1.4257[/C][C]1.2522[/C][C]1.5993[/C][C]0.3014[/C][C]0.362[/C][C]0.9224[/C][C]0.7295[/C][/ROW]
[ROW][C]56[/C][C]1.4748[/C][C]1.4128[/C][C]1.2224[/C][C]1.6033[/C][C]0.2618[/C][C]0.272[/C][C]0.8611[/C][C]0.6644[/C][/ROW]
[ROW][C]57[/C][C]1.5527[/C][C]1.4146[/C][C]1.2099[/C][C]1.6194[/C][C]0.0931[/C][C]0.2823[/C][C]0.8067[/C][C]0.6598[/C][/ROW]
[ROW][C]58[/C][C]1.575[/C][C]1.4353[/C][C]1.2168[/C][C]1.6537[/C][C]0.105[/C][C]0.146[/C][C]0.7736[/C][C]0.7161[/C][/ROW]
[ROW][C]59[/C][C]1.5557[/C][C]1.4666[/C][C]1.234[/C][C]1.6992[/C][C]0.2263[/C][C]0.1804[/C][C]0.8347[/C][C]0.7882[/C][/ROW]
[ROW][C]60[/C][C]1.5553[/C][C]1.4531[/C][C]1.2069[/C][C]1.6993[/C][C]0.208[/C][C]0.2071[/C][C]0.812[/C][C]0.7418[/C][/ROW]
[ROW][C]61[/C][C]1.577[/C][C]1.45[/C][C]1.1919[/C][C]1.7082[/C][C]0.1675[/C][C]0.2121[/C][C]0.7243[/C][C]0.7243[/C][/ROW]
[/TABLE]
Source: https://freestatistics.org/blog/index.php?pk=34255&T=1

Globally Unique Identifier (entire table): ba.freestatistics.org/blog/index.php?pk=34255&T=1

As an alternative you can also use a QR Code:  

The GUIDs for individual cells are displayed in the table below:

Univariate ARIMA Extrapolation Forecast
timeY[t]F[t]95% LB95% UBp-value(H0: Y[t] = F[t])P(F[t]>Y[t-1])P(F[t]>Y[t-s])P(F[t]>Y[49])
371.2684-------
381.2811-------
391.2727-------
401.2611-------
411.2881-------
421.3213-------
431.2999-------
441.3074-------
451.3242-------
461.3516-------
471.3511-------
481.3419-------
491.3716-------
501.36221.41481.36471.46490.01990.954410.9544
511.38961.41061.32661.49460.31230.87050.99940.8184
521.42271.37651.26661.48650.20540.4080.98020.5351
531.46841.38531.2531.51750.1090.28950.9250.5802
541.4571.42281.26921.57640.33130.28040.90230.7432
551.47181.42571.25221.59930.30140.3620.92240.7295
561.47481.41281.22241.60330.26180.2720.86110.6644
571.55271.41461.20991.61940.09310.28230.80670.6598
581.5751.43531.21681.65370.1050.1460.77360.7161
591.55571.46661.2341.69920.22630.18040.83470.7882
601.55531.45311.20691.69930.2080.20710.8120.7418
611.5771.451.19191.70820.16750.21210.72430.7243


Univariate ARIMA Extrapolation Forecast Performance
time% S.E.PEMAPESq.EMSERMSE
500.0181-0.03720.00310.00282e-040.0152
510.0304-0.01490.00124e-0400.0061
520.04080.03350.00280.00212e-040.0133
530.04870.060.0050.00696e-040.024
540.05510.0240.0020.00121e-040.0099
550.06210.03230.00270.00212e-040.0133
560.06880.04390.00370.00383e-040.0179
570.07380.09760.00810.01910.00160.0399
580.07770.09740.00810.01950.00160.0403
590.08090.06080.00510.00797e-040.0257
600.08640.07030.00590.01049e-040.0295
610.09080.08760.00730.01610.00130.0366

\begin{tabular}{lllllllll}
\hline
Univariate ARIMA Extrapolation Forecast Performance \tabularnewline
time & % S.E. & PE & MAPE & Sq.E & MSE & RMSE \tabularnewline
50 & 0.0181 & -0.0372 & 0.0031 & 0.0028 & 2e-04 & 0.0152 \tabularnewline
51 & 0.0304 & -0.0149 & 0.0012 & 4e-04 & 0 & 0.0061 \tabularnewline
52 & 0.0408 & 0.0335 & 0.0028 & 0.0021 & 2e-04 & 0.0133 \tabularnewline
53 & 0.0487 & 0.06 & 0.005 & 0.0069 & 6e-04 & 0.024 \tabularnewline
54 & 0.0551 & 0.024 & 0.002 & 0.0012 & 1e-04 & 0.0099 \tabularnewline
55 & 0.0621 & 0.0323 & 0.0027 & 0.0021 & 2e-04 & 0.0133 \tabularnewline
56 & 0.0688 & 0.0439 & 0.0037 & 0.0038 & 3e-04 & 0.0179 \tabularnewline
57 & 0.0738 & 0.0976 & 0.0081 & 0.0191 & 0.0016 & 0.0399 \tabularnewline
58 & 0.0777 & 0.0974 & 0.0081 & 0.0195 & 0.0016 & 0.0403 \tabularnewline
59 & 0.0809 & 0.0608 & 0.0051 & 0.0079 & 7e-04 & 0.0257 \tabularnewline
60 & 0.0864 & 0.0703 & 0.0059 & 0.0104 & 9e-04 & 0.0295 \tabularnewline
61 & 0.0908 & 0.0876 & 0.0073 & 0.0161 & 0.0013 & 0.0366 \tabularnewline
\hline
\end{tabular}
%Source: https://freestatistics.org/blog/index.php?pk=34255&T=2

[TABLE]
[ROW][C]Univariate ARIMA Extrapolation Forecast Performance[/C][/ROW]
[ROW][C]time[/C][C]% S.E.[/C][C]PE[/C][C]MAPE[/C][C]Sq.E[/C][C]MSE[/C][C]RMSE[/C][/ROW]
[ROW][C]50[/C][C]0.0181[/C][C]-0.0372[/C][C]0.0031[/C][C]0.0028[/C][C]2e-04[/C][C]0.0152[/C][/ROW]
[ROW][C]51[/C][C]0.0304[/C][C]-0.0149[/C][C]0.0012[/C][C]4e-04[/C][C]0[/C][C]0.0061[/C][/ROW]
[ROW][C]52[/C][C]0.0408[/C][C]0.0335[/C][C]0.0028[/C][C]0.0021[/C][C]2e-04[/C][C]0.0133[/C][/ROW]
[ROW][C]53[/C][C]0.0487[/C][C]0.06[/C][C]0.005[/C][C]0.0069[/C][C]6e-04[/C][C]0.024[/C][/ROW]
[ROW][C]54[/C][C]0.0551[/C][C]0.024[/C][C]0.002[/C][C]0.0012[/C][C]1e-04[/C][C]0.0099[/C][/ROW]
[ROW][C]55[/C][C]0.0621[/C][C]0.0323[/C][C]0.0027[/C][C]0.0021[/C][C]2e-04[/C][C]0.0133[/C][/ROW]
[ROW][C]56[/C][C]0.0688[/C][C]0.0439[/C][C]0.0037[/C][C]0.0038[/C][C]3e-04[/C][C]0.0179[/C][/ROW]
[ROW][C]57[/C][C]0.0738[/C][C]0.0976[/C][C]0.0081[/C][C]0.0191[/C][C]0.0016[/C][C]0.0399[/C][/ROW]
[ROW][C]58[/C][C]0.0777[/C][C]0.0974[/C][C]0.0081[/C][C]0.0195[/C][C]0.0016[/C][C]0.0403[/C][/ROW]
[ROW][C]59[/C][C]0.0809[/C][C]0.0608[/C][C]0.0051[/C][C]0.0079[/C][C]7e-04[/C][C]0.0257[/C][/ROW]
[ROW][C]60[/C][C]0.0864[/C][C]0.0703[/C][C]0.0059[/C][C]0.0104[/C][C]9e-04[/C][C]0.0295[/C][/ROW]
[ROW][C]61[/C][C]0.0908[/C][C]0.0876[/C][C]0.0073[/C][C]0.0161[/C][C]0.0013[/C][C]0.0366[/C][/ROW]
[/TABLE]
Source: https://freestatistics.org/blog/index.php?pk=34255&T=2

Globally Unique Identifier (entire table): ba.freestatistics.org/blog/index.php?pk=34255&T=2

As an alternative you can also use a QR Code:  

The GUIDs for individual cells are displayed in the table below:

Univariate ARIMA Extrapolation Forecast Performance
time% S.E.PEMAPESq.EMSERMSE
500.0181-0.03720.00310.00282e-040.0152
510.0304-0.01490.00124e-0400.0061
520.04080.03350.00280.00212e-040.0133
530.04870.060.0050.00696e-040.024
540.05510.0240.0020.00121e-040.0099
550.06210.03230.00270.00212e-040.0133
560.06880.04390.00370.00383e-040.0179
570.07380.09760.00810.01910.00160.0399
580.07770.09740.00810.01950.00160.0403
590.08090.06080.00510.00797e-040.0257
600.08640.07030.00590.01049e-040.0295
610.09080.08760.00730.01610.00130.0366


Parameters (Session):
par1 = 12 ; par2 = 1 ; par3 = 1 ; par4 = 1 ; par5 = 12 ; par6 = 3 ; par7 = 2 ; par8 = 2 ; par9 = 1 ; par10 = FALSE ;
Parameters (R input):
par1 = 12 ; par2 = 1 ; par3 = 1 ; par4 = 1 ; par5 = 12 ; par6 = 3 ; par7 = 2 ; par8 = 2 ; par9 = 1 ; par10 = FALSE ; par11 = ; par12 = ; par13 = ; par14 = ; par15 = ; par16 = ; par17 = ; par18 = ; par19 = ; par20 = ;
R code (references can be found in the software module):
par1 <- as.numeric(par1) #cut off periods
par2 <- as.numeric(par2) #lambda
par3 <- as.numeric(par3) #degree of non-seasonal differencing
par4 <- as.numeric(par4) #degree of seasonal differencing
par5 <- as.numeric(par5) #seasonal period
par6 <- as.numeric(par6) #p
par7 <- as.numeric(par7) #q
par8 <- as.numeric(par8) #P
par9 <- as.numeric(par9) #Q
if (par10 == 'TRUE') par10 <- TRUE
if (par10 == 'FALSE') par10 <- FALSE
if (par2 == 0) x <- log(x)
if (par2 != 0) x <- x^par2
lx <- length(x)
first <- lx - 2*par1
nx <- lx - par1
nx1 <- nx + 1
fx <- lx - nx
if (fx < 1) {
fx <- par5
nx1 <- lx + fx - 1
first <- lx - 2*fx
}
first <- 1
if (fx < 3) fx <- round(lx/10,0)
(arima.out <- arima(x[1:nx], order=c(par6,par3,par7), seasonal=list(order=c(par8,par4,par9), period=par5), include.mean=par10, method='ML'))
(forecast <- predict(arima.out,fx))
(lb <- forecast$pred - 1.96 * forecast$se)
(ub <- forecast$pred + 1.96 * forecast$se)
if (par2 == 0) {
x <- exp(x)
forecast$pred <- exp(forecast$pred)
lb <- exp(lb)
ub <- exp(ub)
}
if (par2 != 0) {
x <- x^(1/par2)
forecast$pred <- forecast$pred^(1/par2)
lb <- lb^(1/par2)
ub <- ub^(1/par2)
}
if (par2 < 0) {
olb <- lb
lb <- ub
ub <- olb
}
(actandfor <- c(x[1:nx], forecast$pred))
(perc.se <- (ub-forecast$pred)/1.96/forecast$pred)
bitmap(file='test1.png')
opar <- par(mar=c(4,4,2,2),las=1)
ylim <- c( min(x[first:nx],lb), max(x[first:nx],ub))
plot(x,ylim=ylim,type='n',xlim=c(first,lx))
usr <- par('usr')
rect(usr[1],usr[3],nx+1,usr[4],border=NA,col='lemonchiffon')
rect(nx1,usr[3],usr[2],usr[4],border=NA,col='lavender')
abline(h= (-3:3)*2 , col ='gray', lty =3)
polygon( c(nx1:lx,lx:nx1), c(lb,rev(ub)), col = 'orange', lty=2,border=NA)
lines(nx1:lx, lb , lty=2)
lines(nx1:lx, ub , lty=2)
lines(x, lwd=2)
lines(nx1:lx, forecast$pred , lwd=2 , col ='white')
box()
par(opar)
dev.off()
prob.dec <- array(NA, dim=fx)
prob.sdec <- array(NA, dim=fx)
prob.ldec <- array(NA, dim=fx)
prob.pval <- array(NA, dim=fx)
perf.pe <- array(0, dim=fx)
perf.mape <- array(0, dim=fx)
perf.se <- array(0, dim=fx)
perf.mse <- array(0, dim=fx)
perf.rmse <- array(0, dim=fx)
for (i in 1:fx) {
locSD <- (ub[i] - forecast$pred[i]) / 1.96
perf.pe[i] = (x[nx+i] - forecast$pred[i]) / forecast$pred[i]
perf.mape[i] = perf.mape[i] + abs(perf.pe[i])
perf.se[i] = (x[nx+i] - forecast$pred[i])^2
perf.mse[i] = perf.mse[i] + perf.se[i]
prob.dec[i] = pnorm((x[nx+i-1] - forecast$pred[i]) / locSD)
prob.sdec[i] = pnorm((x[nx+i-par5] - forecast$pred[i]) / locSD)
prob.ldec[i] = pnorm((x[nx] - forecast$pred[i]) / locSD)
prob.pval[i] = pnorm(abs(x[nx+i] - forecast$pred[i]) / locSD)
}
perf.mape = perf.mape / fx
perf.mse = perf.mse / fx
perf.rmse = sqrt(perf.mse)
bitmap(file='test2.png')
plot(forecast$pred, pch=19, type='b',main='ARIMA Extrapolation Forecast', ylab='Forecast and 95% CI', xlab='time',ylim=c(min(lb),max(ub)))
dum <- forecast$pred
dum[1:12] <- x[(nx+1):lx]
lines(dum, lty=1)
lines(ub,lty=3)
lines(lb,lty=3)
dev.off()
load(file='createtable')
a<-table.start()
a<-table.row.start(a)
a<-table.element(a,'Univariate ARIMA Extrapolation Forecast',9,TRUE)
a<-table.row.end(a)
a<-table.row.start(a)
a<-table.element(a,'time',1,header=TRUE)
a<-table.element(a,'Y[t]',1,header=TRUE)
a<-table.element(a,'F[t]',1,header=TRUE)
a<-table.element(a,'95% LB',1,header=TRUE)
a<-table.element(a,'95% UB',1,header=TRUE)
a<-table.element(a,'p-value
(H0: Y[t] = F[t])',1,header=TRUE)
a<-table.element(a,'P(F[t]>Y[t-1])',1,header=TRUE)
a<-table.element(a,'P(F[t]>Y[t-s])',1,header=TRUE)
mylab <- paste('P(F[t]>Y[',nx,sep='')
mylab <- paste(mylab,'])',sep='')
a<-table.element(a,mylab,1,header=TRUE)
a<-table.row.end(a)
for (i in (nx-par5):nx) {
a<-table.row.start(a)
a<-table.element(a,i,header=TRUE)
a<-table.element(a,x[i])
a<-table.element(a,'-')
a<-table.row.end(a)
}
for (i in 1:fx) {
a<-table.row.start(a)
a<-table.element(a,nx+i,header=TRUE)
a<-table.element(a,round(x[nx+i],4))
a<-table.element(a,round(forecast$pred[i],4))
a<-table.element(a,round(lb[i],4))
a<-table.element(a,round(ub[i],4))
a<-table.element(a,round((1-prob.pval[i]),4))
a<-table.element(a,round((1-prob.dec[i]),4))
a<-table.element(a,round((1-prob.sdec[i]),4))
a<-table.element(a,round((1-prob.ldec[i]),4))
a<-table.row.end(a)
}
a<-table.end(a)
table.save(a,file='mytable.tab')
a<-table.start()
a<-table.row.start(a)
a<-table.element(a,'Univariate ARIMA Extrapolation Forecast Performance',7,TRUE)
a<-table.row.end(a)
a<-table.row.start(a)
a<-table.element(a,'time',1,header=TRUE)
a<-table.element(a,'% S.E.',1,header=TRUE)
a<-table.element(a,'PE',1,header=TRUE)
a<-table.element(a,'MAPE',1,header=TRUE)
a<-table.element(a,'Sq.E',1,header=TRUE)
a<-table.element(a,'MSE',1,header=TRUE)
a<-table.element(a,'RMSE',1,header=TRUE)
a<-table.row.end(a)
for (i in 1:fx) {
a<-table.row.start(a)
a<-table.element(a,nx+i,header=TRUE)
a<-table.element(a,round(perc.se[i],4))
a<-table.element(a,round(perf.pe[i],4))
a<-table.element(a,round(perf.mape[i],4))
a<-table.element(a,round(perf.se[i],4))
a<-table.element(a,round(perf.mse[i],4))
a<-table.element(a,round(perf.rmse[i],4))
a<-table.row.end(a)
}
a<-table.end(a)
table.save(a,file='mytable1.tab')