Free Statistics

of Irreproducible Research!

Author's title

Author*The author of this computation has been verified*
R Software Modulerwasp_autocorrelation.wasp
Title produced by software(Partial) Autocorrelation Function
Date of computationWed, 17 Dec 2008 01:01:47 -0700
Cite this page as followsStatistical Computations at FreeStatistics.org, Office for Research Development and Education, URL https://freestatistics.org/blog/index.php?v=date/2008/Dec/17/t1229500949xs1jr1s2dod7p71.htm/, Retrieved Sun, 19 May 2024 00:03:24 +0000
Statistical Computations at FreeStatistics.org, Office for Research Development and Education, URL https://freestatistics.org/blog/index.php?pk=34267, Retrieved Sun, 19 May 2024 00:03:24 +0000
QR Codes:

Original text written by user:
IsPrivate?No (this computation is public)
User-defined keywords
Estimated Impact210
Family? (F = Feedback message, R = changed R code, M = changed R Module, P = changed Parameters, D = changed Data)
-       [(Partial) Autocorrelation Function] [paper] [2008-12-17 08:01:47] [821c4b3d195be8e737cf8c9dc649d3cf] [Current]
Feedback Forum

Post a new message
Dataseries X:
31.58095238
27.88428571
27.31826087
28.8925
28.04772727
28.725
32.0047619
34.53043478
33.4675
34.09
35.47045455
34.5945
34.32045455
32.777
28.38272727
29.17631579
28.61772727
28.195
29.32590909
29.71869565
26.2865
26.81869565
27.64318182
27.09666667
27.04545455
26.018
25.762
25.94333333
24.97318182
21.7435
18.1626087
16.94818182
16.458
16.44
18.20428571
16.4425
15.70409091
13.941
12.23333333
14.75
14.62190476
15.04285714
15.50130435
16.10047619
15.44136364
15.13695652
15.415
15.68952381
17.57142857
18.419
17.96130435
18.3875
17.62571429
17.94590909
17.78954545
17.72818182
18.99090909
19.83428571
20.22590909
20.23608696
21.11857143
21.2505
21.80333333
21.84333333
22.20909091
22.63545455
23.5352381
23.78173913
23.65409091
23.93428571
24.77318182
26.26428571
27.68772727
29.542
29.31086957
29.255
28.68545455
26.15909091
27.11619048
29.39869565
30.98761905
32.95818182
32.19818182
31.67421053
32.49318182
33.6615
32.43863636
34.37526316
32.36363636
30.72809524
30.31136364
27.26304348
25.0525
22.32681818
18.25727273
18.29789474
16.00227273
14.36285714
14.98263158
16.87909091
16.55954545
13.31
9.607391304
9.341428571
7.888181818
1.714705882
0.811
0.713333333


Summary of computational transaction
Raw Inputview raw input (R code)
Raw Outputview raw output of R engine
Computing time2 seconds
R Server'Sir Ronald Aylmer Fisher' @ 193.190.124.24

\begin{tabular}{lllllllll}
\hline
Summary of computational transaction \tabularnewline
Raw Input & view raw input (R code)  \tabularnewline
Raw Output & view raw output of R engine  \tabularnewline
Computing time & 2 seconds \tabularnewline
R Server & 'Sir Ronald Aylmer Fisher' @ 193.190.124.24 \tabularnewline
\hline
\end{tabular}
%Source: https://freestatistics.org/blog/index.php?pk=34267&T=0

[TABLE]
[ROW][C]Summary of computational transaction[/C][/ROW]
[ROW][C]Raw Input[/C][C]view raw input (R code) [/C][/ROW]
[ROW][C]Raw Output[/C][C]view raw output of R engine [/C][/ROW]
[ROW][C]Computing time[/C][C]2 seconds[/C][/ROW]
[ROW][C]R Server[/C][C]'Sir Ronald Aylmer Fisher' @ 193.190.124.24[/C][/ROW]
[/TABLE]
Source: https://freestatistics.org/blog/index.php?pk=34267&T=0

Globally Unique Identifier (entire table): ba.freestatistics.org/blog/index.php?pk=34267&T=0

As an alternative you can also use a QR Code:  

The GUIDs for individual cells are displayed in the table below:

Summary of computational transaction
Raw Inputview raw input (R code)
Raw Outputview raw output of R engine
Computing time2 seconds
R Server'Sir Ronald Aylmer Fisher' @ 193.190.124.24


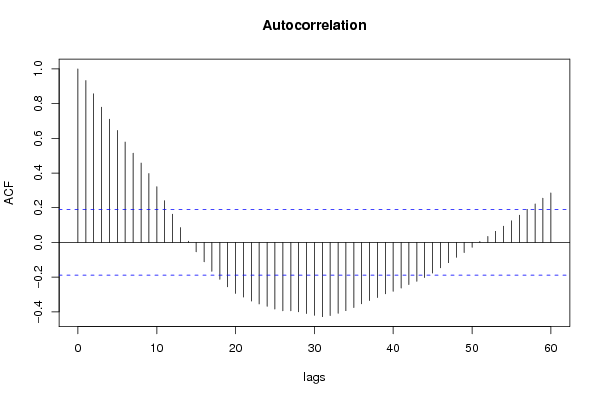
Autocorrelation Function
Time lag kACF(k)T-STATP-value
10.9329889.69590
20.8565988.9020
30.779328.09890
40.7103367.3820
50.6454556.70780
60.5781866.00870
70.5146475.34840
80.45744.75343e-06
90.3967174.12283.7e-05
100.3211733.33770.00058
110.2403692.4980.006999
120.1627351.69120.046842
130.0855050.88860.188099
140.0071170.0740.470587
15-0.054053-0.56170.28773
16-0.111947-1.16340.123619
17-0.166635-1.73170.04309
18-0.212356-2.20690.01472
19-0.255799-2.65830.004523
20-0.294106-3.05640.001411
21-0.314932-3.27290.000715
22-0.338441-3.51720.00032
23-0.354401-3.6830.000181
24-0.368745-3.83210.000107
25-0.384583-3.99675.9e-05
26-0.393839-4.09294.1e-05
27-0.394302-4.09774e-05
28-0.400191-4.15893.2e-05
29-0.409824-4.2592.2e-05
30-0.420604-4.3711.4e-05
31-0.428031-4.44821.1e-05
32-0.421639-4.38181.4e-05
33-0.40893-4.24972.3e-05
34-0.393333-4.08764.2e-05
35-0.375001-3.89718.5e-05
36-0.354033-3.67920.000183
37-0.335425-3.48580.000355
38-0.317276-3.29720.000661
39-0.29663-3.08270.001302
40-0.28152-2.92560.002095
41-0.262859-2.73170.003681
42-0.243004-2.52540.006505
43-0.224579-2.33390.010726
44-0.202065-2.09990.019032
45-0.176001-1.82910.035075
46-0.146408-1.52150.065526
47-0.116602-1.21180.114123
48-0.085994-0.89370.186742
49-0.058744-0.61050.27141
50-0.02771-0.2880.38696
510.0051340.05340.478776
520.0345390.35890.360172
530.0637920.66290.254388
540.0930220.96670.167924
550.1241661.29040.09984
560.1571031.63270.052727
570.1905991.98080.02508
580.2218632.30570.01152
590.254882.64880.004645
600.285122.96310.001874

\begin{tabular}{lllllllll}
\hline
Autocorrelation Function \tabularnewline
Time lag k & ACF(k) & T-STAT & P-value \tabularnewline
1 & 0.932988 & 9.6959 & 0 \tabularnewline
2 & 0.856598 & 8.902 & 0 \tabularnewline
3 & 0.77932 & 8.0989 & 0 \tabularnewline
4 & 0.710336 & 7.382 & 0 \tabularnewline
5 & 0.645455 & 6.7078 & 0 \tabularnewline
6 & 0.578186 & 6.0087 & 0 \tabularnewline
7 & 0.514647 & 5.3484 & 0 \tabularnewline
8 & 0.4574 & 4.7534 & 3e-06 \tabularnewline
9 & 0.396717 & 4.1228 & 3.7e-05 \tabularnewline
10 & 0.321173 & 3.3377 & 0.00058 \tabularnewline
11 & 0.240369 & 2.498 & 0.006999 \tabularnewline
12 & 0.162735 & 1.6912 & 0.046842 \tabularnewline
13 & 0.085505 & 0.8886 & 0.188099 \tabularnewline
14 & 0.007117 & 0.074 & 0.470587 \tabularnewline
15 & -0.054053 & -0.5617 & 0.28773 \tabularnewline
16 & -0.111947 & -1.1634 & 0.123619 \tabularnewline
17 & -0.166635 & -1.7317 & 0.04309 \tabularnewline
18 & -0.212356 & -2.2069 & 0.01472 \tabularnewline
19 & -0.255799 & -2.6583 & 0.004523 \tabularnewline
20 & -0.294106 & -3.0564 & 0.001411 \tabularnewline
21 & -0.314932 & -3.2729 & 0.000715 \tabularnewline
22 & -0.338441 & -3.5172 & 0.00032 \tabularnewline
23 & -0.354401 & -3.683 & 0.000181 \tabularnewline
24 & -0.368745 & -3.8321 & 0.000107 \tabularnewline
25 & -0.384583 & -3.9967 & 5.9e-05 \tabularnewline
26 & -0.393839 & -4.0929 & 4.1e-05 \tabularnewline
27 & -0.394302 & -4.0977 & 4e-05 \tabularnewline
28 & -0.400191 & -4.1589 & 3.2e-05 \tabularnewline
29 & -0.409824 & -4.259 & 2.2e-05 \tabularnewline
30 & -0.420604 & -4.371 & 1.4e-05 \tabularnewline
31 & -0.428031 & -4.4482 & 1.1e-05 \tabularnewline
32 & -0.421639 & -4.3818 & 1.4e-05 \tabularnewline
33 & -0.40893 & -4.2497 & 2.3e-05 \tabularnewline
34 & -0.393333 & -4.0876 & 4.2e-05 \tabularnewline
35 & -0.375001 & -3.8971 & 8.5e-05 \tabularnewline
36 & -0.354033 & -3.6792 & 0.000183 \tabularnewline
37 & -0.335425 & -3.4858 & 0.000355 \tabularnewline
38 & -0.317276 & -3.2972 & 0.000661 \tabularnewline
39 & -0.29663 & -3.0827 & 0.001302 \tabularnewline
40 & -0.28152 & -2.9256 & 0.002095 \tabularnewline
41 & -0.262859 & -2.7317 & 0.003681 \tabularnewline
42 & -0.243004 & -2.5254 & 0.006505 \tabularnewline
43 & -0.224579 & -2.3339 & 0.010726 \tabularnewline
44 & -0.202065 & -2.0999 & 0.019032 \tabularnewline
45 & -0.176001 & -1.8291 & 0.035075 \tabularnewline
46 & -0.146408 & -1.5215 & 0.065526 \tabularnewline
47 & -0.116602 & -1.2118 & 0.114123 \tabularnewline
48 & -0.085994 & -0.8937 & 0.186742 \tabularnewline
49 & -0.058744 & -0.6105 & 0.27141 \tabularnewline
50 & -0.02771 & -0.288 & 0.38696 \tabularnewline
51 & 0.005134 & 0.0534 & 0.478776 \tabularnewline
52 & 0.034539 & 0.3589 & 0.360172 \tabularnewline
53 & 0.063792 & 0.6629 & 0.254388 \tabularnewline
54 & 0.093022 & 0.9667 & 0.167924 \tabularnewline
55 & 0.124166 & 1.2904 & 0.09984 \tabularnewline
56 & 0.157103 & 1.6327 & 0.052727 \tabularnewline
57 & 0.190599 & 1.9808 & 0.02508 \tabularnewline
58 & 0.221863 & 2.3057 & 0.01152 \tabularnewline
59 & 0.25488 & 2.6488 & 0.004645 \tabularnewline
60 & 0.28512 & 2.9631 & 0.001874 \tabularnewline
\hline
\end{tabular}
%Source: https://freestatistics.org/blog/index.php?pk=34267&T=1

[TABLE]
[ROW][C]Autocorrelation Function[/C][/ROW]
[ROW][C]Time lag k[/C][C]ACF(k)[/C][C]T-STAT[/C][C]P-value[/C][/ROW]
[ROW][C]1[/C][C]0.932988[/C][C]9.6959[/C][C]0[/C][/ROW]
[ROW][C]2[/C][C]0.856598[/C][C]8.902[/C][C]0[/C][/ROW]
[ROW][C]3[/C][C]0.77932[/C][C]8.0989[/C][C]0[/C][/ROW]
[ROW][C]4[/C][C]0.710336[/C][C]7.382[/C][C]0[/C][/ROW]
[ROW][C]5[/C][C]0.645455[/C][C]6.7078[/C][C]0[/C][/ROW]
[ROW][C]6[/C][C]0.578186[/C][C]6.0087[/C][C]0[/C][/ROW]
[ROW][C]7[/C][C]0.514647[/C][C]5.3484[/C][C]0[/C][/ROW]
[ROW][C]8[/C][C]0.4574[/C][C]4.7534[/C][C]3e-06[/C][/ROW]
[ROW][C]9[/C][C]0.396717[/C][C]4.1228[/C][C]3.7e-05[/C][/ROW]
[ROW][C]10[/C][C]0.321173[/C][C]3.3377[/C][C]0.00058[/C][/ROW]
[ROW][C]11[/C][C]0.240369[/C][C]2.498[/C][C]0.006999[/C][/ROW]
[ROW][C]12[/C][C]0.162735[/C][C]1.6912[/C][C]0.046842[/C][/ROW]
[ROW][C]13[/C][C]0.085505[/C][C]0.8886[/C][C]0.188099[/C][/ROW]
[ROW][C]14[/C][C]0.007117[/C][C]0.074[/C][C]0.470587[/C][/ROW]
[ROW][C]15[/C][C]-0.054053[/C][C]-0.5617[/C][C]0.28773[/C][/ROW]
[ROW][C]16[/C][C]-0.111947[/C][C]-1.1634[/C][C]0.123619[/C][/ROW]
[ROW][C]17[/C][C]-0.166635[/C][C]-1.7317[/C][C]0.04309[/C][/ROW]
[ROW][C]18[/C][C]-0.212356[/C][C]-2.2069[/C][C]0.01472[/C][/ROW]
[ROW][C]19[/C][C]-0.255799[/C][C]-2.6583[/C][C]0.004523[/C][/ROW]
[ROW][C]20[/C][C]-0.294106[/C][C]-3.0564[/C][C]0.001411[/C][/ROW]
[ROW][C]21[/C][C]-0.314932[/C][C]-3.2729[/C][C]0.000715[/C][/ROW]
[ROW][C]22[/C][C]-0.338441[/C][C]-3.5172[/C][C]0.00032[/C][/ROW]
[ROW][C]23[/C][C]-0.354401[/C][C]-3.683[/C][C]0.000181[/C][/ROW]
[ROW][C]24[/C][C]-0.368745[/C][C]-3.8321[/C][C]0.000107[/C][/ROW]
[ROW][C]25[/C][C]-0.384583[/C][C]-3.9967[/C][C]5.9e-05[/C][/ROW]
[ROW][C]26[/C][C]-0.393839[/C][C]-4.0929[/C][C]4.1e-05[/C][/ROW]
[ROW][C]27[/C][C]-0.394302[/C][C]-4.0977[/C][C]4e-05[/C][/ROW]
[ROW][C]28[/C][C]-0.400191[/C][C]-4.1589[/C][C]3.2e-05[/C][/ROW]
[ROW][C]29[/C][C]-0.409824[/C][C]-4.259[/C][C]2.2e-05[/C][/ROW]
[ROW][C]30[/C][C]-0.420604[/C][C]-4.371[/C][C]1.4e-05[/C][/ROW]
[ROW][C]31[/C][C]-0.428031[/C][C]-4.4482[/C][C]1.1e-05[/C][/ROW]
[ROW][C]32[/C][C]-0.421639[/C][C]-4.3818[/C][C]1.4e-05[/C][/ROW]
[ROW][C]33[/C][C]-0.40893[/C][C]-4.2497[/C][C]2.3e-05[/C][/ROW]
[ROW][C]34[/C][C]-0.393333[/C][C]-4.0876[/C][C]4.2e-05[/C][/ROW]
[ROW][C]35[/C][C]-0.375001[/C][C]-3.8971[/C][C]8.5e-05[/C][/ROW]
[ROW][C]36[/C][C]-0.354033[/C][C]-3.6792[/C][C]0.000183[/C][/ROW]
[ROW][C]37[/C][C]-0.335425[/C][C]-3.4858[/C][C]0.000355[/C][/ROW]
[ROW][C]38[/C][C]-0.317276[/C][C]-3.2972[/C][C]0.000661[/C][/ROW]
[ROW][C]39[/C][C]-0.29663[/C][C]-3.0827[/C][C]0.001302[/C][/ROW]
[ROW][C]40[/C][C]-0.28152[/C][C]-2.9256[/C][C]0.002095[/C][/ROW]
[ROW][C]41[/C][C]-0.262859[/C][C]-2.7317[/C][C]0.003681[/C][/ROW]
[ROW][C]42[/C][C]-0.243004[/C][C]-2.5254[/C][C]0.006505[/C][/ROW]
[ROW][C]43[/C][C]-0.224579[/C][C]-2.3339[/C][C]0.010726[/C][/ROW]
[ROW][C]44[/C][C]-0.202065[/C][C]-2.0999[/C][C]0.019032[/C][/ROW]
[ROW][C]45[/C][C]-0.176001[/C][C]-1.8291[/C][C]0.035075[/C][/ROW]
[ROW][C]46[/C][C]-0.146408[/C][C]-1.5215[/C][C]0.065526[/C][/ROW]
[ROW][C]47[/C][C]-0.116602[/C][C]-1.2118[/C][C]0.114123[/C][/ROW]
[ROW][C]48[/C][C]-0.085994[/C][C]-0.8937[/C][C]0.186742[/C][/ROW]
[ROW][C]49[/C][C]-0.058744[/C][C]-0.6105[/C][C]0.27141[/C][/ROW]
[ROW][C]50[/C][C]-0.02771[/C][C]-0.288[/C][C]0.38696[/C][/ROW]
[ROW][C]51[/C][C]0.005134[/C][C]0.0534[/C][C]0.478776[/C][/ROW]
[ROW][C]52[/C][C]0.034539[/C][C]0.3589[/C][C]0.360172[/C][/ROW]
[ROW][C]53[/C][C]0.063792[/C][C]0.6629[/C][C]0.254388[/C][/ROW]
[ROW][C]54[/C][C]0.093022[/C][C]0.9667[/C][C]0.167924[/C][/ROW]
[ROW][C]55[/C][C]0.124166[/C][C]1.2904[/C][C]0.09984[/C][/ROW]
[ROW][C]56[/C][C]0.157103[/C][C]1.6327[/C][C]0.052727[/C][/ROW]
[ROW][C]57[/C][C]0.190599[/C][C]1.9808[/C][C]0.02508[/C][/ROW]
[ROW][C]58[/C][C]0.221863[/C][C]2.3057[/C][C]0.01152[/C][/ROW]
[ROW][C]59[/C][C]0.25488[/C][C]2.6488[/C][C]0.004645[/C][/ROW]
[ROW][C]60[/C][C]0.28512[/C][C]2.9631[/C][C]0.001874[/C][/ROW]
[/TABLE]
Source: https://freestatistics.org/blog/index.php?pk=34267&T=1

Globally Unique Identifier (entire table): ba.freestatistics.org/blog/index.php?pk=34267&T=1

As an alternative you can also use a QR Code:  

The GUIDs for individual cells are displayed in the table below:

Autocorrelation Function
Time lag kACF(k)T-STATP-value
10.9329889.69590
20.8565988.9020
30.779328.09890
40.7103367.3820
50.6454556.70780
60.5781866.00870
70.5146475.34840
80.45744.75343e-06
90.3967174.12283.7e-05
100.3211733.33770.00058
110.2403692.4980.006999
120.1627351.69120.046842
130.0855050.88860.188099
140.0071170.0740.470587
15-0.054053-0.56170.28773
16-0.111947-1.16340.123619
17-0.166635-1.73170.04309
18-0.212356-2.20690.01472
19-0.255799-2.65830.004523
20-0.294106-3.05640.001411
21-0.314932-3.27290.000715
22-0.338441-3.51720.00032
23-0.354401-3.6830.000181
24-0.368745-3.83210.000107
25-0.384583-3.99675.9e-05
26-0.393839-4.09294.1e-05
27-0.394302-4.09774e-05
28-0.400191-4.15893.2e-05
29-0.409824-4.2592.2e-05
30-0.420604-4.3711.4e-05
31-0.428031-4.44821.1e-05
32-0.421639-4.38181.4e-05
33-0.40893-4.24972.3e-05
34-0.393333-4.08764.2e-05
35-0.375001-3.89718.5e-05
36-0.354033-3.67920.000183
37-0.335425-3.48580.000355
38-0.317276-3.29720.000661
39-0.29663-3.08270.001302
40-0.28152-2.92560.002095
41-0.262859-2.73170.003681
42-0.243004-2.52540.006505
43-0.224579-2.33390.010726
44-0.202065-2.09990.019032
45-0.176001-1.82910.035075
46-0.146408-1.52150.065526
47-0.116602-1.21180.114123
48-0.085994-0.89370.186742
49-0.058744-0.61050.27141
50-0.02771-0.2880.38696
510.0051340.05340.478776
520.0345390.35890.360172
530.0637920.66290.254388
540.0930220.96670.167924
550.1241661.29040.09984
560.1571031.63270.052727
570.1905991.98080.02508
580.2218632.30570.01152
590.254882.64880.004645
600.285122.96310.001874


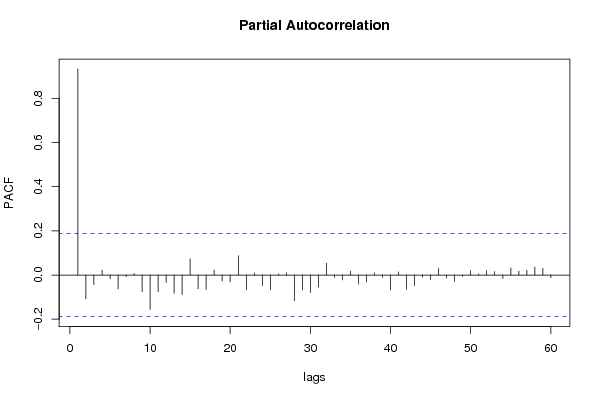
Partial Autocorrelation Function
Time lag kPACF(k)T-STATP-value
10.9329889.69590
2-0.107068-1.11270.134158
3-0.043353-0.45050.326614
40.0220090.22870.409759
5-0.016878-0.17540.430548
6-0.063036-0.65510.256902
7-0.007435-0.07730.469276
80.0066450.06910.472537
9-0.076186-0.79170.215121
10-0.155898-1.62010.05406
11-0.075755-0.78730.216424
12-0.033965-0.3530.362397
13-0.082406-0.85640.19684
14-0.087915-0.91360.181471
150.0732090.76080.224215
16-0.062153-0.64590.259852
17-0.065332-0.6790.249311
180.0232010.24110.404961
19-0.027172-0.28240.389095
20-0.03136-0.32590.372565
210.0874170.90850.182827
22-0.066709-0.69330.244816
230.0086650.09010.464206
24-0.048478-0.50380.307713
25-0.0673-0.69940.242902
260.0046130.04790.480925
270.0102210.10620.457804
28-0.116142-1.2070.115037
29-0.068151-0.70820.240158
30-0.079169-0.82270.206233
31-0.054414-0.56550.286457
320.0527860.54860.292217
33-0.01165-0.12110.451929
34-0.022171-0.23040.409103
350.0170240.17690.429952
36-0.041011-0.42620.335407
37-0.031916-0.33170.370387
380.008930.09280.463118
39-0.011105-0.11540.454167
40-0.0682-0.70880.24
410.0137030.14240.443512
42-0.064253-0.66770.252864
43-0.048251-0.50140.308542
44-0.009981-0.10370.458789
45-0.020673-0.21480.41515
460.0295810.30740.379561
47-0.013645-0.14180.44375
48-0.02946-0.30620.380037
49-0.006165-0.06410.474518
500.0191770.19930.421203
510.0050710.05270.479033
520.0193760.20140.420397
530.0154070.16010.436546
54-0.015942-0.16570.43436
550.0316760.32920.371326
560.0172750.17950.42893
570.0210070.21830.413798
580.0364420.37870.35282
590.0298930.31070.37833
60-0.012479-0.12970.448529

\begin{tabular}{lllllllll}
\hline
Partial Autocorrelation Function \tabularnewline
Time lag k & PACF(k) & T-STAT & P-value \tabularnewline
1 & 0.932988 & 9.6959 & 0 \tabularnewline
2 & -0.107068 & -1.1127 & 0.134158 \tabularnewline
3 & -0.043353 & -0.4505 & 0.326614 \tabularnewline
4 & 0.022009 & 0.2287 & 0.409759 \tabularnewline
5 & -0.016878 & -0.1754 & 0.430548 \tabularnewline
6 & -0.063036 & -0.6551 & 0.256902 \tabularnewline
7 & -0.007435 & -0.0773 & 0.469276 \tabularnewline
8 & 0.006645 & 0.0691 & 0.472537 \tabularnewline
9 & -0.076186 & -0.7917 & 0.215121 \tabularnewline
10 & -0.155898 & -1.6201 & 0.05406 \tabularnewline
11 & -0.075755 & -0.7873 & 0.216424 \tabularnewline
12 & -0.033965 & -0.353 & 0.362397 \tabularnewline
13 & -0.082406 & -0.8564 & 0.19684 \tabularnewline
14 & -0.087915 & -0.9136 & 0.181471 \tabularnewline
15 & 0.073209 & 0.7608 & 0.224215 \tabularnewline
16 & -0.062153 & -0.6459 & 0.259852 \tabularnewline
17 & -0.065332 & -0.679 & 0.249311 \tabularnewline
18 & 0.023201 & 0.2411 & 0.404961 \tabularnewline
19 & -0.027172 & -0.2824 & 0.389095 \tabularnewline
20 & -0.03136 & -0.3259 & 0.372565 \tabularnewline
21 & 0.087417 & 0.9085 & 0.182827 \tabularnewline
22 & -0.066709 & -0.6933 & 0.244816 \tabularnewline
23 & 0.008665 & 0.0901 & 0.464206 \tabularnewline
24 & -0.048478 & -0.5038 & 0.307713 \tabularnewline
25 & -0.0673 & -0.6994 & 0.242902 \tabularnewline
26 & 0.004613 & 0.0479 & 0.480925 \tabularnewline
27 & 0.010221 & 0.1062 & 0.457804 \tabularnewline
28 & -0.116142 & -1.207 & 0.115037 \tabularnewline
29 & -0.068151 & -0.7082 & 0.240158 \tabularnewline
30 & -0.079169 & -0.8227 & 0.206233 \tabularnewline
31 & -0.054414 & -0.5655 & 0.286457 \tabularnewline
32 & 0.052786 & 0.5486 & 0.292217 \tabularnewline
33 & -0.01165 & -0.1211 & 0.451929 \tabularnewline
34 & -0.022171 & -0.2304 & 0.409103 \tabularnewline
35 & 0.017024 & 0.1769 & 0.429952 \tabularnewline
36 & -0.041011 & -0.4262 & 0.335407 \tabularnewline
37 & -0.031916 & -0.3317 & 0.370387 \tabularnewline
38 & 0.00893 & 0.0928 & 0.463118 \tabularnewline
39 & -0.011105 & -0.1154 & 0.454167 \tabularnewline
40 & -0.0682 & -0.7088 & 0.24 \tabularnewline
41 & 0.013703 & 0.1424 & 0.443512 \tabularnewline
42 & -0.064253 & -0.6677 & 0.252864 \tabularnewline
43 & -0.048251 & -0.5014 & 0.308542 \tabularnewline
44 & -0.009981 & -0.1037 & 0.458789 \tabularnewline
45 & -0.020673 & -0.2148 & 0.41515 \tabularnewline
46 & 0.029581 & 0.3074 & 0.379561 \tabularnewline
47 & -0.013645 & -0.1418 & 0.44375 \tabularnewline
48 & -0.02946 & -0.3062 & 0.380037 \tabularnewline
49 & -0.006165 & -0.0641 & 0.474518 \tabularnewline
50 & 0.019177 & 0.1993 & 0.421203 \tabularnewline
51 & 0.005071 & 0.0527 & 0.479033 \tabularnewline
52 & 0.019376 & 0.2014 & 0.420397 \tabularnewline
53 & 0.015407 & 0.1601 & 0.436546 \tabularnewline
54 & -0.015942 & -0.1657 & 0.43436 \tabularnewline
55 & 0.031676 & 0.3292 & 0.371326 \tabularnewline
56 & 0.017275 & 0.1795 & 0.42893 \tabularnewline
57 & 0.021007 & 0.2183 & 0.413798 \tabularnewline
58 & 0.036442 & 0.3787 & 0.35282 \tabularnewline
59 & 0.029893 & 0.3107 & 0.37833 \tabularnewline
60 & -0.012479 & -0.1297 & 0.448529 \tabularnewline
\hline
\end{tabular}
%Source: https://freestatistics.org/blog/index.php?pk=34267&T=2

[TABLE]
[ROW][C]Partial Autocorrelation Function[/C][/ROW]
[ROW][C]Time lag k[/C][C]PACF(k)[/C][C]T-STAT[/C][C]P-value[/C][/ROW]
[ROW][C]1[/C][C]0.932988[/C][C]9.6959[/C][C]0[/C][/ROW]
[ROW][C]2[/C][C]-0.107068[/C][C]-1.1127[/C][C]0.134158[/C][/ROW]
[ROW][C]3[/C][C]-0.043353[/C][C]-0.4505[/C][C]0.326614[/C][/ROW]
[ROW][C]4[/C][C]0.022009[/C][C]0.2287[/C][C]0.409759[/C][/ROW]
[ROW][C]5[/C][C]-0.016878[/C][C]-0.1754[/C][C]0.430548[/C][/ROW]
[ROW][C]6[/C][C]-0.063036[/C][C]-0.6551[/C][C]0.256902[/C][/ROW]
[ROW][C]7[/C][C]-0.007435[/C][C]-0.0773[/C][C]0.469276[/C][/ROW]
[ROW][C]8[/C][C]0.006645[/C][C]0.0691[/C][C]0.472537[/C][/ROW]
[ROW][C]9[/C][C]-0.076186[/C][C]-0.7917[/C][C]0.215121[/C][/ROW]
[ROW][C]10[/C][C]-0.155898[/C][C]-1.6201[/C][C]0.05406[/C][/ROW]
[ROW][C]11[/C][C]-0.075755[/C][C]-0.7873[/C][C]0.216424[/C][/ROW]
[ROW][C]12[/C][C]-0.033965[/C][C]-0.353[/C][C]0.362397[/C][/ROW]
[ROW][C]13[/C][C]-0.082406[/C][C]-0.8564[/C][C]0.19684[/C][/ROW]
[ROW][C]14[/C][C]-0.087915[/C][C]-0.9136[/C][C]0.181471[/C][/ROW]
[ROW][C]15[/C][C]0.073209[/C][C]0.7608[/C][C]0.224215[/C][/ROW]
[ROW][C]16[/C][C]-0.062153[/C][C]-0.6459[/C][C]0.259852[/C][/ROW]
[ROW][C]17[/C][C]-0.065332[/C][C]-0.679[/C][C]0.249311[/C][/ROW]
[ROW][C]18[/C][C]0.023201[/C][C]0.2411[/C][C]0.404961[/C][/ROW]
[ROW][C]19[/C][C]-0.027172[/C][C]-0.2824[/C][C]0.389095[/C][/ROW]
[ROW][C]20[/C][C]-0.03136[/C][C]-0.3259[/C][C]0.372565[/C][/ROW]
[ROW][C]21[/C][C]0.087417[/C][C]0.9085[/C][C]0.182827[/C][/ROW]
[ROW][C]22[/C][C]-0.066709[/C][C]-0.6933[/C][C]0.244816[/C][/ROW]
[ROW][C]23[/C][C]0.008665[/C][C]0.0901[/C][C]0.464206[/C][/ROW]
[ROW][C]24[/C][C]-0.048478[/C][C]-0.5038[/C][C]0.307713[/C][/ROW]
[ROW][C]25[/C][C]-0.0673[/C][C]-0.6994[/C][C]0.242902[/C][/ROW]
[ROW][C]26[/C][C]0.004613[/C][C]0.0479[/C][C]0.480925[/C][/ROW]
[ROW][C]27[/C][C]0.010221[/C][C]0.1062[/C][C]0.457804[/C][/ROW]
[ROW][C]28[/C][C]-0.116142[/C][C]-1.207[/C][C]0.115037[/C][/ROW]
[ROW][C]29[/C][C]-0.068151[/C][C]-0.7082[/C][C]0.240158[/C][/ROW]
[ROW][C]30[/C][C]-0.079169[/C][C]-0.8227[/C][C]0.206233[/C][/ROW]
[ROW][C]31[/C][C]-0.054414[/C][C]-0.5655[/C][C]0.286457[/C][/ROW]
[ROW][C]32[/C][C]0.052786[/C][C]0.5486[/C][C]0.292217[/C][/ROW]
[ROW][C]33[/C][C]-0.01165[/C][C]-0.1211[/C][C]0.451929[/C][/ROW]
[ROW][C]34[/C][C]-0.022171[/C][C]-0.2304[/C][C]0.409103[/C][/ROW]
[ROW][C]35[/C][C]0.017024[/C][C]0.1769[/C][C]0.429952[/C][/ROW]
[ROW][C]36[/C][C]-0.041011[/C][C]-0.4262[/C][C]0.335407[/C][/ROW]
[ROW][C]37[/C][C]-0.031916[/C][C]-0.3317[/C][C]0.370387[/C][/ROW]
[ROW][C]38[/C][C]0.00893[/C][C]0.0928[/C][C]0.463118[/C][/ROW]
[ROW][C]39[/C][C]-0.011105[/C][C]-0.1154[/C][C]0.454167[/C][/ROW]
[ROW][C]40[/C][C]-0.0682[/C][C]-0.7088[/C][C]0.24[/C][/ROW]
[ROW][C]41[/C][C]0.013703[/C][C]0.1424[/C][C]0.443512[/C][/ROW]
[ROW][C]42[/C][C]-0.064253[/C][C]-0.6677[/C][C]0.252864[/C][/ROW]
[ROW][C]43[/C][C]-0.048251[/C][C]-0.5014[/C][C]0.308542[/C][/ROW]
[ROW][C]44[/C][C]-0.009981[/C][C]-0.1037[/C][C]0.458789[/C][/ROW]
[ROW][C]45[/C][C]-0.020673[/C][C]-0.2148[/C][C]0.41515[/C][/ROW]
[ROW][C]46[/C][C]0.029581[/C][C]0.3074[/C][C]0.379561[/C][/ROW]
[ROW][C]47[/C][C]-0.013645[/C][C]-0.1418[/C][C]0.44375[/C][/ROW]
[ROW][C]48[/C][C]-0.02946[/C][C]-0.3062[/C][C]0.380037[/C][/ROW]
[ROW][C]49[/C][C]-0.006165[/C][C]-0.0641[/C][C]0.474518[/C][/ROW]
[ROW][C]50[/C][C]0.019177[/C][C]0.1993[/C][C]0.421203[/C][/ROW]
[ROW][C]51[/C][C]0.005071[/C][C]0.0527[/C][C]0.479033[/C][/ROW]
[ROW][C]52[/C][C]0.019376[/C][C]0.2014[/C][C]0.420397[/C][/ROW]
[ROW][C]53[/C][C]0.015407[/C][C]0.1601[/C][C]0.436546[/C][/ROW]
[ROW][C]54[/C][C]-0.015942[/C][C]-0.1657[/C][C]0.43436[/C][/ROW]
[ROW][C]55[/C][C]0.031676[/C][C]0.3292[/C][C]0.371326[/C][/ROW]
[ROW][C]56[/C][C]0.017275[/C][C]0.1795[/C][C]0.42893[/C][/ROW]
[ROW][C]57[/C][C]0.021007[/C][C]0.2183[/C][C]0.413798[/C][/ROW]
[ROW][C]58[/C][C]0.036442[/C][C]0.3787[/C][C]0.35282[/C][/ROW]
[ROW][C]59[/C][C]0.029893[/C][C]0.3107[/C][C]0.37833[/C][/ROW]
[ROW][C]60[/C][C]-0.012479[/C][C]-0.1297[/C][C]0.448529[/C][/ROW]
[/TABLE]
Source: https://freestatistics.org/blog/index.php?pk=34267&T=2

Globally Unique Identifier (entire table): ba.freestatistics.org/blog/index.php?pk=34267&T=2

As an alternative you can also use a QR Code:  

The GUIDs for individual cells are displayed in the table below:

Partial Autocorrelation Function
Time lag kPACF(k)T-STATP-value
10.9329889.69590
2-0.107068-1.11270.134158
3-0.043353-0.45050.326614
40.0220090.22870.409759
5-0.016878-0.17540.430548
6-0.063036-0.65510.256902
7-0.007435-0.07730.469276
80.0066450.06910.472537
9-0.076186-0.79170.215121
10-0.155898-1.62010.05406
11-0.075755-0.78730.216424
12-0.033965-0.3530.362397
13-0.082406-0.85640.19684
14-0.087915-0.91360.181471
150.0732090.76080.224215
16-0.062153-0.64590.259852
17-0.065332-0.6790.249311
180.0232010.24110.404961
19-0.027172-0.28240.389095
20-0.03136-0.32590.372565
210.0874170.90850.182827
22-0.066709-0.69330.244816
230.0086650.09010.464206
24-0.048478-0.50380.307713
25-0.0673-0.69940.242902
260.0046130.04790.480925
270.0102210.10620.457804
28-0.116142-1.2070.115037
29-0.068151-0.70820.240158
30-0.079169-0.82270.206233
31-0.054414-0.56550.286457
320.0527860.54860.292217
33-0.01165-0.12110.451929
34-0.022171-0.23040.409103
350.0170240.17690.429952
36-0.041011-0.42620.335407
37-0.031916-0.33170.370387
380.008930.09280.463118
39-0.011105-0.11540.454167
40-0.0682-0.70880.24
410.0137030.14240.443512
42-0.064253-0.66770.252864
43-0.048251-0.50140.308542
44-0.009981-0.10370.458789
45-0.020673-0.21480.41515
460.0295810.30740.379561
47-0.013645-0.14180.44375
48-0.02946-0.30620.380037
49-0.006165-0.06410.474518
500.0191770.19930.421203
510.0050710.05270.479033
520.0193760.20140.420397
530.0154070.16010.436546
54-0.015942-0.16570.43436
550.0316760.32920.371326
560.0172750.17950.42893
570.0210070.21830.413798
580.0364420.37870.35282
590.0298930.31070.37833
60-0.012479-0.12970.448529


Parameters (Session):
par1 = 60 ; par2 = 1 ; par3 = 0 ; par4 = 0 ; par5 = 12 ;
Parameters (R input):
par1 = 60 ; par2 = 1 ; par3 = 0 ; par4 = 0 ; par5 = 12 ;
R code (references can be found in the software module):
if (par1 == 'Default') {
par1 = 10*log10(length(x))
} else {
par1 <- as.numeric(par1)
}
par2 <- as.numeric(par2)
par3 <- as.numeric(par3)
par4 <- as.numeric(par4)
par5 <- as.numeric(par5)
if (par2 == 0) {
x <- log(x)
} else {
x <- (x ^ par2 - 1) / par2
}
if (par3 > 0) x <- diff(x,lag=1,difference=par3)
if (par4 > 0) x <- diff(x,lag=par5,difference=par4)
bitmap(file='pic1.png')
racf <- acf(x,par1,main='Autocorrelation',xlab='lags',ylab='ACF')
dev.off()
bitmap(file='pic2.png')
rpacf <- pacf(x,par1,main='Partial Autocorrelation',xlab='lags',ylab='PACF')
dev.off()
(myacf <- c(racf$acf))
(mypacf <- c(rpacf$acf))
lengthx <- length(x)
sqrtn <- sqrt(lengthx)
load(file='createtable')
a<-table.start()
a<-table.row.start(a)
a<-table.element(a,'Autocorrelation Function',4,TRUE)
a<-table.row.end(a)
a<-table.row.start(a)
a<-table.element(a,'Time lag k',header=TRUE)
a<-table.element(a,hyperlink('basics.htm','ACF(k)','click here for more information about the Autocorrelation Function'),header=TRUE)
a<-table.element(a,'T-STAT',header=TRUE)
a<-table.element(a,'P-value',header=TRUE)
a<-table.row.end(a)
for (i in 2:(par1+1)) {
a<-table.row.start(a)
a<-table.element(a,i-1,header=TRUE)
a<-table.element(a,round(myacf[i],6))
mytstat <- myacf[i]*sqrtn
a<-table.element(a,round(mytstat,4))
a<-table.element(a,round(1-pt(abs(mytstat),lengthx),6))
a<-table.row.end(a)
}
a<-table.end(a)
table.save(a,file='mytable.tab')
a<-table.start()
a<-table.row.start(a)
a<-table.element(a,'Partial Autocorrelation Function',4,TRUE)
a<-table.row.end(a)
a<-table.row.start(a)
a<-table.element(a,'Time lag k',header=TRUE)
a<-table.element(a,hyperlink('basics.htm','PACF(k)','click here for more information about the Partial Autocorrelation Function'),header=TRUE)
a<-table.element(a,'T-STAT',header=TRUE)
a<-table.element(a,'P-value',header=TRUE)
a<-table.row.end(a)
for (i in 1:par1) {
a<-table.row.start(a)
a<-table.element(a,i,header=TRUE)
a<-table.element(a,round(mypacf[i],6))
mytstat <- mypacf[i]*sqrtn
a<-table.element(a,round(mytstat,4))
a<-table.element(a,round(1-pt(abs(mytstat),lengthx),6))
a<-table.row.end(a)
}
a<-table.end(a)
table.save(a,file='mytable1.tab')