Free Statistics

of Irreproducible Research!

Author's title

Author*The author of this computation has been verified*
R Software Modulerwasp_arimabackwardselection.wasp
Title produced by softwareARIMA Backward Selection
Date of computationWed, 17 Dec 2008 06:46:44 -0700
Cite this page as followsStatistical Computations at FreeStatistics.org, Office for Research Development and Education, URL https://freestatistics.org/blog/index.php?v=date/2008/Dec/17/t1229521891pbjbbmv45dnl9rk.htm/, Retrieved Sun, 26 May 2024 09:39:38 +0000
Statistical Computations at FreeStatistics.org, Office for Research Development and Education, URL https://freestatistics.org/blog/index.php?pk=34347, Retrieved Sun, 26 May 2024 09:39:38 +0000
QR Codes:

Original text written by user:
IsPrivate?No (this computation is public)
User-defined keywords
Estimated Impact169
Family? (F = Feedback message, R = changed R code, M = changed R Module, P = changed Parameters, D = changed Data)
-     [(Partial) Autocorrelation Function] [] [2008-12-17 12:54:04] [ca30429b07824e7c5d48293114d35d71]
- RMP     [ARIMA Backward Selection] [] [2008-12-17 13:46:44] [c66d07e79164cd7acb2569833ec5bcd8] [Current]
- RMPD      [Central Tendency] [] [2008-12-17 23:19:42] [ca30429b07824e7c5d48293114d35d71]
- RMP       [ARIMA Forecasting] [] [2008-12-17 23:24:49] [ca30429b07824e7c5d48293114d35d71]
Feedback Forum

Post a new message
Dataseries X:
15023.6
12083
15761.3
16943
15070.3
13659.6
14768.9
14725.1
15998.1
15370.6
14956.9
15469.7
15101.8
11703.7
16283.6
16726.5
14968.9
14861
14583.3
15305.8
17903.9
16379.4
15420.3
17870.5
15912.8
13866.5
17823.2
17872
17420.4
16704.4
15991.2
16583.6
19123.5
17838.7
17209.4
18586.5
16258.1
15141.6
19202.1
17746.5
19090.1
18040.3
17515.5
17751.8
21072.4
17170
19439.5
19795.4
17574.9
16165.4
19464.6
19932.1
19961.2
17343.4
18924.2
18574.1
21350.6
18840.1
20304.8
21132.4
19753.9


Summary of computational transaction
Raw Inputview raw input (R code)
Raw Outputview raw output of R engine
Computing time10 seconds
R Server'Gwilym Jenkins' @ 72.249.127.135

\begin{tabular}{lllllllll}
\hline
Summary of computational transaction \tabularnewline
Raw Input & view raw input (R code)  \tabularnewline
Raw Output & view raw output of R engine  \tabularnewline
Computing time & 10 seconds \tabularnewline
R Server & 'Gwilym Jenkins' @ 72.249.127.135 \tabularnewline
\hline
\end{tabular}
%Source: https://freestatistics.org/blog/index.php?pk=34347&T=0

[TABLE]
[ROW][C]Summary of computational transaction[/C][/ROW]
[ROW][C]Raw Input[/C][C]view raw input (R code) [/C][/ROW]
[ROW][C]Raw Output[/C][C]view raw output of R engine [/C][/ROW]
[ROW][C]Computing time[/C][C]10 seconds[/C][/ROW]
[ROW][C]R Server[/C][C]'Gwilym Jenkins' @ 72.249.127.135[/C][/ROW]
[/TABLE]
Source: https://freestatistics.org/blog/index.php?pk=34347&T=0

Globally Unique Identifier (entire table): ba.freestatistics.org/blog/index.php?pk=34347&T=0

As an alternative you can also use a QR Code:  

The GUIDs for individual cells are displayed in the table below:

Summary of computational transaction
Raw Inputview raw input (R code)
Raw Outputview raw output of R engine
Computing time10 seconds
R Server'Gwilym Jenkins' @ 72.249.127.135


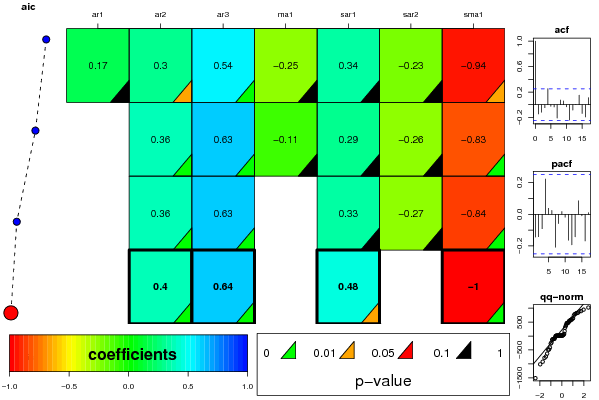
ARIMA Parameter Estimation and Backward Selection
Iterationar1ar2ar3ma1sar1sar2sma1
Estimates ( 1 )0.16770.29590.5362-0.25220.3395-0.2338-0.9425
(p-val)(0.3248 )(0.0176 )(5e-04 )(0.1897 )(0.1198 )(0.3133 )(0.0464 )
Estimates ( 2 )00.36340.6346-0.11320.2895-0.2603-0.8253
(p-val)(NA )(3e-04 )(0 )(0.4881 )(0.2147 )(0.2499 )(0 )
Estimates ( 3 )00.36410.633500.3252-0.2722-0.8402
(p-val)(NA )(1e-04 )(0 )(NA )(0.137 )(0.2219 )(1e-04 )
Estimates ( 4 )00.39530.635800.47630-0.9999
(p-val)(NA )(1e-04 )(0 )(NA )(0.0142 )(NA )(0 )
Estimates ( 5 )NANANANANANANA
(p-val)(NA )(NA )(NA )(NA )(NA )(NA )(NA )
Estimates ( 6 )NANANANANANANA
(p-val)(NA )(NA )(NA )(NA )(NA )(NA )(NA )
Estimates ( 7 )NANANANANANANA
(p-val)(NA )(NA )(NA )(NA )(NA )(NA )(NA )
Estimates ( 8 )NANANANANANANA
(p-val)(NA )(NA )(NA )(NA )(NA )(NA )(NA )
Estimates ( 9 )NANANANANANANA
(p-val)(NA )(NA )(NA )(NA )(NA )(NA )(NA )
Estimates ( 10 )NANANANANANANA
(p-val)(NA )(NA )(NA )(NA )(NA )(NA )(NA )
Estimates ( 11 )NANANANANANANA
(p-val)(NA )(NA )(NA )(NA )(NA )(NA )(NA )
Estimates ( 12 )NANANANANANANA
(p-val)(NA )(NA )(NA )(NA )(NA )(NA )(NA )
Estimates ( 13 )NANANANANANANA
(p-val)(NA )(NA )(NA )(NA )(NA )(NA )(NA )

\begin{tabular}{lllllllll}
\hline
ARIMA Parameter Estimation and Backward Selection \tabularnewline
Iteration & ar1 & ar2 & ar3 & ma1 & sar1 & sar2 & sma1 \tabularnewline
Estimates ( 1 ) & 0.1677 & 0.2959 & 0.5362 & -0.2522 & 0.3395 & -0.2338 & -0.9425 \tabularnewline
(p-val) & (0.3248 ) & (0.0176 ) & (5e-04 ) & (0.1897 ) & (0.1198 ) & (0.3133 ) & (0.0464 ) \tabularnewline
Estimates ( 2 ) & 0 & 0.3634 & 0.6346 & -0.1132 & 0.2895 & -0.2603 & -0.8253 \tabularnewline
(p-val) & (NA ) & (3e-04 ) & (0 ) & (0.4881 ) & (0.2147 ) & (0.2499 ) & (0 ) \tabularnewline
Estimates ( 3 ) & 0 & 0.3641 & 0.6335 & 0 & 0.3252 & -0.2722 & -0.8402 \tabularnewline
(p-val) & (NA ) & (1e-04 ) & (0 ) & (NA ) & (0.137 ) & (0.2219 ) & (1e-04 ) \tabularnewline
Estimates ( 4 ) & 0 & 0.3953 & 0.6358 & 0 & 0.4763 & 0 & -0.9999 \tabularnewline
(p-val) & (NA ) & (1e-04 ) & (0 ) & (NA ) & (0.0142 ) & (NA ) & (0 ) \tabularnewline
Estimates ( 5 ) & NA & NA & NA & NA & NA & NA & NA \tabularnewline
(p-val) & (NA ) & (NA ) & (NA ) & (NA ) & (NA ) & (NA ) & (NA ) \tabularnewline
Estimates ( 6 ) & NA & NA & NA & NA & NA & NA & NA \tabularnewline
(p-val) & (NA ) & (NA ) & (NA ) & (NA ) & (NA ) & (NA ) & (NA ) \tabularnewline
Estimates ( 7 ) & NA & NA & NA & NA & NA & NA & NA \tabularnewline
(p-val) & (NA ) & (NA ) & (NA ) & (NA ) & (NA ) & (NA ) & (NA ) \tabularnewline
Estimates ( 8 ) & NA & NA & NA & NA & NA & NA & NA \tabularnewline
(p-val) & (NA ) & (NA ) & (NA ) & (NA ) & (NA ) & (NA ) & (NA ) \tabularnewline
Estimates ( 9 ) & NA & NA & NA & NA & NA & NA & NA \tabularnewline
(p-val) & (NA ) & (NA ) & (NA ) & (NA ) & (NA ) & (NA ) & (NA ) \tabularnewline
Estimates ( 10 ) & NA & NA & NA & NA & NA & NA & NA \tabularnewline
(p-val) & (NA ) & (NA ) & (NA ) & (NA ) & (NA ) & (NA ) & (NA ) \tabularnewline
Estimates ( 11 ) & NA & NA & NA & NA & NA & NA & NA \tabularnewline
(p-val) & (NA ) & (NA ) & (NA ) & (NA ) & (NA ) & (NA ) & (NA ) \tabularnewline
Estimates ( 12 ) & NA & NA & NA & NA & NA & NA & NA \tabularnewline
(p-val) & (NA ) & (NA ) & (NA ) & (NA ) & (NA ) & (NA ) & (NA ) \tabularnewline
Estimates ( 13 ) & NA & NA & NA & NA & NA & NA & NA \tabularnewline
(p-val) & (NA ) & (NA ) & (NA ) & (NA ) & (NA ) & (NA ) & (NA ) \tabularnewline
\hline
\end{tabular}
%Source: https://freestatistics.org/blog/index.php?pk=34347&T=1

[TABLE]
[ROW][C]ARIMA Parameter Estimation and Backward Selection[/C][/ROW]
[ROW][C]Iteration[/C][C]ar1[/C][C]ar2[/C][C]ar3[/C][C]ma1[/C][C]sar1[/C][C]sar2[/C][C]sma1[/C][/ROW]
[ROW][C]Estimates ( 1 )[/C][C]0.1677[/C][C]0.2959[/C][C]0.5362[/C][C]-0.2522[/C][C]0.3395[/C][C]-0.2338[/C][C]-0.9425[/C][/ROW]
[ROW][C](p-val)[/C][C](0.3248 )[/C][C](0.0176 )[/C][C](5e-04 )[/C][C](0.1897 )[/C][C](0.1198 )[/C][C](0.3133 )[/C][C](0.0464 )[/C][/ROW]
[ROW][C]Estimates ( 2 )[/C][C]0[/C][C]0.3634[/C][C]0.6346[/C][C]-0.1132[/C][C]0.2895[/C][C]-0.2603[/C][C]-0.8253[/C][/ROW]
[ROW][C](p-val)[/C][C](NA )[/C][C](3e-04 )[/C][C](0 )[/C][C](0.4881 )[/C][C](0.2147 )[/C][C](0.2499 )[/C][C](0 )[/C][/ROW]
[ROW][C]Estimates ( 3 )[/C][C]0[/C][C]0.3641[/C][C]0.6335[/C][C]0[/C][C]0.3252[/C][C]-0.2722[/C][C]-0.8402[/C][/ROW]
[ROW][C](p-val)[/C][C](NA )[/C][C](1e-04 )[/C][C](0 )[/C][C](NA )[/C][C](0.137 )[/C][C](0.2219 )[/C][C](1e-04 )[/C][/ROW]
[ROW][C]Estimates ( 4 )[/C][C]0[/C][C]0.3953[/C][C]0.6358[/C][C]0[/C][C]0.4763[/C][C]0[/C][C]-0.9999[/C][/ROW]
[ROW][C](p-val)[/C][C](NA )[/C][C](1e-04 )[/C][C](0 )[/C][C](NA )[/C][C](0.0142 )[/C][C](NA )[/C][C](0 )[/C][/ROW]
[ROW][C]Estimates ( 5 )[/C][C]NA[/C][C]NA[/C][C]NA[/C][C]NA[/C][C]NA[/C][C]NA[/C][C]NA[/C][/ROW]
[ROW][C](p-val)[/C][C](NA )[/C][C](NA )[/C][C](NA )[/C][C](NA )[/C][C](NA )[/C][C](NA )[/C][C](NA )[/C][/ROW]
[ROW][C]Estimates ( 6 )[/C][C]NA[/C][C]NA[/C][C]NA[/C][C]NA[/C][C]NA[/C][C]NA[/C][C]NA[/C][/ROW]
[ROW][C](p-val)[/C][C](NA )[/C][C](NA )[/C][C](NA )[/C][C](NA )[/C][C](NA )[/C][C](NA )[/C][C](NA )[/C][/ROW]
[ROW][C]Estimates ( 7 )[/C][C]NA[/C][C]NA[/C][C]NA[/C][C]NA[/C][C]NA[/C][C]NA[/C][C]NA[/C][/ROW]
[ROW][C](p-val)[/C][C](NA )[/C][C](NA )[/C][C](NA )[/C][C](NA )[/C][C](NA )[/C][C](NA )[/C][C](NA )[/C][/ROW]
[ROW][C]Estimates ( 8 )[/C][C]NA[/C][C]NA[/C][C]NA[/C][C]NA[/C][C]NA[/C][C]NA[/C][C]NA[/C][/ROW]
[ROW][C](p-val)[/C][C](NA )[/C][C](NA )[/C][C](NA )[/C][C](NA )[/C][C](NA )[/C][C](NA )[/C][C](NA )[/C][/ROW]
[ROW][C]Estimates ( 9 )[/C][C]NA[/C][C]NA[/C][C]NA[/C][C]NA[/C][C]NA[/C][C]NA[/C][C]NA[/C][/ROW]
[ROW][C](p-val)[/C][C](NA )[/C][C](NA )[/C][C](NA )[/C][C](NA )[/C][C](NA )[/C][C](NA )[/C][C](NA )[/C][/ROW]
[ROW][C]Estimates ( 10 )[/C][C]NA[/C][C]NA[/C][C]NA[/C][C]NA[/C][C]NA[/C][C]NA[/C][C]NA[/C][/ROW]
[ROW][C](p-val)[/C][C](NA )[/C][C](NA )[/C][C](NA )[/C][C](NA )[/C][C](NA )[/C][C](NA )[/C][C](NA )[/C][/ROW]
[ROW][C]Estimates ( 11 )[/C][C]NA[/C][C]NA[/C][C]NA[/C][C]NA[/C][C]NA[/C][C]NA[/C][C]NA[/C][/ROW]
[ROW][C](p-val)[/C][C](NA )[/C][C](NA )[/C][C](NA )[/C][C](NA )[/C][C](NA )[/C][C](NA )[/C][C](NA )[/C][/ROW]
[ROW][C]Estimates ( 12 )[/C][C]NA[/C][C]NA[/C][C]NA[/C][C]NA[/C][C]NA[/C][C]NA[/C][C]NA[/C][/ROW]
[ROW][C](p-val)[/C][C](NA )[/C][C](NA )[/C][C](NA )[/C][C](NA )[/C][C](NA )[/C][C](NA )[/C][C](NA )[/C][/ROW]
[ROW][C]Estimates ( 13 )[/C][C]NA[/C][C]NA[/C][C]NA[/C][C]NA[/C][C]NA[/C][C]NA[/C][C]NA[/C][/ROW]
[ROW][C](p-val)[/C][C](NA )[/C][C](NA )[/C][C](NA )[/C][C](NA )[/C][C](NA )[/C][C](NA )[/C][C](NA )[/C][/ROW]
[/TABLE]
Source: https://freestatistics.org/blog/index.php?pk=34347&T=1

Globally Unique Identifier (entire table): ba.freestatistics.org/blog/index.php?pk=34347&T=1

As an alternative you can also use a QR Code:  

The GUIDs for individual cells are displayed in the table below:

ARIMA Parameter Estimation and Backward Selection
Iterationar1ar2ar3ma1sar1sar2sma1
Estimates ( 1 )0.16770.29590.5362-0.25220.3395-0.2338-0.9425
(p-val)(0.3248 )(0.0176 )(5e-04 )(0.1897 )(0.1198 )(0.3133 )(0.0464 )
Estimates ( 2 )00.36340.6346-0.11320.2895-0.2603-0.8253
(p-val)(NA )(3e-04 )(0 )(0.4881 )(0.2147 )(0.2499 )(0 )
Estimates ( 3 )00.36410.633500.3252-0.2722-0.8402
(p-val)(NA )(1e-04 )(0 )(NA )(0.137 )(0.2219 )(1e-04 )
Estimates ( 4 )00.39530.635800.47630-0.9999
(p-val)(NA )(1e-04 )(0 )(NA )(0.0142 )(NA )(0 )
Estimates ( 5 )NANANANANANANA
(p-val)(NA )(NA )(NA )(NA )(NA )(NA )(NA )
Estimates ( 6 )NANANANANANANA
(p-val)(NA )(NA )(NA )(NA )(NA )(NA )(NA )
Estimates ( 7 )NANANANANANANA
(p-val)(NA )(NA )(NA )(NA )(NA )(NA )(NA )
Estimates ( 8 )NANANANANANANA
(p-val)(NA )(NA )(NA )(NA )(NA )(NA )(NA )
Estimates ( 9 )NANANANANANANA
(p-val)(NA )(NA )(NA )(NA )(NA )(NA )(NA )
Estimates ( 10 )NANANANANANANA
(p-val)(NA )(NA )(NA )(NA )(NA )(NA )(NA )
Estimates ( 11 )NANANANANANANA
(p-val)(NA )(NA )(NA )(NA )(NA )(NA )(NA )
Estimates ( 12 )NANANANANANANA
(p-val)(NA )(NA )(NA )(NA )(NA )(NA )(NA )
Estimates ( 13 )NANANANANANANA
(p-val)(NA )(NA )(NA )(NA )(NA )(NA )(NA )


Estimated ARIMA Residuals
Value
15.4691282859677
34.2996675106348
-238.209522954599
387.020317650704
-98.5176697145262
-44.3694576648198
783.987858756855
11.1862348135376
172.651805196371
1020.32327869547
800.593565020378
-484.343985425235
737.457677839988
55.5609422808023
822.189704277798
-116.132771305324
-98.586734276139
465.188518947078
581.544809079795
-111.080374662329
-735.880531457096
-131.555749782164
295.376771032459
353.720857097988
-269.780936411349
-1013.91960500132
75.1837769724952
830.836991051352
-783.56420833338
446.58677270943
943.811327734552
890.546384991281
-491.633709949806
881.630403124671
-1509.65208842739
627.931421750767
467.791508841453
499.317207939511
-413.690774702081
-631.993062988557
571.140686045693
472.976253932897
-920.513799147452
4.46328359127034
14.5445053225582
541.889750009112
24.9035548828124
586.484226837517
631.907811031939
539.941413883246

\begin{tabular}{lllllllll}
\hline
Estimated ARIMA Residuals \tabularnewline
Value \tabularnewline
15.4691282859677 \tabularnewline
34.2996675106348 \tabularnewline
-238.209522954599 \tabularnewline
387.020317650704 \tabularnewline
-98.5176697145262 \tabularnewline
-44.3694576648198 \tabularnewline
783.987858756855 \tabularnewline
11.1862348135376 \tabularnewline
172.651805196371 \tabularnewline
1020.32327869547 \tabularnewline
800.593565020378 \tabularnewline
-484.343985425235 \tabularnewline
737.457677839988 \tabularnewline
55.5609422808023 \tabularnewline
822.189704277798 \tabularnewline
-116.132771305324 \tabularnewline
-98.586734276139 \tabularnewline
465.188518947078 \tabularnewline
581.544809079795 \tabularnewline
-111.080374662329 \tabularnewline
-735.880531457096 \tabularnewline
-131.555749782164 \tabularnewline
295.376771032459 \tabularnewline
353.720857097988 \tabularnewline
-269.780936411349 \tabularnewline
-1013.91960500132 \tabularnewline
75.1837769724952 \tabularnewline
830.836991051352 \tabularnewline
-783.56420833338 \tabularnewline
446.58677270943 \tabularnewline
943.811327734552 \tabularnewline
890.546384991281 \tabularnewline
-491.633709949806 \tabularnewline
881.630403124671 \tabularnewline
-1509.65208842739 \tabularnewline
627.931421750767 \tabularnewline
467.791508841453 \tabularnewline
499.317207939511 \tabularnewline
-413.690774702081 \tabularnewline
-631.993062988557 \tabularnewline
571.140686045693 \tabularnewline
472.976253932897 \tabularnewline
-920.513799147452 \tabularnewline
4.46328359127034 \tabularnewline
14.5445053225582 \tabularnewline
541.889750009112 \tabularnewline
24.9035548828124 \tabularnewline
586.484226837517 \tabularnewline
631.907811031939 \tabularnewline
539.941413883246 \tabularnewline
\hline
\end{tabular}
%Source: https://freestatistics.org/blog/index.php?pk=34347&T=2

[TABLE]
[ROW][C]Estimated ARIMA Residuals[/C][/ROW]
[ROW][C]Value[/C][/ROW]
[ROW][C]15.4691282859677[/C][/ROW]
[ROW][C]34.2996675106348[/C][/ROW]
[ROW][C]-238.209522954599[/C][/ROW]
[ROW][C]387.020317650704[/C][/ROW]
[ROW][C]-98.5176697145262[/C][/ROW]
[ROW][C]-44.3694576648198[/C][/ROW]
[ROW][C]783.987858756855[/C][/ROW]
[ROW][C]11.1862348135376[/C][/ROW]
[ROW][C]172.651805196371[/C][/ROW]
[ROW][C]1020.32327869547[/C][/ROW]
[ROW][C]800.593565020378[/C][/ROW]
[ROW][C]-484.343985425235[/C][/ROW]
[ROW][C]737.457677839988[/C][/ROW]
[ROW][C]55.5609422808023[/C][/ROW]
[ROW][C]822.189704277798[/C][/ROW]
[ROW][C]-116.132771305324[/C][/ROW]
[ROW][C]-98.586734276139[/C][/ROW]
[ROW][C]465.188518947078[/C][/ROW]
[ROW][C]581.544809079795[/C][/ROW]
[ROW][C]-111.080374662329[/C][/ROW]
[ROW][C]-735.880531457096[/C][/ROW]
[ROW][C]-131.555749782164[/C][/ROW]
[ROW][C]295.376771032459[/C][/ROW]
[ROW][C]353.720857097988[/C][/ROW]
[ROW][C]-269.780936411349[/C][/ROW]
[ROW][C]-1013.91960500132[/C][/ROW]
[ROW][C]75.1837769724952[/C][/ROW]
[ROW][C]830.836991051352[/C][/ROW]
[ROW][C]-783.56420833338[/C][/ROW]
[ROW][C]446.58677270943[/C][/ROW]
[ROW][C]943.811327734552[/C][/ROW]
[ROW][C]890.546384991281[/C][/ROW]
[ROW][C]-491.633709949806[/C][/ROW]
[ROW][C]881.630403124671[/C][/ROW]
[ROW][C]-1509.65208842739[/C][/ROW]
[ROW][C]627.931421750767[/C][/ROW]
[ROW][C]467.791508841453[/C][/ROW]
[ROW][C]499.317207939511[/C][/ROW]
[ROW][C]-413.690774702081[/C][/ROW]
[ROW][C]-631.993062988557[/C][/ROW]
[ROW][C]571.140686045693[/C][/ROW]
[ROW][C]472.976253932897[/C][/ROW]
[ROW][C]-920.513799147452[/C][/ROW]
[ROW][C]4.46328359127034[/C][/ROW]
[ROW][C]14.5445053225582[/C][/ROW]
[ROW][C]541.889750009112[/C][/ROW]
[ROW][C]24.9035548828124[/C][/ROW]
[ROW][C]586.484226837517[/C][/ROW]
[ROW][C]631.907811031939[/C][/ROW]
[ROW][C]539.941413883246[/C][/ROW]
[/TABLE]
Source: https://freestatistics.org/blog/index.php?pk=34347&T=2

Globally Unique Identifier (entire table): ba.freestatistics.org/blog/index.php?pk=34347&T=2

As an alternative you can also use a QR Code:  

The GUIDs for individual cells are displayed in the table below:

Estimated ARIMA Residuals
Value
15.4691282859677
34.2996675106348
-238.209522954599
387.020317650704
-98.5176697145262
-44.3694576648198
783.987858756855
11.1862348135376
172.651805196371
1020.32327869547
800.593565020378
-484.343985425235
737.457677839988
55.5609422808023
822.189704277798
-116.132771305324
-98.586734276139
465.188518947078
581.544809079795
-111.080374662329
-735.880531457096
-131.555749782164
295.376771032459
353.720857097988
-269.780936411349
-1013.91960500132
75.1837769724952
830.836991051352
-783.56420833338
446.58677270943
943.811327734552
890.546384991281
-491.633709949806
881.630403124671
-1509.65208842739
627.931421750767
467.791508841453
499.317207939511
-413.690774702081
-631.993062988557
571.140686045693
472.976253932897
-920.513799147452
4.46328359127034
14.5445053225582
541.889750009112
24.9035548828124
586.484226837517
631.907811031939
539.941413883246


Parameters (Session):
par1 = FALSE ; par2 = 1 ; par3 = 0 ; par4 = 1 ; par5 = 12 ; par6 = 3 ; par7 = 1 ; par8 = 2 ; par9 = 1 ;
Parameters (R input):
par1 = FALSE ; par2 = 1 ; par3 = 0 ; par4 = 1 ; par5 = 12 ; par6 = 3 ; par7 = 1 ; par8 = 2 ; par9 = 1 ;
R code (references can be found in the software module):
library(lattice)
if (par1 == 'TRUE') par1 <- TRUE
if (par1 == 'FALSE') par1 <- FALSE
par2 <- as.numeric(par2) #Box-Cox lambda transformation parameter
par3 <- as.numeric(par3) #degree of non-seasonal differencing
par4 <- as.numeric(par4) #degree of seasonal differencing
par5 <- as.numeric(par5) #seasonal period
par6 <- as.numeric(par6) #degree (p) of the non-seasonal AR(p) polynomial
par7 <- as.numeric(par7) #degree (q) of the non-seasonal MA(q) polynomial
par8 <- as.numeric(par8) #degree (P) of the seasonal AR(P) polynomial
par9 <- as.numeric(par9) #degree (Q) of the seasonal MA(Q) polynomial
armaGR <- function(arima.out, names, n){
try1 <- arima.out$coef
try2 <- sqrt(diag(arima.out$var.coef))
try.data.frame <- data.frame(matrix(NA,ncol=4,nrow=length(names)))
dimnames(try.data.frame) <- list(names,c('coef','std','tstat','pv'))
try.data.frame[,1] <- try1
for(i in 1:length(try2)) try.data.frame[which(rownames(try.data.frame)==names(try2)[i]),2] <- try2[i]
try.data.frame[,3] <- try.data.frame[,1] / try.data.frame[,2]
try.data.frame[,4] <- round((1-pt(abs(try.data.frame[,3]),df=n-(length(try2)+1)))*2,5)
vector <- rep(NA,length(names))
vector[is.na(try.data.frame[,4])] <- 0
maxi <- which.max(try.data.frame[,4])
continue <- max(try.data.frame[,4],na.rm=TRUE) > .05
vector[maxi] <- 0
list(summary=try.data.frame,next.vector=vector,continue=continue)
}
arimaSelect <- function(series, order=c(13,0,0), seasonal=list(order=c(2,0,0),period=12), include.mean=F){
nrc <- order[1]+order[3]+seasonal$order[1]+seasonal$order[3]
coeff <- matrix(NA, nrow=nrc*2, ncol=nrc)
pval <- matrix(NA, nrow=nrc*2, ncol=nrc)
mylist <- rep(list(NULL), nrc)
names <- NULL
if(order[1] > 0) names <- paste('ar',1:order[1],sep='')
if(order[3] > 0) names <- c( names , paste('ma',1:order[3],sep='') )
if(seasonal$order[1] > 0) names <- c(names, paste('sar',1:seasonal$order[1],sep=''))
if(seasonal$order[3] > 0) names <- c(names, paste('sma',1:seasonal$order[3],sep=''))
arima.out <- arima(series, order=order, seasonal=seasonal, include.mean=include.mean, method='ML')
mylist[[1]] <- arima.out
last.arma <- armaGR(arima.out, names, length(series))
mystop <- FALSE
i <- 1
coeff[i,] <- last.arma[[1]][,1]
pval [i,] <- last.arma[[1]][,4]
i <- 2
aic <- arima.out$aic
while(!mystop){
mylist[[i]] <- arima.out
arima.out <- arima(series, order=order, seasonal=seasonal, include.mean=include.mean, method='ML', fixed=last.arma$next.vector)
aic <- c(aic, arima.out$aic)
last.arma <- armaGR(arima.out, names, length(series))
mystop <- !last.arma$continue
coeff[i,] <- last.arma[[1]][,1]
pval [i,] <- last.arma[[1]][,4]
i <- i+1
}
list(coeff, pval, mylist, aic=aic)
}
arimaSelectplot <- function(arimaSelect.out,noms,choix){
noms <- names(arimaSelect.out[[3]][[1]]$coef)
coeff <- arimaSelect.out[[1]]
k <- min(which(is.na(coeff[,1])))-1
coeff <- coeff[1:k,]
pval <- arimaSelect.out[[2]][1:k,]
aic <- arimaSelect.out$aic[1:k]
coeff[coeff==0] <- NA
n <- ncol(coeff)
if(missing(choix)) choix <- k
layout(matrix(c(1,1,1,2,
3,3,3,2,
3,3,3,4,
5,6,7,7),nr=4),
widths=c(10,35,45,15),
heights=c(30,30,15,15))
couleurs <- rainbow(75)[1:50]#(50)
ticks <- pretty(coeff)
par(mar=c(1,1,3,1))
plot(aic,k:1-.5,type='o',pch=21,bg='blue',cex=2,axes=F,lty=2,xpd=NA)
points(aic[choix],k-choix+.5,pch=21,cex=4,bg=2,xpd=NA)
title('aic',line=2)
par(mar=c(3,0,0,0))
plot(0,axes=F,xlab='',ylab='',xlim=range(ticks),ylim=c(.1,1))
rect(xleft = min(ticks) + (0:49)/50*(max(ticks)-min(ticks)),
xright = min(ticks) + (1:50)/50*(max(ticks)-min(ticks)),
ytop = rep(1,50),
ybottom= rep(0,50),col=couleurs,border=NA)
axis(1,ticks)
rect(xleft=min(ticks),xright=max(ticks),ytop=1,ybottom=0)
text(mean(coeff,na.rm=T),.5,'coefficients',cex=2,font=2)
par(mar=c(1,1,3,1))
image(1:n,1:k,t(coeff[k:1,]),axes=F,col=couleurs,zlim=range(ticks))
for(i in 1:n) for(j in 1:k) if(!is.na(coeff[j,i])) {
if(pval[j,i]<.01) symb = 'green'
else if( (pval[j,i]<.05) & (pval[j,i]>=.01)) symb = 'orange'
else if( (pval[j,i]<.1) & (pval[j,i]>=.05)) symb = 'red'
else symb = 'black'
polygon(c(i+.5 ,i+.2 ,i+.5 ,i+.5),
c(k-j+0.5,k-j+0.5,k-j+0.8,k-j+0.5),
col=symb)
if(j==choix) {
rect(xleft=i-.5,
xright=i+.5,
ybottom=k-j+1.5,
ytop=k-j+.5,
lwd=4)
text(i,
k-j+1,
round(coeff[j,i],2),
cex=1.2,
font=2)
}
else{
rect(xleft=i-.5,xright=i+.5,ybottom=k-j+1.5,ytop=k-j+.5)
text(i,k-j+1,round(coeff[j,i],2),cex=1.2,font=1)
}
}
axis(3,1:n,noms)
par(mar=c(0.5,0,0,0.5))
plot(0,axes=F,xlab='',ylab='',type='n',xlim=c(0,8),ylim=c(-.2,.8))
cols <- c('green','orange','red','black')
niv <- c('0','0.01','0.05','0.1')
for(i in 0:3){
polygon(c(1+2*i ,1+2*i ,1+2*i-.5 ,1+2*i),
c(.4 ,.7 , .4 , .4),
col=cols[i+1])
text(2*i,0.5,niv[i+1],cex=1.5)
}
text(8,.5,1,cex=1.5)
text(4,0,'p-value',cex=2)
box()
residus <- arimaSelect.out[[3]][[choix]]$res
par(mar=c(1,2,4,1))
acf(residus,main='')
title('acf',line=.5)
par(mar=c(1,2,4,1))
pacf(residus,main='')
title('pacf',line=.5)
par(mar=c(2,2,4,1))
qqnorm(residus,main='')
title('qq-norm',line=.5)
qqline(residus)
residus
}
if (par2 == 0) x <- log(x)
if (par2 != 0) x <- x^par2
(selection <- arimaSelect(x, order=c(par6,par3,par7), seasonal=list(order=c(par8,par4,par9), period=par5)))
bitmap(file='test1.png')
resid <- arimaSelectplot(selection)
dev.off()
resid
bitmap(file='test2.png')
acf(resid,length(resid)/2, main='Residual Autocorrelation Function')
dev.off()
bitmap(file='test3.png')
pacf(resid,length(resid)/2, main='Residual Partial Autocorrelation Function')
dev.off()
bitmap(file='test4.png')
cpgram(resid, main='Residual Cumulative Periodogram')
dev.off()
bitmap(file='test5.png')
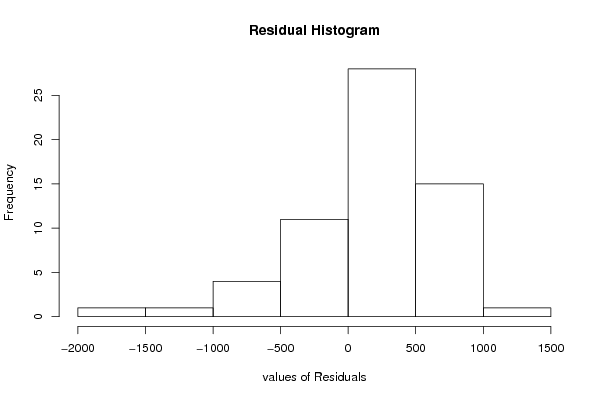
hist(resid, main='Residual Histogram', xlab='values of Residuals')
dev.off()
bitmap(file='test6.png')
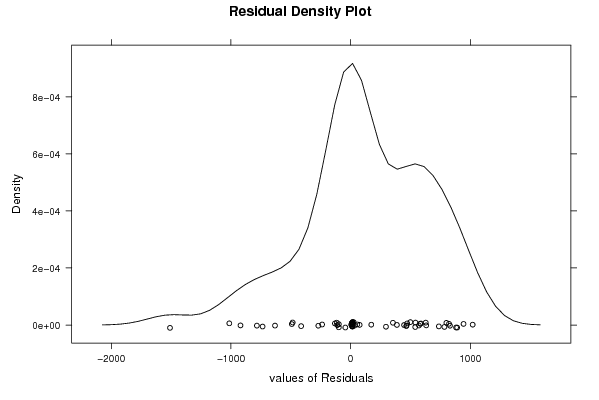
densityplot(~resid,col='black',main='Residual Density Plot', xlab='values of Residuals')
dev.off()
bitmap(file='test7.png')
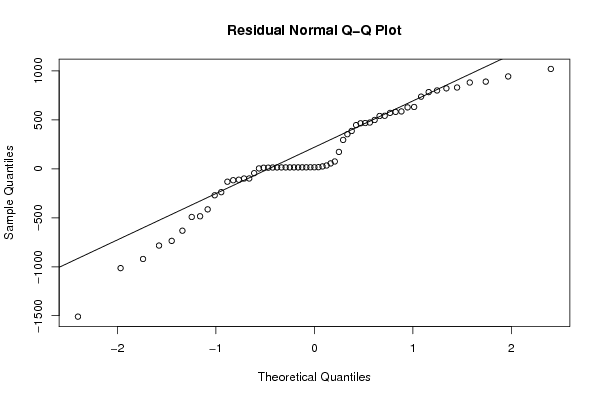
qqnorm(resid, main='Residual Normal Q-Q Plot')
qqline(resid)
dev.off()
ncols <- length(selection[[1]][1,])
nrows <- length(selection[[2]][,1])-1
load(file='createtable')
a<-table.start()
a<-table.row.start(a)
a<-table.element(a,'ARIMA Parameter Estimation and Backward Selection', ncols+1,TRUE)
a<-table.row.end(a)
a<-table.row.start(a)
a<-table.element(a,'Iteration', header=TRUE)
for (i in 1:ncols) {
a<-table.element(a,names(selection[[3]][[1]]$coef)[i],header=TRUE)
}
a<-table.row.end(a)
for (j in 1:nrows) {
a<-table.row.start(a)
mydum <- 'Estimates ('
mydum <- paste(mydum,j)
mydum <- paste(mydum,')')
a<-table.element(a,mydum, header=TRUE)
for (i in 1:ncols) {
a<-table.element(a,round(selection[[1]][j,i],4))
}
a<-table.row.end(a)
a<-table.row.start(a)
a<-table.element(a,'(p-val)', header=TRUE)
for (i in 1:ncols) {
mydum <- '('
mydum <- paste(mydum,round(selection[[2]][j,i],4),sep='')
mydum <- paste(mydum,')')
a<-table.element(a,mydum)
}
a<-table.row.end(a)
}
a<-table.end(a)
table.save(a,file='mytable.tab')
a<-table.start()
a<-table.row.start(a)
a<-table.element(a,'Estimated ARIMA Residuals', 1,TRUE)
a<-table.row.end(a)
a<-table.row.start(a)
a<-table.element(a,'Value', 1,TRUE)
a<-table.row.end(a)
for (i in (par4*par5+par3):length(resid)) {
a<-table.row.start(a)
a<-table.element(a,resid[i])
a<-table.row.end(a)
}
a<-table.end(a)
table.save(a,file='mytable1.tab')