Free Statistics
of Irreproducible Research!
Description of Statistical Computation | |||||||||||||||||||||
|---|---|---|---|---|---|---|---|---|---|---|---|---|---|---|---|---|---|---|---|---|---|
| Author's title | |||||||||||||||||||||
| Author | *Unverified author* | ||||||||||||||||||||
| R Software Module | rwasp_backtobackhist.wasp | ||||||||||||||||||||
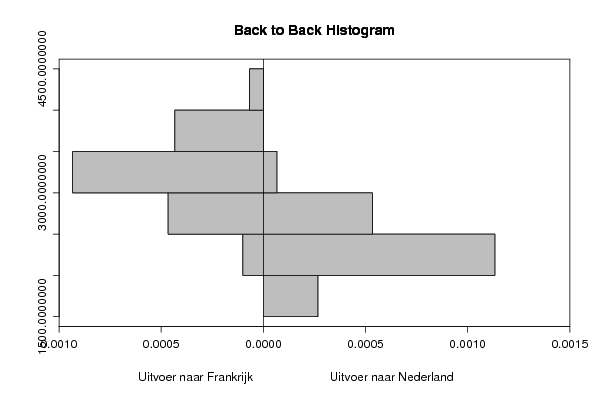
| Title produced by software | Back to Back Histogram | ||||||||||||||||||||
| Date of computation | Sun, 21 Dec 2008 11:54:06 -0700 | ||||||||||||||||||||
| Cite this page as follows | Statistical Computations at FreeStatistics.org, Office for Research Development and Education, URL https://freestatistics.org/blog/index.php?v=date/2008/Dec/21/t1229885683sw85wwltvqmuz2p.htm/, Retrieved Sat, 18 May 2024 21:28:15 +0000 | ||||||||||||||||||||
| Statistical Computations at FreeStatistics.org, Office for Research Development and Education, URL https://freestatistics.org/blog/index.php?pk=35749, Retrieved Sat, 18 May 2024 21:28:15 +0000 | |||||||||||||||||||||
| QR Codes: | |||||||||||||||||||||
|
| |||||||||||||||||||||
| Original text written by user: | |||||||||||||||||||||
| IsPrivate? | No (this computation is public) | ||||||||||||||||||||
| User-defined keywords | |||||||||||||||||||||
| Estimated Impact | 166 | ||||||||||||||||||||
Tree of Dependent Computations | |||||||||||||||||||||
| Family? (F = Feedback message, R = changed R code, M = changed R Module, P = changed Parameters, D = changed Data) | |||||||||||||||||||||
| - [Back to Back Histogram] [B-t-B-histogram p...] [2007-11-09 11:02:25] [d255a97fd5d03c71781b63d0b6fcea5d] - PD [Back to Back Histogram] [B2B: Frankrijk, I...] [2008-12-21 18:54:06] [4ef5c191fa12c0a7497d8cf4a02b2cfe] [Current] - P [Back to Back Histogram] [B2B Frankrijk Italie] [2008-12-21 18:56:41] [d7f17de546c455a6cc3e244ffe795733] - [Back to Back Histogram] [B2B Frankrijk Ned...] [2008-12-21 18:58:43] [d7f17de546c455a6cc3e244ffe795733] - D [Back to Back Histogram] [B2B Frankrijk Den...] [2008-12-21 19:00:16] [d7f17de546c455a6cc3e244ffe795733] | |||||||||||||||||||||
| Feedback Forum | |||||||||||||||||||||
Post a new message | |||||||||||||||||||||
Dataset | |||||||||||||||||||||
| Dataseries X: | |||||||||||||||||||||
3755.3 3001.4 3815.7 4034.4 3590.4 4176.4 3943.5 3934.2 3859.2 3300.5 3800.0 3958.7 3451.4 2678.6 3279.3 3550.3 3294.4 3202.2 3486.4 3139.7 3283.2 2933.6 3391.6 3301.3 3257.6 2537.0 2970.5 3481.9 3361.1 3123.2 3843.3 3153.0 3365.1 3528.5 3506.7 3146.6 3195.1 2424.0 2676.3 3174.6 3067.4 3121.2 3517.7 3014.7 2949.6 2990.3 3084.1 3077.9 3023.6 2226.2 2628.3 3088.7 2551.4 2856.7 3176.2 2663.1 2630.4 2584.4 2472.2 2895.6 | |||||||||||||||||||||
| Dataseries Y: | |||||||||||||||||||||
3032.9 2630.8 2851.4 3029.7 2856.4 2899.2 2784.9 2764.2 2770.0 2335.6 2700.9 2941.0 2489.2 2378.3 2404.6 2661.4 2559.3 2431.0 2670.2 2333.8 2441.9 2215.9 2482.9 2520.4 2423.8 2262.3 2190.8 2606.3 2547.9 2281.4 2594.1 2174.8 2158.6 2282.5 2368.1 2316.1 2404.9 2025.7 1931.9 2376.5 2091.7 2232.5 2355.8 2066.1 2014.4 2330.4 2198.2 2287.0 2371.4 1872.4 1983.8 2285.6 1965.0 2213.0 2246.3 1889.4 1907.4 1955.1 1863.6 2161.5 | |||||||||||||||||||||
Tables (Output of Computation) | |||||||||||||||||||||
| |||||||||||||||||||||
Figures (Output of Computation) | |||||||||||||||||||||
Input Parameters & R Code | |||||||||||||||||||||
| Parameters (Session): | |||||||||||||||||||||
| par1 = grey ; par2 = grey ; par3 = TRUE ; par4 = Uitvoer naar Frankrijk ; par5 = Uitvoer naar Nederland ; | |||||||||||||||||||||
| Parameters (R input): | |||||||||||||||||||||
| par1 = grey ; par2 = grey ; par3 = TRUE ; par4 = Uitvoer naar Frankrijk ; par5 = Uitvoer naar Nederland ; | |||||||||||||||||||||
| R code (references can be found in the software module): | |||||||||||||||||||||
if (par3 == 'TRUE') par3 <- TRUE | |||||||||||||||||||||