Free Statistics

of Irreproducible Research!

Author's title

Author*Unverified author*
R Software Modulerwasp_autocorrelation.wasp
Title produced by software(Partial) Autocorrelation Function
Date of computationSun, 21 Dec 2008 12:55:58 -0700
Cite this page as followsStatistical Computations at FreeStatistics.org, Office for Research Development and Education, URL https://freestatistics.org/blog/index.php?v=date/2008/Dec/21/t12298894027dzl9t54lhxrzvr.htm/, Retrieved Sat, 18 May 2024 21:19:51 +0000
Statistical Computations at FreeStatistics.org, Office for Research Development and Education, URL https://freestatistics.org/blog/index.php?pk=35792, Retrieved Sat, 18 May 2024 21:19:51 +0000
QR Codes:

Original text written by user:
IsPrivate?No (this computation is public)
User-defined keywords
Estimated Impact150
Family? (F = Feedback message, R = changed R code, M = changed R Module, P = changed Parameters, D = changed Data)
-     [Standard Deviation-Mean Plot] [TAAK] [2008-12-16 21:20:43] [f3161d5a04a14312cd010aa8f92941cc]
- RMPD    [(Partial) Autocorrelation Function] [vfdgd] [2008-12-21 19:55:58] [7a2afff08a618fdf6611a1bb6e1c3da4] [Current]
Feedback Forum

Post a new message
Dataseries X:
485
464
460
467
460
448
443
436
431
484
510
513
503
471
471
476
475
470
461
455
456
517
525
523
519
509
512
519
517
510
509
501
507
569
580
578
565
547
555
562
561
555
544
537
543
594
611
613
611
594
595
591
589
584
573
567
569
621
629
628
612
595
597
593
590
580
574
573
573
620
626
620
588
566
557
561
549
532
526
511
499
555
565
542
527
510
514
517
508
493
490
469
478
528


Summary of computational transaction
Raw Inputview raw input (R code)
Raw Outputview raw output of R engine
Computing time2 seconds
R Server'Sir Ronald Aylmer Fisher' @ 193.190.124.24

\begin{tabular}{lllllllll}
\hline
Summary of computational transaction \tabularnewline
Raw Input & view raw input (R code)  \tabularnewline
Raw Output & view raw output of R engine  \tabularnewline
Computing time & 2 seconds \tabularnewline
R Server & 'Sir Ronald Aylmer Fisher' @ 193.190.124.24 \tabularnewline
\hline
\end{tabular}
%Source: https://freestatistics.org/blog/index.php?pk=35792&T=0

[TABLE]
[ROW][C]Summary of computational transaction[/C][/ROW]
[ROW][C]Raw Input[/C][C]view raw input (R code) [/C][/ROW]
[ROW][C]Raw Output[/C][C]view raw output of R engine [/C][/ROW]
[ROW][C]Computing time[/C][C]2 seconds[/C][/ROW]
[ROW][C]R Server[/C][C]'Sir Ronald Aylmer Fisher' @ 193.190.124.24[/C][/ROW]
[/TABLE]
Source: https://freestatistics.org/blog/index.php?pk=35792&T=0

Globally Unique Identifier (entire table): ba.freestatistics.org/blog/index.php?pk=35792&T=0

As an alternative you can also use a QR Code:  

The GUIDs for individual cells are displayed in the table below:

Summary of computational transaction
Raw Inputview raw input (R code)
Raw Outputview raw output of R engine
Computing time2 seconds
R Server'Sir Ronald Aylmer Fisher' @ 193.190.124.24


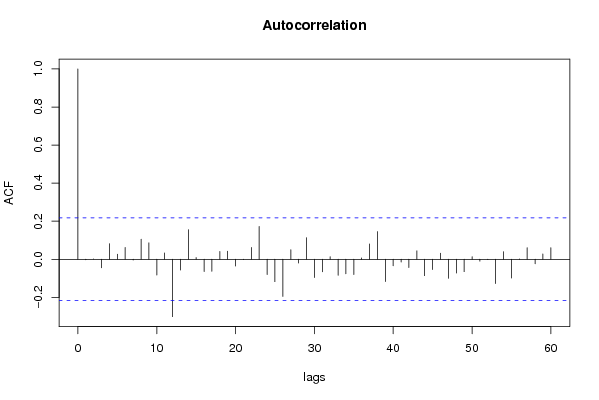
Autocorrelation Function
Time lag kACF(k)T-STATP-value
1-0.002872-0.02580.489722
20.0006090.00550.497822
3-0.044724-0.40250.344183
40.0815590.7340.232525
50.0268140.24130.404957
60.0618690.55680.289592
7-0.004268-0.03840.484728
80.1051220.94610.173455
90.0861640.77550.220158
10-0.082592-0.74330.229717
110.0329660.29670.383729
12-0.301513-2.71360.004064
13-0.056594-0.50930.305948
140.1548171.39340.083662
150.0088680.07980.468292
16-0.064196-0.57780.282513
17-0.06281-0.56530.286719
180.0414250.37280.355126
190.0427420.38470.350742
20-0.035132-0.31620.376337
21-0.001596-0.01440.494289
220.0617670.55590.289906
230.1726761.55410.062032
24-0.079851-0.71870.237211
25-0.117772-1.060.146159
26-0.195232-1.75710.041341
270.05040.45360.325663
28-0.019741-0.17770.429714
290.1134231.02080.155193
30-0.096229-0.86610.194508
31-0.065753-0.59180.277823
320.0129820.11680.453637
33-0.0842-0.75780.225384
34-0.076508-0.68860.246529
35-0.080001-0.720.236795
360.0071110.0640.474563
370.0805540.7250.235276
380.145551.310.096958
39-0.117448-1.0570.14682
40-0.034132-0.30720.379744
41-0.014335-0.1290.448832
42-0.043696-0.39330.34758
430.0443840.39950.345306
44-0.086146-0.77530.220206
45-0.053714-0.48340.315047
460.0315340.28380.388641
47-0.099755-0.89780.185978
48-0.072179-0.64960.25889
49-0.065178-0.58660.279551
500.0129360.11640.453801
51-0.009819-0.08840.464899
52-0.001782-0.0160.493621
53-0.127525-1.14770.12723
540.0392850.35360.362293
55-0.098886-0.890.188059
560.0015750.01420.494362
570.0607950.54720.292888
58-0.023753-0.21380.415629
590.0283330.2550.399687
600.0604190.54380.294046

\begin{tabular}{lllllllll}
\hline
Autocorrelation Function \tabularnewline
Time lag k & ACF(k) & T-STAT & P-value \tabularnewline
1 & -0.002872 & -0.0258 & 0.489722 \tabularnewline
2 & 0.000609 & 0.0055 & 0.497822 \tabularnewline
3 & -0.044724 & -0.4025 & 0.344183 \tabularnewline
4 & 0.081559 & 0.734 & 0.232525 \tabularnewline
5 & 0.026814 & 0.2413 & 0.404957 \tabularnewline
6 & 0.061869 & 0.5568 & 0.289592 \tabularnewline
7 & -0.004268 & -0.0384 & 0.484728 \tabularnewline
8 & 0.105122 & 0.9461 & 0.173455 \tabularnewline
9 & 0.086164 & 0.7755 & 0.220158 \tabularnewline
10 & -0.082592 & -0.7433 & 0.229717 \tabularnewline
11 & 0.032966 & 0.2967 & 0.383729 \tabularnewline
12 & -0.301513 & -2.7136 & 0.004064 \tabularnewline
13 & -0.056594 & -0.5093 & 0.305948 \tabularnewline
14 & 0.154817 & 1.3934 & 0.083662 \tabularnewline
15 & 0.008868 & 0.0798 & 0.468292 \tabularnewline
16 & -0.064196 & -0.5778 & 0.282513 \tabularnewline
17 & -0.06281 & -0.5653 & 0.286719 \tabularnewline
18 & 0.041425 & 0.3728 & 0.355126 \tabularnewline
19 & 0.042742 & 0.3847 & 0.350742 \tabularnewline
20 & -0.035132 & -0.3162 & 0.376337 \tabularnewline
21 & -0.001596 & -0.0144 & 0.494289 \tabularnewline
22 & 0.061767 & 0.5559 & 0.289906 \tabularnewline
23 & 0.172676 & 1.5541 & 0.062032 \tabularnewline
24 & -0.079851 & -0.7187 & 0.237211 \tabularnewline
25 & -0.117772 & -1.06 & 0.146159 \tabularnewline
26 & -0.195232 & -1.7571 & 0.041341 \tabularnewline
27 & 0.0504 & 0.4536 & 0.325663 \tabularnewline
28 & -0.019741 & -0.1777 & 0.429714 \tabularnewline
29 & 0.113423 & 1.0208 & 0.155193 \tabularnewline
30 & -0.096229 & -0.8661 & 0.194508 \tabularnewline
31 & -0.065753 & -0.5918 & 0.277823 \tabularnewline
32 & 0.012982 & 0.1168 & 0.453637 \tabularnewline
33 & -0.0842 & -0.7578 & 0.225384 \tabularnewline
34 & -0.076508 & -0.6886 & 0.246529 \tabularnewline
35 & -0.080001 & -0.72 & 0.236795 \tabularnewline
36 & 0.007111 & 0.064 & 0.474563 \tabularnewline
37 & 0.080554 & 0.725 & 0.235276 \tabularnewline
38 & 0.14555 & 1.31 & 0.096958 \tabularnewline
39 & -0.117448 & -1.057 & 0.14682 \tabularnewline
40 & -0.034132 & -0.3072 & 0.379744 \tabularnewline
41 & -0.014335 & -0.129 & 0.448832 \tabularnewline
42 & -0.043696 & -0.3933 & 0.34758 \tabularnewline
43 & 0.044384 & 0.3995 & 0.345306 \tabularnewline
44 & -0.086146 & -0.7753 & 0.220206 \tabularnewline
45 & -0.053714 & -0.4834 & 0.315047 \tabularnewline
46 & 0.031534 & 0.2838 & 0.388641 \tabularnewline
47 & -0.099755 & -0.8978 & 0.185978 \tabularnewline
48 & -0.072179 & -0.6496 & 0.25889 \tabularnewline
49 & -0.065178 & -0.5866 & 0.279551 \tabularnewline
50 & 0.012936 & 0.1164 & 0.453801 \tabularnewline
51 & -0.009819 & -0.0884 & 0.464899 \tabularnewline
52 & -0.001782 & -0.016 & 0.493621 \tabularnewline
53 & -0.127525 & -1.1477 & 0.12723 \tabularnewline
54 & 0.039285 & 0.3536 & 0.362293 \tabularnewline
55 & -0.098886 & -0.89 & 0.188059 \tabularnewline
56 & 0.001575 & 0.0142 & 0.494362 \tabularnewline
57 & 0.060795 & 0.5472 & 0.292888 \tabularnewline
58 & -0.023753 & -0.2138 & 0.415629 \tabularnewline
59 & 0.028333 & 0.255 & 0.399687 \tabularnewline
60 & 0.060419 & 0.5438 & 0.294046 \tabularnewline
\hline
\end{tabular}
%Source: https://freestatistics.org/blog/index.php?pk=35792&T=1

[TABLE]
[ROW][C]Autocorrelation Function[/C][/ROW]
[ROW][C]Time lag k[/C][C]ACF(k)[/C][C]T-STAT[/C][C]P-value[/C][/ROW]
[ROW][C]1[/C][C]-0.002872[/C][C]-0.0258[/C][C]0.489722[/C][/ROW]
[ROW][C]2[/C][C]0.000609[/C][C]0.0055[/C][C]0.497822[/C][/ROW]
[ROW][C]3[/C][C]-0.044724[/C][C]-0.4025[/C][C]0.344183[/C][/ROW]
[ROW][C]4[/C][C]0.081559[/C][C]0.734[/C][C]0.232525[/C][/ROW]
[ROW][C]5[/C][C]0.026814[/C][C]0.2413[/C][C]0.404957[/C][/ROW]
[ROW][C]6[/C][C]0.061869[/C][C]0.5568[/C][C]0.289592[/C][/ROW]
[ROW][C]7[/C][C]-0.004268[/C][C]-0.0384[/C][C]0.484728[/C][/ROW]
[ROW][C]8[/C][C]0.105122[/C][C]0.9461[/C][C]0.173455[/C][/ROW]
[ROW][C]9[/C][C]0.086164[/C][C]0.7755[/C][C]0.220158[/C][/ROW]
[ROW][C]10[/C][C]-0.082592[/C][C]-0.7433[/C][C]0.229717[/C][/ROW]
[ROW][C]11[/C][C]0.032966[/C][C]0.2967[/C][C]0.383729[/C][/ROW]
[ROW][C]12[/C][C]-0.301513[/C][C]-2.7136[/C][C]0.004064[/C][/ROW]
[ROW][C]13[/C][C]-0.056594[/C][C]-0.5093[/C][C]0.305948[/C][/ROW]
[ROW][C]14[/C][C]0.154817[/C][C]1.3934[/C][C]0.083662[/C][/ROW]
[ROW][C]15[/C][C]0.008868[/C][C]0.0798[/C][C]0.468292[/C][/ROW]
[ROW][C]16[/C][C]-0.064196[/C][C]-0.5778[/C][C]0.282513[/C][/ROW]
[ROW][C]17[/C][C]-0.06281[/C][C]-0.5653[/C][C]0.286719[/C][/ROW]
[ROW][C]18[/C][C]0.041425[/C][C]0.3728[/C][C]0.355126[/C][/ROW]
[ROW][C]19[/C][C]0.042742[/C][C]0.3847[/C][C]0.350742[/C][/ROW]
[ROW][C]20[/C][C]-0.035132[/C][C]-0.3162[/C][C]0.376337[/C][/ROW]
[ROW][C]21[/C][C]-0.001596[/C][C]-0.0144[/C][C]0.494289[/C][/ROW]
[ROW][C]22[/C][C]0.061767[/C][C]0.5559[/C][C]0.289906[/C][/ROW]
[ROW][C]23[/C][C]0.172676[/C][C]1.5541[/C][C]0.062032[/C][/ROW]
[ROW][C]24[/C][C]-0.079851[/C][C]-0.7187[/C][C]0.237211[/C][/ROW]
[ROW][C]25[/C][C]-0.117772[/C][C]-1.06[/C][C]0.146159[/C][/ROW]
[ROW][C]26[/C][C]-0.195232[/C][C]-1.7571[/C][C]0.041341[/C][/ROW]
[ROW][C]27[/C][C]0.0504[/C][C]0.4536[/C][C]0.325663[/C][/ROW]
[ROW][C]28[/C][C]-0.019741[/C][C]-0.1777[/C][C]0.429714[/C][/ROW]
[ROW][C]29[/C][C]0.113423[/C][C]1.0208[/C][C]0.155193[/C][/ROW]
[ROW][C]30[/C][C]-0.096229[/C][C]-0.8661[/C][C]0.194508[/C][/ROW]
[ROW][C]31[/C][C]-0.065753[/C][C]-0.5918[/C][C]0.277823[/C][/ROW]
[ROW][C]32[/C][C]0.012982[/C][C]0.1168[/C][C]0.453637[/C][/ROW]
[ROW][C]33[/C][C]-0.0842[/C][C]-0.7578[/C][C]0.225384[/C][/ROW]
[ROW][C]34[/C][C]-0.076508[/C][C]-0.6886[/C][C]0.246529[/C][/ROW]
[ROW][C]35[/C][C]-0.080001[/C][C]-0.72[/C][C]0.236795[/C][/ROW]
[ROW][C]36[/C][C]0.007111[/C][C]0.064[/C][C]0.474563[/C][/ROW]
[ROW][C]37[/C][C]0.080554[/C][C]0.725[/C][C]0.235276[/C][/ROW]
[ROW][C]38[/C][C]0.14555[/C][C]1.31[/C][C]0.096958[/C][/ROW]
[ROW][C]39[/C][C]-0.117448[/C][C]-1.057[/C][C]0.14682[/C][/ROW]
[ROW][C]40[/C][C]-0.034132[/C][C]-0.3072[/C][C]0.379744[/C][/ROW]
[ROW][C]41[/C][C]-0.014335[/C][C]-0.129[/C][C]0.448832[/C][/ROW]
[ROW][C]42[/C][C]-0.043696[/C][C]-0.3933[/C][C]0.34758[/C][/ROW]
[ROW][C]43[/C][C]0.044384[/C][C]0.3995[/C][C]0.345306[/C][/ROW]
[ROW][C]44[/C][C]-0.086146[/C][C]-0.7753[/C][C]0.220206[/C][/ROW]
[ROW][C]45[/C][C]-0.053714[/C][C]-0.4834[/C][C]0.315047[/C][/ROW]
[ROW][C]46[/C][C]0.031534[/C][C]0.2838[/C][C]0.388641[/C][/ROW]
[ROW][C]47[/C][C]-0.099755[/C][C]-0.8978[/C][C]0.185978[/C][/ROW]
[ROW][C]48[/C][C]-0.072179[/C][C]-0.6496[/C][C]0.25889[/C][/ROW]
[ROW][C]49[/C][C]-0.065178[/C][C]-0.5866[/C][C]0.279551[/C][/ROW]
[ROW][C]50[/C][C]0.012936[/C][C]0.1164[/C][C]0.453801[/C][/ROW]
[ROW][C]51[/C][C]-0.009819[/C][C]-0.0884[/C][C]0.464899[/C][/ROW]
[ROW][C]52[/C][C]-0.001782[/C][C]-0.016[/C][C]0.493621[/C][/ROW]
[ROW][C]53[/C][C]-0.127525[/C][C]-1.1477[/C][C]0.12723[/C][/ROW]
[ROW][C]54[/C][C]0.039285[/C][C]0.3536[/C][C]0.362293[/C][/ROW]
[ROW][C]55[/C][C]-0.098886[/C][C]-0.89[/C][C]0.188059[/C][/ROW]
[ROW][C]56[/C][C]0.001575[/C][C]0.0142[/C][C]0.494362[/C][/ROW]
[ROW][C]57[/C][C]0.060795[/C][C]0.5472[/C][C]0.292888[/C][/ROW]
[ROW][C]58[/C][C]-0.023753[/C][C]-0.2138[/C][C]0.415629[/C][/ROW]
[ROW][C]59[/C][C]0.028333[/C][C]0.255[/C][C]0.399687[/C][/ROW]
[ROW][C]60[/C][C]0.060419[/C][C]0.5438[/C][C]0.294046[/C][/ROW]
[/TABLE]
Source: https://freestatistics.org/blog/index.php?pk=35792&T=1

Globally Unique Identifier (entire table): ba.freestatistics.org/blog/index.php?pk=35792&T=1

As an alternative you can also use a QR Code:  

The GUIDs for individual cells are displayed in the table below:

Autocorrelation Function
Time lag kACF(k)T-STATP-value
1-0.002872-0.02580.489722
20.0006090.00550.497822
3-0.044724-0.40250.344183
40.0815590.7340.232525
50.0268140.24130.404957
60.0618690.55680.289592
7-0.004268-0.03840.484728
80.1051220.94610.173455
90.0861640.77550.220158
10-0.082592-0.74330.229717
110.0329660.29670.383729
12-0.301513-2.71360.004064
13-0.056594-0.50930.305948
140.1548171.39340.083662
150.0088680.07980.468292
16-0.064196-0.57780.282513
17-0.06281-0.56530.286719
180.0414250.37280.355126
190.0427420.38470.350742
20-0.035132-0.31620.376337
21-0.001596-0.01440.494289
220.0617670.55590.289906
230.1726761.55410.062032
24-0.079851-0.71870.237211
25-0.117772-1.060.146159
26-0.195232-1.75710.041341
270.05040.45360.325663
28-0.019741-0.17770.429714
290.1134231.02080.155193
30-0.096229-0.86610.194508
31-0.065753-0.59180.277823
320.0129820.11680.453637
33-0.0842-0.75780.225384
34-0.076508-0.68860.246529
35-0.080001-0.720.236795
360.0071110.0640.474563
370.0805540.7250.235276
380.145551.310.096958
39-0.117448-1.0570.14682
40-0.034132-0.30720.379744
41-0.014335-0.1290.448832
42-0.043696-0.39330.34758
430.0443840.39950.345306
44-0.086146-0.77530.220206
45-0.053714-0.48340.315047
460.0315340.28380.388641
47-0.099755-0.89780.185978
48-0.072179-0.64960.25889
49-0.065178-0.58660.279551
500.0129360.11640.453801
51-0.009819-0.08840.464899
52-0.001782-0.0160.493621
53-0.127525-1.14770.12723
540.0392850.35360.362293
55-0.098886-0.890.188059
560.0015750.01420.494362
570.0607950.54720.292888
58-0.023753-0.21380.415629
590.0283330.2550.399687
600.0604190.54380.294046


Partial Autocorrelation Function
Time lag kPACF(k)T-STATP-value
1-0.002872-0.02580.489722
26e-040.00540.497851
3-0.044721-0.40250.344194
40.0814660.73320.232777
50.0272640.24540.403392
60.0603770.54340.294176
70.0032570.02930.488343
80.1023250.92090.179913
90.0898370.80850.210575
10-0.093495-0.84150.201284
110.0404420.3640.358412
12-0.32715-2.94440.002111
13-0.093465-0.84120.20136
140.1669811.50280.068386
15-0.036094-0.32480.373066
16-0.011353-0.10220.459434
17-0.04991-0.44920.327248
180.0829490.74650.228751
190.0682930.61460.27026
20-0.001363-0.01230.495121
210.1112281.00110.159891
22-0.032623-0.29360.384905
230.1919581.72760.043933
24-0.172918-1.55630.061773
25-0.22981-2.06830.020902
26-0.134606-1.21150.114622
27-0.032807-0.29530.384273
28-0.054653-0.49190.31207
290.075380.67840.249719
30-0.013977-0.12580.450103
31-0.013512-0.12160.451756
320.0699970.630.265244
330.0068830.06190.47538
34-0.015742-0.14170.443843
350.0598580.53870.295777
36-0.050194-0.45170.326329
37-0.090316-0.81280.209344
380.0618980.55710.289503
39-0.059127-0.53210.298042
40-0.067735-0.60960.271913
410.0036110.03250.487079
42-0.112761-1.01490.156599
43-0.008125-0.07310.470943
44-0.046348-0.41710.338843
45-0.07897-0.71070.239648
46-0.031264-0.28140.38957
47-0.063365-0.57030.285031
480.0319110.28720.387347
49-0.05024-0.45220.32618
500.0902430.81220.209532
51-0.028922-0.26030.397646
52-0.132367-1.19130.118507
530.0203110.18280.427706
540.0118010.10620.457838
55-0.114187-1.02770.153578
56-0.041628-0.37470.354449
570.0010830.00980.496122
58-0.080952-0.72860.234183
59-0.039726-0.35750.360813
600.0572350.51510.303936

\begin{tabular}{lllllllll}
\hline
Partial Autocorrelation Function \tabularnewline
Time lag k & PACF(k) & T-STAT & P-value \tabularnewline
1 & -0.002872 & -0.0258 & 0.489722 \tabularnewline
2 & 6e-04 & 0.0054 & 0.497851 \tabularnewline
3 & -0.044721 & -0.4025 & 0.344194 \tabularnewline
4 & 0.081466 & 0.7332 & 0.232777 \tabularnewline
5 & 0.027264 & 0.2454 & 0.403392 \tabularnewline
6 & 0.060377 & 0.5434 & 0.294176 \tabularnewline
7 & 0.003257 & 0.0293 & 0.488343 \tabularnewline
8 & 0.102325 & 0.9209 & 0.179913 \tabularnewline
9 & 0.089837 & 0.8085 & 0.210575 \tabularnewline
10 & -0.093495 & -0.8415 & 0.201284 \tabularnewline
11 & 0.040442 & 0.364 & 0.358412 \tabularnewline
12 & -0.32715 & -2.9444 & 0.002111 \tabularnewline
13 & -0.093465 & -0.8412 & 0.20136 \tabularnewline
14 & 0.166981 & 1.5028 & 0.068386 \tabularnewline
15 & -0.036094 & -0.3248 & 0.373066 \tabularnewline
16 & -0.011353 & -0.1022 & 0.459434 \tabularnewline
17 & -0.04991 & -0.4492 & 0.327248 \tabularnewline
18 & 0.082949 & 0.7465 & 0.228751 \tabularnewline
19 & 0.068293 & 0.6146 & 0.27026 \tabularnewline
20 & -0.001363 & -0.0123 & 0.495121 \tabularnewline
21 & 0.111228 & 1.0011 & 0.159891 \tabularnewline
22 & -0.032623 & -0.2936 & 0.384905 \tabularnewline
23 & 0.191958 & 1.7276 & 0.043933 \tabularnewline
24 & -0.172918 & -1.5563 & 0.061773 \tabularnewline
25 & -0.22981 & -2.0683 & 0.020902 \tabularnewline
26 & -0.134606 & -1.2115 & 0.114622 \tabularnewline
27 & -0.032807 & -0.2953 & 0.384273 \tabularnewline
28 & -0.054653 & -0.4919 & 0.31207 \tabularnewline
29 & 0.07538 & 0.6784 & 0.249719 \tabularnewline
30 & -0.013977 & -0.1258 & 0.450103 \tabularnewline
31 & -0.013512 & -0.1216 & 0.451756 \tabularnewline
32 & 0.069997 & 0.63 & 0.265244 \tabularnewline
33 & 0.006883 & 0.0619 & 0.47538 \tabularnewline
34 & -0.015742 & -0.1417 & 0.443843 \tabularnewline
35 & 0.059858 & 0.5387 & 0.295777 \tabularnewline
36 & -0.050194 & -0.4517 & 0.326329 \tabularnewline
37 & -0.090316 & -0.8128 & 0.209344 \tabularnewline
38 & 0.061898 & 0.5571 & 0.289503 \tabularnewline
39 & -0.059127 & -0.5321 & 0.298042 \tabularnewline
40 & -0.067735 & -0.6096 & 0.271913 \tabularnewline
41 & 0.003611 & 0.0325 & 0.487079 \tabularnewline
42 & -0.112761 & -1.0149 & 0.156599 \tabularnewline
43 & -0.008125 & -0.0731 & 0.470943 \tabularnewline
44 & -0.046348 & -0.4171 & 0.338843 \tabularnewline
45 & -0.07897 & -0.7107 & 0.239648 \tabularnewline
46 & -0.031264 & -0.2814 & 0.38957 \tabularnewline
47 & -0.063365 & -0.5703 & 0.285031 \tabularnewline
48 & 0.031911 & 0.2872 & 0.387347 \tabularnewline
49 & -0.05024 & -0.4522 & 0.32618 \tabularnewline
50 & 0.090243 & 0.8122 & 0.209532 \tabularnewline
51 & -0.028922 & -0.2603 & 0.397646 \tabularnewline
52 & -0.132367 & -1.1913 & 0.118507 \tabularnewline
53 & 0.020311 & 0.1828 & 0.427706 \tabularnewline
54 & 0.011801 & 0.1062 & 0.457838 \tabularnewline
55 & -0.114187 & -1.0277 & 0.153578 \tabularnewline
56 & -0.041628 & -0.3747 & 0.354449 \tabularnewline
57 & 0.001083 & 0.0098 & 0.496122 \tabularnewline
58 & -0.080952 & -0.7286 & 0.234183 \tabularnewline
59 & -0.039726 & -0.3575 & 0.360813 \tabularnewline
60 & 0.057235 & 0.5151 & 0.303936 \tabularnewline
\hline
\end{tabular}
%Source: https://freestatistics.org/blog/index.php?pk=35792&T=2

[TABLE]
[ROW][C]Partial Autocorrelation Function[/C][/ROW]
[ROW][C]Time lag k[/C][C]PACF(k)[/C][C]T-STAT[/C][C]P-value[/C][/ROW]
[ROW][C]1[/C][C]-0.002872[/C][C]-0.0258[/C][C]0.489722[/C][/ROW]
[ROW][C]2[/C][C]6e-04[/C][C]0.0054[/C][C]0.497851[/C][/ROW]
[ROW][C]3[/C][C]-0.044721[/C][C]-0.4025[/C][C]0.344194[/C][/ROW]
[ROW][C]4[/C][C]0.081466[/C][C]0.7332[/C][C]0.232777[/C][/ROW]
[ROW][C]5[/C][C]0.027264[/C][C]0.2454[/C][C]0.403392[/C][/ROW]
[ROW][C]6[/C][C]0.060377[/C][C]0.5434[/C][C]0.294176[/C][/ROW]
[ROW][C]7[/C][C]0.003257[/C][C]0.0293[/C][C]0.488343[/C][/ROW]
[ROW][C]8[/C][C]0.102325[/C][C]0.9209[/C][C]0.179913[/C][/ROW]
[ROW][C]9[/C][C]0.089837[/C][C]0.8085[/C][C]0.210575[/C][/ROW]
[ROW][C]10[/C][C]-0.093495[/C][C]-0.8415[/C][C]0.201284[/C][/ROW]
[ROW][C]11[/C][C]0.040442[/C][C]0.364[/C][C]0.358412[/C][/ROW]
[ROW][C]12[/C][C]-0.32715[/C][C]-2.9444[/C][C]0.002111[/C][/ROW]
[ROW][C]13[/C][C]-0.093465[/C][C]-0.8412[/C][C]0.20136[/C][/ROW]
[ROW][C]14[/C][C]0.166981[/C][C]1.5028[/C][C]0.068386[/C][/ROW]
[ROW][C]15[/C][C]-0.036094[/C][C]-0.3248[/C][C]0.373066[/C][/ROW]
[ROW][C]16[/C][C]-0.011353[/C][C]-0.1022[/C][C]0.459434[/C][/ROW]
[ROW][C]17[/C][C]-0.04991[/C][C]-0.4492[/C][C]0.327248[/C][/ROW]
[ROW][C]18[/C][C]0.082949[/C][C]0.7465[/C][C]0.228751[/C][/ROW]
[ROW][C]19[/C][C]0.068293[/C][C]0.6146[/C][C]0.27026[/C][/ROW]
[ROW][C]20[/C][C]-0.001363[/C][C]-0.0123[/C][C]0.495121[/C][/ROW]
[ROW][C]21[/C][C]0.111228[/C][C]1.0011[/C][C]0.159891[/C][/ROW]
[ROW][C]22[/C][C]-0.032623[/C][C]-0.2936[/C][C]0.384905[/C][/ROW]
[ROW][C]23[/C][C]0.191958[/C][C]1.7276[/C][C]0.043933[/C][/ROW]
[ROW][C]24[/C][C]-0.172918[/C][C]-1.5563[/C][C]0.061773[/C][/ROW]
[ROW][C]25[/C][C]-0.22981[/C][C]-2.0683[/C][C]0.020902[/C][/ROW]
[ROW][C]26[/C][C]-0.134606[/C][C]-1.2115[/C][C]0.114622[/C][/ROW]
[ROW][C]27[/C][C]-0.032807[/C][C]-0.2953[/C][C]0.384273[/C][/ROW]
[ROW][C]28[/C][C]-0.054653[/C][C]-0.4919[/C][C]0.31207[/C][/ROW]
[ROW][C]29[/C][C]0.07538[/C][C]0.6784[/C][C]0.249719[/C][/ROW]
[ROW][C]30[/C][C]-0.013977[/C][C]-0.1258[/C][C]0.450103[/C][/ROW]
[ROW][C]31[/C][C]-0.013512[/C][C]-0.1216[/C][C]0.451756[/C][/ROW]
[ROW][C]32[/C][C]0.069997[/C][C]0.63[/C][C]0.265244[/C][/ROW]
[ROW][C]33[/C][C]0.006883[/C][C]0.0619[/C][C]0.47538[/C][/ROW]
[ROW][C]34[/C][C]-0.015742[/C][C]-0.1417[/C][C]0.443843[/C][/ROW]
[ROW][C]35[/C][C]0.059858[/C][C]0.5387[/C][C]0.295777[/C][/ROW]
[ROW][C]36[/C][C]-0.050194[/C][C]-0.4517[/C][C]0.326329[/C][/ROW]
[ROW][C]37[/C][C]-0.090316[/C][C]-0.8128[/C][C]0.209344[/C][/ROW]
[ROW][C]38[/C][C]0.061898[/C][C]0.5571[/C][C]0.289503[/C][/ROW]
[ROW][C]39[/C][C]-0.059127[/C][C]-0.5321[/C][C]0.298042[/C][/ROW]
[ROW][C]40[/C][C]-0.067735[/C][C]-0.6096[/C][C]0.271913[/C][/ROW]
[ROW][C]41[/C][C]0.003611[/C][C]0.0325[/C][C]0.487079[/C][/ROW]
[ROW][C]42[/C][C]-0.112761[/C][C]-1.0149[/C][C]0.156599[/C][/ROW]
[ROW][C]43[/C][C]-0.008125[/C][C]-0.0731[/C][C]0.470943[/C][/ROW]
[ROW][C]44[/C][C]-0.046348[/C][C]-0.4171[/C][C]0.338843[/C][/ROW]
[ROW][C]45[/C][C]-0.07897[/C][C]-0.7107[/C][C]0.239648[/C][/ROW]
[ROW][C]46[/C][C]-0.031264[/C][C]-0.2814[/C][C]0.38957[/C][/ROW]
[ROW][C]47[/C][C]-0.063365[/C][C]-0.5703[/C][C]0.285031[/C][/ROW]
[ROW][C]48[/C][C]0.031911[/C][C]0.2872[/C][C]0.387347[/C][/ROW]
[ROW][C]49[/C][C]-0.05024[/C][C]-0.4522[/C][C]0.32618[/C][/ROW]
[ROW][C]50[/C][C]0.090243[/C][C]0.8122[/C][C]0.209532[/C][/ROW]
[ROW][C]51[/C][C]-0.028922[/C][C]-0.2603[/C][C]0.397646[/C][/ROW]
[ROW][C]52[/C][C]-0.132367[/C][C]-1.1913[/C][C]0.118507[/C][/ROW]
[ROW][C]53[/C][C]0.020311[/C][C]0.1828[/C][C]0.427706[/C][/ROW]
[ROW][C]54[/C][C]0.011801[/C][C]0.1062[/C][C]0.457838[/C][/ROW]
[ROW][C]55[/C][C]-0.114187[/C][C]-1.0277[/C][C]0.153578[/C][/ROW]
[ROW][C]56[/C][C]-0.041628[/C][C]-0.3747[/C][C]0.354449[/C][/ROW]
[ROW][C]57[/C][C]0.001083[/C][C]0.0098[/C][C]0.496122[/C][/ROW]
[ROW][C]58[/C][C]-0.080952[/C][C]-0.7286[/C][C]0.234183[/C][/ROW]
[ROW][C]59[/C][C]-0.039726[/C][C]-0.3575[/C][C]0.360813[/C][/ROW]
[ROW][C]60[/C][C]0.057235[/C][C]0.5151[/C][C]0.303936[/C][/ROW]
[/TABLE]
Source: https://freestatistics.org/blog/index.php?pk=35792&T=2

Globally Unique Identifier (entire table): ba.freestatistics.org/blog/index.php?pk=35792&T=2

As an alternative you can also use a QR Code:  

The GUIDs for individual cells are displayed in the table below:

Partial Autocorrelation Function
Time lag kPACF(k)T-STATP-value
1-0.002872-0.02580.489722
26e-040.00540.497851
3-0.044721-0.40250.344194
40.0814660.73320.232777
50.0272640.24540.403392
60.0603770.54340.294176
70.0032570.02930.488343
80.1023250.92090.179913
90.0898370.80850.210575
10-0.093495-0.84150.201284
110.0404420.3640.358412
12-0.32715-2.94440.002111
13-0.093465-0.84120.20136
140.1669811.50280.068386
15-0.036094-0.32480.373066
16-0.011353-0.10220.459434
17-0.04991-0.44920.327248
180.0829490.74650.228751
190.0682930.61460.27026
20-0.001363-0.01230.495121
210.1112281.00110.159891
22-0.032623-0.29360.384905
230.1919581.72760.043933
24-0.172918-1.55630.061773
25-0.22981-2.06830.020902
26-0.134606-1.21150.114622
27-0.032807-0.29530.384273
28-0.054653-0.49190.31207
290.075380.67840.249719
30-0.013977-0.12580.450103
31-0.013512-0.12160.451756
320.0699970.630.265244
330.0068830.06190.47538
34-0.015742-0.14170.443843
350.0598580.53870.295777
36-0.050194-0.45170.326329
37-0.090316-0.81280.209344
380.0618980.55710.289503
39-0.059127-0.53210.298042
40-0.067735-0.60960.271913
410.0036110.03250.487079
42-0.112761-1.01490.156599
43-0.008125-0.07310.470943
44-0.046348-0.41710.338843
45-0.07897-0.71070.239648
46-0.031264-0.28140.38957
47-0.063365-0.57030.285031
480.0319110.28720.387347
49-0.05024-0.45220.32618
500.0902430.81220.209532
51-0.028922-0.26030.397646
52-0.132367-1.19130.118507
530.0203110.18280.427706
540.0118010.10620.457838
55-0.114187-1.02770.153578
56-0.041628-0.37470.354449
570.0010830.00980.496122
58-0.080952-0.72860.234183
59-0.039726-0.35750.360813
600.0572350.51510.303936


Parameters (Session):
par1 = 60 ; par2 = 1 ; par3 = 1 ; par4 = 1 ; par5 = 12 ;
Parameters (R input):
par1 = 60 ; par2 = 1 ; par3 = 1 ; par4 = 1 ; par5 = 12 ;
R code (references can be found in the software module):
if (par1 == 'Default') {
par1 = 10*log10(length(x))
} else {
par1 <- as.numeric(par1)
}
par2 <- as.numeric(par2)
par3 <- as.numeric(par3)
par4 <- as.numeric(par4)
par5 <- as.numeric(par5)
if (par2 == 0) {
x <- log(x)
} else {
x <- (x ^ par2 - 1) / par2
}
if (par3 > 0) x <- diff(x,lag=1,difference=par3)
if (par4 > 0) x <- diff(x,lag=par5,difference=par4)
bitmap(file='pic1.png')
racf <- acf(x,par1,main='Autocorrelation',xlab='lags',ylab='ACF')
dev.off()
bitmap(file='pic2.png')
rpacf <- pacf(x,par1,main='Partial Autocorrelation',xlab='lags',ylab='PACF')
dev.off()
(myacf <- c(racf$acf))
(mypacf <- c(rpacf$acf))
lengthx <- length(x)
sqrtn <- sqrt(lengthx)
load(file='createtable')
a<-table.start()
a<-table.row.start(a)
a<-table.element(a,'Autocorrelation Function',4,TRUE)
a<-table.row.end(a)
a<-table.row.start(a)
a<-table.element(a,'Time lag k',header=TRUE)
a<-table.element(a,hyperlink('basics.htm','ACF(k)','click here for more information about the Autocorrelation Function'),header=TRUE)
a<-table.element(a,'T-STAT',header=TRUE)
a<-table.element(a,'P-value',header=TRUE)
a<-table.row.end(a)
for (i in 2:(par1+1)) {
a<-table.row.start(a)
a<-table.element(a,i-1,header=TRUE)
a<-table.element(a,round(myacf[i],6))
mytstat <- myacf[i]*sqrtn
a<-table.element(a,round(mytstat,4))
a<-table.element(a,round(1-pt(abs(mytstat),lengthx),6))
a<-table.row.end(a)
}
a<-table.end(a)
table.save(a,file='mytable.tab')
a<-table.start()
a<-table.row.start(a)
a<-table.element(a,'Partial Autocorrelation Function',4,TRUE)
a<-table.row.end(a)
a<-table.row.start(a)
a<-table.element(a,'Time lag k',header=TRUE)
a<-table.element(a,hyperlink('basics.htm','PACF(k)','click here for more information about the Partial Autocorrelation Function'),header=TRUE)
a<-table.element(a,'T-STAT',header=TRUE)
a<-table.element(a,'P-value',header=TRUE)
a<-table.row.end(a)
for (i in 1:par1) {
a<-table.row.start(a)
a<-table.element(a,i,header=TRUE)
a<-table.element(a,round(mypacf[i],6))
mytstat <- mypacf[i]*sqrtn
a<-table.element(a,round(mytstat,4))
a<-table.element(a,round(1-pt(abs(mytstat),lengthx),6))
a<-table.row.end(a)
}
a<-table.end(a)
table.save(a,file='mytable1.tab')