Free Statistics

of Irreproducible Research!

Author's title

Author*Unverified author*
R Software Modulerwasp_autocorrelation.wasp
Title produced by software(Partial) Autocorrelation Function
Date of computationWed, 24 Dec 2008 01:47:46 -0700
Cite this page as followsStatistical Computations at FreeStatistics.org, Office for Research Development and Education, URL https://freestatistics.org/blog/index.php?v=date/2008/Dec/24/t12301085674r8il3l23td4eex.htm/, Retrieved Sat, 18 May 2024 20:43:09 +0000
Statistical Computations at FreeStatistics.org, Office for Research Development and Education, URL https://freestatistics.org/blog/index.php?pk=36436, Retrieved Sat, 18 May 2024 20:43:09 +0000
QR Codes:

Original text written by user:
IsPrivate?No (this computation is public)
User-defined keywords
Estimated Impact206
Family? (F = Feedback message, R = changed R code, M = changed R Module, P = changed Parameters, D = changed Data)
-       [(Partial) Autocorrelation Function] [] [2008-12-24 08:47:46] [ba8414dd214a21fbd6c7bde748ac585f] [Current]
Feedback Forum

Post a new message
Dataseries X:
46402
45329
42185
49341
50472
33020
29567
22870
25730
32609
23536
15135
36776
29982
38062
34226
24906
30233
27405
20784
22886
25425
20838
15655
37158
36364
43213
31635
30113
29985
20919
19429
21427
26064
20109
15369
35466
25954
33504
28115
28501
28618
21434
20177
21484
25642
23515
12941
36190
37785
38407
33326
30304
27576
27048
17291
21018
26792
19426
13927
35647
31746
31277
31583
25607
28151
24947
18077
23429
26313
18862
14753
36409
33163
34122
35225
28249
30374
26311
22069
23651
28628
23187
14727
43080
32519
39657
33614
28671
34243
27336
22916
24537
26128
22602
15744
41086
39690
43129
37863
35953
29133
24693
22205
21725
27192
21790
13253
37702
30364
32609
30212
29965
28352
25814
22414
20506
28806
22228
13971
36845
35338
35022
34777
26887
23970
22780
17351
21382
24561
17409
11514
31514
27071
29462
26105
22397
23843
21705
18089
20764
25316
17704
15548
28029
29383
36438
32034
22679
24319
18004
17537
20366
22782
19169
13807
29743
25591
29096
26482
22405
27044
17970
18730
19684
19785
18479
10698
31956
29506
34506
27165
26736
23691
18157
17328
18205
20995
17382
9367
31124
26551
30651
25859
25100
25778
20418
18688
20424
24776
19814
12738


Summary of computational transaction
Raw Inputview raw input (R code)
Raw Outputview raw output of R engine
Computing time1 seconds
R Server'Gwilym Jenkins' @ 72.249.127.135

\begin{tabular}{lllllllll}
\hline
Summary of computational transaction \tabularnewline
Raw Input & view raw input (R code)  \tabularnewline
Raw Output & view raw output of R engine  \tabularnewline
Computing time & 1 seconds \tabularnewline
R Server & 'Gwilym Jenkins' @ 72.249.127.135 \tabularnewline
\hline
\end{tabular}
%Source: https://freestatistics.org/blog/index.php?pk=36436&T=0

[TABLE]
[ROW][C]Summary of computational transaction[/C][/ROW]
[ROW][C]Raw Input[/C][C]view raw input (R code) [/C][/ROW]
[ROW][C]Raw Output[/C][C]view raw output of R engine [/C][/ROW]
[ROW][C]Computing time[/C][C]1 seconds[/C][/ROW]
[ROW][C]R Server[/C][C]'Gwilym Jenkins' @ 72.249.127.135[/C][/ROW]
[/TABLE]
Source: https://freestatistics.org/blog/index.php?pk=36436&T=0

Globally Unique Identifier (entire table): ba.freestatistics.org/blog/index.php?pk=36436&T=0

As an alternative you can also use a QR Code:  

The GUIDs for individual cells are displayed in the table below:

Summary of computational transaction
Raw Inputview raw input (R code)
Raw Outputview raw output of R engine
Computing time1 seconds
R Server'Gwilym Jenkins' @ 72.249.127.135


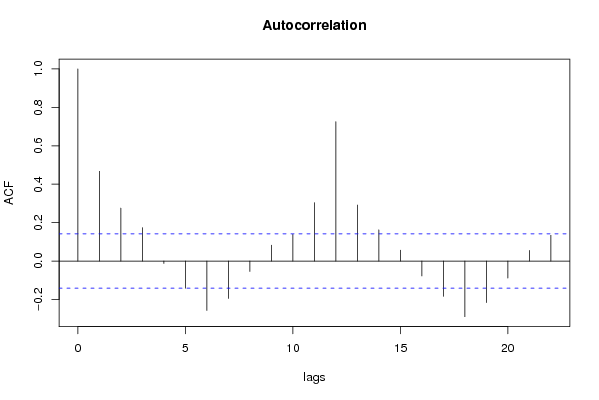
Autocorrelation Function
Time lag kACF(k)T-STATP-value
10.4674866.47770
20.2755933.81879e-05
30.1740182.41130.00842
4-0.012176-0.16870.433097
5-0.141454-1.960.025719
6-0.25731-3.56540.000229
7-0.194262-2.69180.003867
8-0.053692-0.7440.228898
90.0824131.14190.12745
100.1384611.91860.028261
110.3044.21241.9e-05
120.72536310.05090
130.2915424.03973.9e-05
140.1623652.24980.012798
150.0567190.78590.21644
16-0.077676-1.07630.141569
17-0.183311-2.540.005938
18-0.289358-4.00954.4e-05
19-0.216249-2.99640.001546
20-0.088764-1.230.11011
210.0555340.76950.221273
220.134331.86130.032113

\begin{tabular}{lllllllll}
\hline
Autocorrelation Function \tabularnewline
Time lag k & ACF(k) & T-STAT & P-value \tabularnewline
1 & 0.467486 & 6.4777 & 0 \tabularnewline
2 & 0.275593 & 3.8187 & 9e-05 \tabularnewline
3 & 0.174018 & 2.4113 & 0.00842 \tabularnewline
4 & -0.012176 & -0.1687 & 0.433097 \tabularnewline
5 & -0.141454 & -1.96 & 0.025719 \tabularnewline
6 & -0.25731 & -3.5654 & 0.000229 \tabularnewline
7 & -0.194262 & -2.6918 & 0.003867 \tabularnewline
8 & -0.053692 & -0.744 & 0.228898 \tabularnewline
9 & 0.082413 & 1.1419 & 0.12745 \tabularnewline
10 & 0.138461 & 1.9186 & 0.028261 \tabularnewline
11 & 0.304 & 4.2124 & 1.9e-05 \tabularnewline
12 & 0.725363 & 10.0509 & 0 \tabularnewline
13 & 0.291542 & 4.0397 & 3.9e-05 \tabularnewline
14 & 0.162365 & 2.2498 & 0.012798 \tabularnewline
15 & 0.056719 & 0.7859 & 0.21644 \tabularnewline
16 & -0.077676 & -1.0763 & 0.141569 \tabularnewline
17 & -0.183311 & -2.54 & 0.005938 \tabularnewline
18 & -0.289358 & -4.0095 & 4.4e-05 \tabularnewline
19 & -0.216249 & -2.9964 & 0.001546 \tabularnewline
20 & -0.088764 & -1.23 & 0.11011 \tabularnewline
21 & 0.055534 & 0.7695 & 0.221273 \tabularnewline
22 & 0.13433 & 1.8613 & 0.032113 \tabularnewline
\hline
\end{tabular}
%Source: https://freestatistics.org/blog/index.php?pk=36436&T=1

[TABLE]
[ROW][C]Autocorrelation Function[/C][/ROW]
[ROW][C]Time lag k[/C][C]ACF(k)[/C][C]T-STAT[/C][C]P-value[/C][/ROW]
[ROW][C]1[/C][C]0.467486[/C][C]6.4777[/C][C]0[/C][/ROW]
[ROW][C]2[/C][C]0.275593[/C][C]3.8187[/C][C]9e-05[/C][/ROW]
[ROW][C]3[/C][C]0.174018[/C][C]2.4113[/C][C]0.00842[/C][/ROW]
[ROW][C]4[/C][C]-0.012176[/C][C]-0.1687[/C][C]0.433097[/C][/ROW]
[ROW][C]5[/C][C]-0.141454[/C][C]-1.96[/C][C]0.025719[/C][/ROW]
[ROW][C]6[/C][C]-0.25731[/C][C]-3.5654[/C][C]0.000229[/C][/ROW]
[ROW][C]7[/C][C]-0.194262[/C][C]-2.6918[/C][C]0.003867[/C][/ROW]
[ROW][C]8[/C][C]-0.053692[/C][C]-0.744[/C][C]0.228898[/C][/ROW]
[ROW][C]9[/C][C]0.082413[/C][C]1.1419[/C][C]0.12745[/C][/ROW]
[ROW][C]10[/C][C]0.138461[/C][C]1.9186[/C][C]0.028261[/C][/ROW]
[ROW][C]11[/C][C]0.304[/C][C]4.2124[/C][C]1.9e-05[/C][/ROW]
[ROW][C]12[/C][C]0.725363[/C][C]10.0509[/C][C]0[/C][/ROW]
[ROW][C]13[/C][C]0.291542[/C][C]4.0397[/C][C]3.9e-05[/C][/ROW]
[ROW][C]14[/C][C]0.162365[/C][C]2.2498[/C][C]0.012798[/C][/ROW]
[ROW][C]15[/C][C]0.056719[/C][C]0.7859[/C][C]0.21644[/C][/ROW]
[ROW][C]16[/C][C]-0.077676[/C][C]-1.0763[/C][C]0.141569[/C][/ROW]
[ROW][C]17[/C][C]-0.183311[/C][C]-2.54[/C][C]0.005938[/C][/ROW]
[ROW][C]18[/C][C]-0.289358[/C][C]-4.0095[/C][C]4.4e-05[/C][/ROW]
[ROW][C]19[/C][C]-0.216249[/C][C]-2.9964[/C][C]0.001546[/C][/ROW]
[ROW][C]20[/C][C]-0.088764[/C][C]-1.23[/C][C]0.11011[/C][/ROW]
[ROW][C]21[/C][C]0.055534[/C][C]0.7695[/C][C]0.221273[/C][/ROW]
[ROW][C]22[/C][C]0.13433[/C][C]1.8613[/C][C]0.032113[/C][/ROW]
[/TABLE]
Source: https://freestatistics.org/blog/index.php?pk=36436&T=1

Globally Unique Identifier (entire table): ba.freestatistics.org/blog/index.php?pk=36436&T=1

As an alternative you can also use a QR Code:  

The GUIDs for individual cells are displayed in the table below:

Autocorrelation Function
Time lag kACF(k)T-STATP-value
10.4674866.47770
20.2755933.81879e-05
30.1740182.41130.00842
4-0.012176-0.16870.433097
5-0.141454-1.960.025719
6-0.25731-3.56540.000229
7-0.194262-2.69180.003867
8-0.053692-0.7440.228898
90.0824131.14190.12745
100.1384611.91860.028261
110.3044.21241.9e-05
120.72536310.05090
130.2915424.03973.9e-05
140.1623652.24980.012798
150.0567190.78590.21644
16-0.077676-1.07630.141569
17-0.183311-2.540.005938
18-0.289358-4.00954.4e-05
19-0.216249-2.99640.001546
20-0.088764-1.230.11011
210.0555340.76950.221273
220.134331.86130.032113


Partial Autocorrelation Function
Time lag kPACF(k)T-STATP-value
10.4674866.47770
20.0730051.01160.156506
30.0263210.36470.357861
4-0.150028-2.07890.01948
5-0.136231-1.88770.030289
6-0.169674-2.35110.009867
70.0392160.54340.293747
80.1418731.96590.025379
90.1657472.29670.011359
100.0359650.49830.309407
110.1809742.50770.006491
120.647578.9730
13-0.504615-6.99220
14-0.080187-1.11110.133957
15-0.112296-1.5560.060674
160.1061561.47090.071471
17-0.098424-1.36380.087113
180.0790991.0960.137219
190.0468860.64970.25834
20-0.075583-1.04730.148138
210.111791.5490.061514
220.1457422.01950.022415

\begin{tabular}{lllllllll}
\hline
Partial Autocorrelation Function \tabularnewline
Time lag k & PACF(k) & T-STAT & P-value \tabularnewline
1 & 0.467486 & 6.4777 & 0 \tabularnewline
2 & 0.073005 & 1.0116 & 0.156506 \tabularnewline
3 & 0.026321 & 0.3647 & 0.357861 \tabularnewline
4 & -0.150028 & -2.0789 & 0.01948 \tabularnewline
5 & -0.136231 & -1.8877 & 0.030289 \tabularnewline
6 & -0.169674 & -2.3511 & 0.009867 \tabularnewline
7 & 0.039216 & 0.5434 & 0.293747 \tabularnewline
8 & 0.141873 & 1.9659 & 0.025379 \tabularnewline
9 & 0.165747 & 2.2967 & 0.011359 \tabularnewline
10 & 0.035965 & 0.4983 & 0.309407 \tabularnewline
11 & 0.180974 & 2.5077 & 0.006491 \tabularnewline
12 & 0.64757 & 8.973 & 0 \tabularnewline
13 & -0.504615 & -6.9922 & 0 \tabularnewline
14 & -0.080187 & -1.1111 & 0.133957 \tabularnewline
15 & -0.112296 & -1.556 & 0.060674 \tabularnewline
16 & 0.106156 & 1.4709 & 0.071471 \tabularnewline
17 & -0.098424 & -1.3638 & 0.087113 \tabularnewline
18 & 0.079099 & 1.096 & 0.137219 \tabularnewline
19 & 0.046886 & 0.6497 & 0.25834 \tabularnewline
20 & -0.075583 & -1.0473 & 0.148138 \tabularnewline
21 & 0.11179 & 1.549 & 0.061514 \tabularnewline
22 & 0.145742 & 2.0195 & 0.022415 \tabularnewline
\hline
\end{tabular}
%Source: https://freestatistics.org/blog/index.php?pk=36436&T=2

[TABLE]
[ROW][C]Partial Autocorrelation Function[/C][/ROW]
[ROW][C]Time lag k[/C][C]PACF(k)[/C][C]T-STAT[/C][C]P-value[/C][/ROW]
[ROW][C]1[/C][C]0.467486[/C][C]6.4777[/C][C]0[/C][/ROW]
[ROW][C]2[/C][C]0.073005[/C][C]1.0116[/C][C]0.156506[/C][/ROW]
[ROW][C]3[/C][C]0.026321[/C][C]0.3647[/C][C]0.357861[/C][/ROW]
[ROW][C]4[/C][C]-0.150028[/C][C]-2.0789[/C][C]0.01948[/C][/ROW]
[ROW][C]5[/C][C]-0.136231[/C][C]-1.8877[/C][C]0.030289[/C][/ROW]
[ROW][C]6[/C][C]-0.169674[/C][C]-2.3511[/C][C]0.009867[/C][/ROW]
[ROW][C]7[/C][C]0.039216[/C][C]0.5434[/C][C]0.293747[/C][/ROW]
[ROW][C]8[/C][C]0.141873[/C][C]1.9659[/C][C]0.025379[/C][/ROW]
[ROW][C]9[/C][C]0.165747[/C][C]2.2967[/C][C]0.011359[/C][/ROW]
[ROW][C]10[/C][C]0.035965[/C][C]0.4983[/C][C]0.309407[/C][/ROW]
[ROW][C]11[/C][C]0.180974[/C][C]2.5077[/C][C]0.006491[/C][/ROW]
[ROW][C]12[/C][C]0.64757[/C][C]8.973[/C][C]0[/C][/ROW]
[ROW][C]13[/C][C]-0.504615[/C][C]-6.9922[/C][C]0[/C][/ROW]
[ROW][C]14[/C][C]-0.080187[/C][C]-1.1111[/C][C]0.133957[/C][/ROW]
[ROW][C]15[/C][C]-0.112296[/C][C]-1.556[/C][C]0.060674[/C][/ROW]
[ROW][C]16[/C][C]0.106156[/C][C]1.4709[/C][C]0.071471[/C][/ROW]
[ROW][C]17[/C][C]-0.098424[/C][C]-1.3638[/C][C]0.087113[/C][/ROW]
[ROW][C]18[/C][C]0.079099[/C][C]1.096[/C][C]0.137219[/C][/ROW]
[ROW][C]19[/C][C]0.046886[/C][C]0.6497[/C][C]0.25834[/C][/ROW]
[ROW][C]20[/C][C]-0.075583[/C][C]-1.0473[/C][C]0.148138[/C][/ROW]
[ROW][C]21[/C][C]0.11179[/C][C]1.549[/C][C]0.061514[/C][/ROW]
[ROW][C]22[/C][C]0.145742[/C][C]2.0195[/C][C]0.022415[/C][/ROW]
[/TABLE]
Source: https://freestatistics.org/blog/index.php?pk=36436&T=2

Globally Unique Identifier (entire table): ba.freestatistics.org/blog/index.php?pk=36436&T=2

As an alternative you can also use a QR Code:  

The GUIDs for individual cells are displayed in the table below:

Partial Autocorrelation Function
Time lag kPACF(k)T-STATP-value
10.4674866.47770
20.0730051.01160.156506
30.0263210.36470.357861
4-0.150028-2.07890.01948
5-0.136231-1.88770.030289
6-0.169674-2.35110.009867
70.0392160.54340.293747
80.1418731.96590.025379
90.1657472.29670.011359
100.0359650.49830.309407
110.1809742.50770.006491
120.647578.9730
13-0.504615-6.99220
14-0.080187-1.11110.133957
15-0.112296-1.5560.060674
160.1061561.47090.071471
17-0.098424-1.36380.087113
180.0790991.0960.137219
190.0468860.64970.25834
20-0.075583-1.04730.148138
210.111791.5490.061514
220.1457422.01950.022415


Parameters (Session):
par1 = Default ; par2 = 1 ; par3 = 0 ; par4 = 0 ; par5 = 12 ;
Parameters (R input):
par1 = Default ; par2 = 1 ; par3 = 0 ; par4 = 0 ; par5 = 12 ;
R code (references can be found in the software module):
if (par1 == 'Default') {
par1 = 10*log10(length(x))
} else {
par1 <- as.numeric(par1)
}
par2 <- as.numeric(par2)
par3 <- as.numeric(par3)
par4 <- as.numeric(par4)
par5 <- as.numeric(par5)
if (par2 == 0) {
x <- log(x)
} else {
x <- (x ^ par2 - 1) / par2
}
if (par3 > 0) x <- diff(x,lag=1,difference=par3)
if (par4 > 0) x <- diff(x,lag=par5,difference=par4)
bitmap(file='pic1.png')
racf <- acf(x,par1,main='Autocorrelation',xlab='lags',ylab='ACF')
dev.off()
bitmap(file='pic2.png')
rpacf <- pacf(x,par1,main='Partial Autocorrelation',xlab='lags',ylab='PACF')
dev.off()
(myacf <- c(racf$acf))
(mypacf <- c(rpacf$acf))
lengthx <- length(x)
sqrtn <- sqrt(lengthx)
load(file='createtable')
a<-table.start()
a<-table.row.start(a)
a<-table.element(a,'Autocorrelation Function',4,TRUE)
a<-table.row.end(a)
a<-table.row.start(a)
a<-table.element(a,'Time lag k',header=TRUE)
a<-table.element(a,hyperlink('basics.htm','ACF(k)','click here for more information about the Autocorrelation Function'),header=TRUE)
a<-table.element(a,'T-STAT',header=TRUE)
a<-table.element(a,'P-value',header=TRUE)
a<-table.row.end(a)
for (i in 2:(par1+1)) {
a<-table.row.start(a)
a<-table.element(a,i-1,header=TRUE)
a<-table.element(a,round(myacf[i],6))
mytstat <- myacf[i]*sqrtn
a<-table.element(a,round(mytstat,4))
a<-table.element(a,round(1-pt(abs(mytstat),lengthx),6))
a<-table.row.end(a)
}
a<-table.end(a)
table.save(a,file='mytable.tab')
a<-table.start()
a<-table.row.start(a)
a<-table.element(a,'Partial Autocorrelation Function',4,TRUE)
a<-table.row.end(a)
a<-table.row.start(a)
a<-table.element(a,'Time lag k',header=TRUE)
a<-table.element(a,hyperlink('basics.htm','PACF(k)','click here for more information about the Partial Autocorrelation Function'),header=TRUE)
a<-table.element(a,'T-STAT',header=TRUE)
a<-table.element(a,'P-value',header=TRUE)
a<-table.row.end(a)
for (i in 1:par1) {
a<-table.row.start(a)
a<-table.element(a,i,header=TRUE)
a<-table.element(a,round(mypacf[i],6))
mytstat <- mypacf[i]*sqrtn
a<-table.element(a,round(mytstat,4))
a<-table.element(a,round(1-pt(abs(mytstat),lengthx),6))
a<-table.row.end(a)
}
a<-table.end(a)
table.save(a,file='mytable1.tab')