Free Statistics

of Irreproducible Research!

Author's title

Author*Unverified author*
R Software Modulerwasp_exponentialsmoothing.wasp
Title produced by softwareExponential Smoothing
Date of computationWed, 07 May 2008 09:27:02 -0600
Cite this page as followsStatistical Computations at FreeStatistics.org, Office for Research Development and Education, URL https://freestatistics.org/blog/index.php?v=date/2008/May/07/t1210174270ygh4e5dyqzx4ati.htm/, Retrieved Mon, 13 May 2024 20:42:04 +0000
Statistical Computations at FreeStatistics.org, Office for Research Development and Education, URL https://freestatistics.org/blog/index.php?pk=11874, Retrieved Mon, 13 May 2024 20:42:04 +0000
QR Codes:

Original text written by user:
IsPrivate?No (this computation is public)
User-defined keywords
Estimated Impact175
Family? (F = Feedback message, R = changed R code, M = changed R Module, P = changed Parameters, D = changed Data)
-       [Exponential Smoothing] [triple exponentia...] [2008-05-07 15:27:02] [42e511cfef8a9d9c5f2111ede83bec8b] [Current]
Feedback Forum

Post a new message
Dataseries X:
56421
53152
53536
52408
41454
38271
35306
26414
31917
38030
27534
18387
50556
43901
48572
43899
37532
40357
35489
29027
34485
42598
30306
26451
47460
50104
61465
53726
39477
43895
31481
29896
33842
39120
33702
25094
51442
45594
52518
48564
41745
49585
32747
33379
35645
37034
35681
20972
58552
54955
65540
51570
51145
46641
35704
33253
35193
41668
34865
21210
56126
49231
59723
48103
47472
50497
40059
34149
36860
46356
36577


Summary of computational transaction
Raw Inputview raw input (R code)
Raw Outputview raw output of R engine
Computing time2 seconds
R Server'Sir Ronald Aylmer Fisher' @ 193.190.124.24

\begin{tabular}{lllllllll}
\hline
Summary of computational transaction \tabularnewline
Raw Input & view raw input (R code)  \tabularnewline
Raw Output & view raw output of R engine  \tabularnewline
Computing time & 2 seconds \tabularnewline
R Server & 'Sir Ronald Aylmer Fisher' @ 193.190.124.24 \tabularnewline
\hline
\end{tabular}
%Source: https://freestatistics.org/blog/index.php?pk=11874&T=0

[TABLE]
[ROW][C]Summary of computational transaction[/C][/ROW]
[ROW][C]Raw Input[/C][C]view raw input (R code) [/C][/ROW]
[ROW][C]Raw Output[/C][C]view raw output of R engine [/C][/ROW]
[ROW][C]Computing time[/C][C]2 seconds[/C][/ROW]
[ROW][C]R Server[/C][C]'Sir Ronald Aylmer Fisher' @ 193.190.124.24[/C][/ROW]
[/TABLE]
Source: https://freestatistics.org/blog/index.php?pk=11874&T=0

Globally Unique Identifier (entire table): ba.freestatistics.org/blog/index.php?pk=11874&T=0

As an alternative you can also use a QR Code:  

The GUIDs for individual cells are displayed in the table below:

Summary of computational transaction
Raw Inputview raw input (R code)
Raw Outputview raw output of R engine
Computing time2 seconds
R Server'Sir Ronald Aylmer Fisher' @ 193.190.124.24


Estimated Parameters of Exponential Smoothing
ParameterValue
alpha0
beta0.00350348394532541
gamma0.323270481307212

\begin{tabular}{lllllllll}
\hline
Estimated Parameters of Exponential Smoothing \tabularnewline
Parameter & Value \tabularnewline
alpha & 0 \tabularnewline
beta & 0.00350348394532541 \tabularnewline
gamma & 0.323270481307212 \tabularnewline
\hline
\end{tabular}
%Source: https://freestatistics.org/blog/index.php?pk=11874&T=1

[TABLE]
[ROW][C]Estimated Parameters of Exponential Smoothing[/C][/ROW]
[ROW][C]Parameter[/C][C]Value[/C][/ROW]
[ROW][C]alpha[/C][C]0[/C][/ROW]
[ROW][C]beta[/C][C]0.00350348394532541[/C][/ROW]
[ROW][C]gamma[/C][C]0.323270481307212[/C][/ROW]
[/TABLE]
Source: https://freestatistics.org/blog/index.php?pk=11874&T=1

Globally Unique Identifier (entire table): ba.freestatistics.org/blog/index.php?pk=11874&T=1

As an alternative you can also use a QR Code:  

The GUIDs for individual cells are displayed in the table below:

Estimated Parameters of Exponential Smoothing
ParameterValue
alpha0
beta0.00350348394532541
gamma0.323270481307212


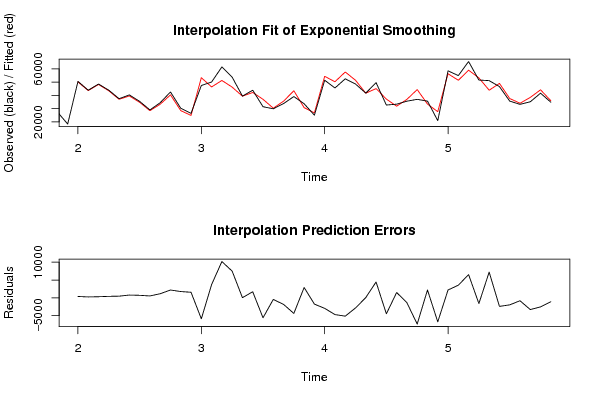
Interpolation Forecasts of Exponential Smoothing
tObservedFittedResiduals
135055650171.6294214468384.3705785532
144390143650.1812576848250.818742315227
154857248256.4676951532315.532304846805
164389943485.1985085089413.801491491133
173753237061.6413558757470.358644124302
184035739576.6526546217780.347345378323
193548934786.650148218702.34985178199
202902728496.6182790210530.38172097904
213448533333.49352091551151.50647908451
224259840405.21918331292192.78081668707
233030628538.33375047591767.66624952406
242645124889.10343694381561.89656305622
254746053355.5401722729-5895.54017227286
265010446378.15408605743725.84591394264
276146551270.739014916110194.2609850839
285372646232.69550715977493.30449284033
293947739432.526356469544.4736435305094
304389542191.93692479881703.06307520122
313148137080.8167227881-5599.81672278811
322989630352.2776035736-456.277603573613
333384235676.2518023743-1834.25180237435
343912043506.0448835148-4386.04488351481
353370230795.16579367292906.8342063271
362509426857.2219833694-1763.22198336941
375144254400.0506041279-2958.05060412793
384559450298.2412433933-4704.24124339328
395251857665.7021707125-5147.70217071245
404856451405.7332016249-2841.73320162491
414174541666.544289395478.4557106046486
424958545136.34231048574448.65768951428
433274737236.7638680828-4489.76386808284
443337931880.79447864311498.20552135691
453564537021.051573743-1376.05157374303
463703444402.1753879582-7368.17538795821
473568133471.68598421122209.31401578877
482097227719.3739188527-6747.37391885266
495855256342.30285005922209.69714994083
505495551411.02430931983543.97569068022
516554059011.61820692396528.38179307614
525157053188.6022513755-1618.60225137547
535114543912.89871638387232.10128361621
544664149044.5896431659-2403.58964316585
553570437674.9200302099-1970.92003020986
563325334066.5997294569-813.599729456895
573519338490.6902626281-3297.69026262814
584166844210.1382392375-2542.13823923747
593486535959.7782250818-1094.77822508181

\begin{tabular}{lllllllll}
\hline
Interpolation Forecasts of Exponential Smoothing \tabularnewline
t & Observed & Fitted & Residuals \tabularnewline
13 & 50556 & 50171.6294214468 & 384.3705785532 \tabularnewline
14 & 43901 & 43650.1812576848 & 250.818742315227 \tabularnewline
15 & 48572 & 48256.4676951532 & 315.532304846805 \tabularnewline
16 & 43899 & 43485.1985085089 & 413.801491491133 \tabularnewline
17 & 37532 & 37061.6413558757 & 470.358644124302 \tabularnewline
18 & 40357 & 39576.6526546217 & 780.347345378323 \tabularnewline
19 & 35489 & 34786.650148218 & 702.34985178199 \tabularnewline
20 & 29027 & 28496.6182790210 & 530.38172097904 \tabularnewline
21 & 34485 & 33333.4935209155 & 1151.50647908451 \tabularnewline
22 & 42598 & 40405.2191833129 & 2192.78081668707 \tabularnewline
23 & 30306 & 28538.3337504759 & 1767.66624952406 \tabularnewline
24 & 26451 & 24889.1034369438 & 1561.89656305622 \tabularnewline
25 & 47460 & 53355.5401722729 & -5895.54017227286 \tabularnewline
26 & 50104 & 46378.1540860574 & 3725.84591394264 \tabularnewline
27 & 61465 & 51270.7390149161 & 10194.2609850839 \tabularnewline
28 & 53726 & 46232.6955071597 & 7493.30449284033 \tabularnewline
29 & 39477 & 39432.5263564695 & 44.4736435305094 \tabularnewline
30 & 43895 & 42191.9369247988 & 1703.06307520122 \tabularnewline
31 & 31481 & 37080.8167227881 & -5599.81672278811 \tabularnewline
32 & 29896 & 30352.2776035736 & -456.277603573613 \tabularnewline
33 & 33842 & 35676.2518023743 & -1834.25180237435 \tabularnewline
34 & 39120 & 43506.0448835148 & -4386.04488351481 \tabularnewline
35 & 33702 & 30795.1657936729 & 2906.8342063271 \tabularnewline
36 & 25094 & 26857.2219833694 & -1763.22198336941 \tabularnewline
37 & 51442 & 54400.0506041279 & -2958.05060412793 \tabularnewline
38 & 45594 & 50298.2412433933 & -4704.24124339328 \tabularnewline
39 & 52518 & 57665.7021707125 & -5147.70217071245 \tabularnewline
40 & 48564 & 51405.7332016249 & -2841.73320162491 \tabularnewline
41 & 41745 & 41666.5442893954 & 78.4557106046486 \tabularnewline
42 & 49585 & 45136.3423104857 & 4448.65768951428 \tabularnewline
43 & 32747 & 37236.7638680828 & -4489.76386808284 \tabularnewline
44 & 33379 & 31880.7944786431 & 1498.20552135691 \tabularnewline
45 & 35645 & 37021.051573743 & -1376.05157374303 \tabularnewline
46 & 37034 & 44402.1753879582 & -7368.17538795821 \tabularnewline
47 & 35681 & 33471.6859842112 & 2209.31401578877 \tabularnewline
48 & 20972 & 27719.3739188527 & -6747.37391885266 \tabularnewline
49 & 58552 & 56342.3028500592 & 2209.69714994083 \tabularnewline
50 & 54955 & 51411.0243093198 & 3543.97569068022 \tabularnewline
51 & 65540 & 59011.6182069239 & 6528.38179307614 \tabularnewline
52 & 51570 & 53188.6022513755 & -1618.60225137547 \tabularnewline
53 & 51145 & 43912.8987163838 & 7232.10128361621 \tabularnewline
54 & 46641 & 49044.5896431659 & -2403.58964316585 \tabularnewline
55 & 35704 & 37674.9200302099 & -1970.92003020986 \tabularnewline
56 & 33253 & 34066.5997294569 & -813.599729456895 \tabularnewline
57 & 35193 & 38490.6902626281 & -3297.69026262814 \tabularnewline
58 & 41668 & 44210.1382392375 & -2542.13823923747 \tabularnewline
59 & 34865 & 35959.7782250818 & -1094.77822508181 \tabularnewline
\hline
\end{tabular}
%Source: https://freestatistics.org/blog/index.php?pk=11874&T=2

[TABLE]
[ROW][C]Interpolation Forecasts of Exponential Smoothing[/C][/ROW]
[ROW][C]t[/C][C]Observed[/C][C]Fitted[/C][C]Residuals[/C][/ROW]
[ROW][C]13[/C][C]50556[/C][C]50171.6294214468[/C][C]384.3705785532[/C][/ROW]
[ROW][C]14[/C][C]43901[/C][C]43650.1812576848[/C][C]250.818742315227[/C][/ROW]
[ROW][C]15[/C][C]48572[/C][C]48256.4676951532[/C][C]315.532304846805[/C][/ROW]
[ROW][C]16[/C][C]43899[/C][C]43485.1985085089[/C][C]413.801491491133[/C][/ROW]
[ROW][C]17[/C][C]37532[/C][C]37061.6413558757[/C][C]470.358644124302[/C][/ROW]
[ROW][C]18[/C][C]40357[/C][C]39576.6526546217[/C][C]780.347345378323[/C][/ROW]
[ROW][C]19[/C][C]35489[/C][C]34786.650148218[/C][C]702.34985178199[/C][/ROW]
[ROW][C]20[/C][C]29027[/C][C]28496.6182790210[/C][C]530.38172097904[/C][/ROW]
[ROW][C]21[/C][C]34485[/C][C]33333.4935209155[/C][C]1151.50647908451[/C][/ROW]
[ROW][C]22[/C][C]42598[/C][C]40405.2191833129[/C][C]2192.78081668707[/C][/ROW]
[ROW][C]23[/C][C]30306[/C][C]28538.3337504759[/C][C]1767.66624952406[/C][/ROW]
[ROW][C]24[/C][C]26451[/C][C]24889.1034369438[/C][C]1561.89656305622[/C][/ROW]
[ROW][C]25[/C][C]47460[/C][C]53355.5401722729[/C][C]-5895.54017227286[/C][/ROW]
[ROW][C]26[/C][C]50104[/C][C]46378.1540860574[/C][C]3725.84591394264[/C][/ROW]
[ROW][C]27[/C][C]61465[/C][C]51270.7390149161[/C][C]10194.2609850839[/C][/ROW]
[ROW][C]28[/C][C]53726[/C][C]46232.6955071597[/C][C]7493.30449284033[/C][/ROW]
[ROW][C]29[/C][C]39477[/C][C]39432.5263564695[/C][C]44.4736435305094[/C][/ROW]
[ROW][C]30[/C][C]43895[/C][C]42191.9369247988[/C][C]1703.06307520122[/C][/ROW]
[ROW][C]31[/C][C]31481[/C][C]37080.8167227881[/C][C]-5599.81672278811[/C][/ROW]
[ROW][C]32[/C][C]29896[/C][C]30352.2776035736[/C][C]-456.277603573613[/C][/ROW]
[ROW][C]33[/C][C]33842[/C][C]35676.2518023743[/C][C]-1834.25180237435[/C][/ROW]
[ROW][C]34[/C][C]39120[/C][C]43506.0448835148[/C][C]-4386.04488351481[/C][/ROW]
[ROW][C]35[/C][C]33702[/C][C]30795.1657936729[/C][C]2906.8342063271[/C][/ROW]
[ROW][C]36[/C][C]25094[/C][C]26857.2219833694[/C][C]-1763.22198336941[/C][/ROW]
[ROW][C]37[/C][C]51442[/C][C]54400.0506041279[/C][C]-2958.05060412793[/C][/ROW]
[ROW][C]38[/C][C]45594[/C][C]50298.2412433933[/C][C]-4704.24124339328[/C][/ROW]
[ROW][C]39[/C][C]52518[/C][C]57665.7021707125[/C][C]-5147.70217071245[/C][/ROW]
[ROW][C]40[/C][C]48564[/C][C]51405.7332016249[/C][C]-2841.73320162491[/C][/ROW]
[ROW][C]41[/C][C]41745[/C][C]41666.5442893954[/C][C]78.4557106046486[/C][/ROW]
[ROW][C]42[/C][C]49585[/C][C]45136.3423104857[/C][C]4448.65768951428[/C][/ROW]
[ROW][C]43[/C][C]32747[/C][C]37236.7638680828[/C][C]-4489.76386808284[/C][/ROW]
[ROW][C]44[/C][C]33379[/C][C]31880.7944786431[/C][C]1498.20552135691[/C][/ROW]
[ROW][C]45[/C][C]35645[/C][C]37021.051573743[/C][C]-1376.05157374303[/C][/ROW]
[ROW][C]46[/C][C]37034[/C][C]44402.1753879582[/C][C]-7368.17538795821[/C][/ROW]
[ROW][C]47[/C][C]35681[/C][C]33471.6859842112[/C][C]2209.31401578877[/C][/ROW]
[ROW][C]48[/C][C]20972[/C][C]27719.3739188527[/C][C]-6747.37391885266[/C][/ROW]
[ROW][C]49[/C][C]58552[/C][C]56342.3028500592[/C][C]2209.69714994083[/C][/ROW]
[ROW][C]50[/C][C]54955[/C][C]51411.0243093198[/C][C]3543.97569068022[/C][/ROW]
[ROW][C]51[/C][C]65540[/C][C]59011.6182069239[/C][C]6528.38179307614[/C][/ROW]
[ROW][C]52[/C][C]51570[/C][C]53188.6022513755[/C][C]-1618.60225137547[/C][/ROW]
[ROW][C]53[/C][C]51145[/C][C]43912.8987163838[/C][C]7232.10128361621[/C][/ROW]
[ROW][C]54[/C][C]46641[/C][C]49044.5896431659[/C][C]-2403.58964316585[/C][/ROW]
[ROW][C]55[/C][C]35704[/C][C]37674.9200302099[/C][C]-1970.92003020986[/C][/ROW]
[ROW][C]56[/C][C]33253[/C][C]34066.5997294569[/C][C]-813.599729456895[/C][/ROW]
[ROW][C]57[/C][C]35193[/C][C]38490.6902626281[/C][C]-3297.69026262814[/C][/ROW]
[ROW][C]58[/C][C]41668[/C][C]44210.1382392375[/C][C]-2542.13823923747[/C][/ROW]
[ROW][C]59[/C][C]34865[/C][C]35959.7782250818[/C][C]-1094.77822508181[/C][/ROW]
[/TABLE]
Source: https://freestatistics.org/blog/index.php?pk=11874&T=2

Globally Unique Identifier (entire table): ba.freestatistics.org/blog/index.php?pk=11874&T=2

As an alternative you can also use a QR Code:  

The GUIDs for individual cells are displayed in the table below:

Interpolation Forecasts of Exponential Smoothing
tObservedFittedResiduals
135055650171.6294214468384.3705785532
144390143650.1812576848250.818742315227
154857248256.4676951532315.532304846805
164389943485.1985085089413.801491491133
173753237061.6413558757470.358644124302
184035739576.6526546217780.347345378323
193548934786.650148218702.34985178199
202902728496.6182790210530.38172097904
213448533333.49352091551151.50647908451
224259840405.21918331292192.78081668707
233030628538.33375047591767.66624952406
242645124889.10343694381561.89656305622
254746053355.5401722729-5895.54017227286
265010446378.15408605743725.84591394264
276146551270.739014916110194.2609850839
285372646232.69550715977493.30449284033
293947739432.526356469544.4736435305094
304389542191.93692479881703.06307520122
313148137080.8167227881-5599.81672278811
322989630352.2776035736-456.277603573613
333384235676.2518023743-1834.25180237435
343912043506.0448835148-4386.04488351481
353370230795.16579367292906.8342063271
362509426857.2219833694-1763.22198336941
375144254400.0506041279-2958.05060412793
384559450298.2412433933-4704.24124339328
395251857665.7021707125-5147.70217071245
404856451405.7332016249-2841.73320162491
414174541666.544289395478.4557106046486
424958545136.34231048574448.65768951428
433274737236.7638680828-4489.76386808284
443337931880.79447864311498.20552135691
453564537021.051573743-1376.05157374303
463703444402.1753879582-7368.17538795821
473568133471.68598421122209.31401578877
482097227719.3739188527-6747.37391885266
495855256342.30285005922209.69714994083
505495551411.02430931983543.97569068022
516554059011.61820692396528.38179307614
525157053188.6022513755-1618.60225137547
535114543912.89871638387232.10128361621
544664149044.5896431659-2403.58964316585
553570437674.9200302099-1970.92003020986
563325334066.5997294569-813.599729456895
573519338490.6902626281-3297.69026262814
584166844210.1382392375-2542.13823923747
593486535959.7782250818-1094.77822508181


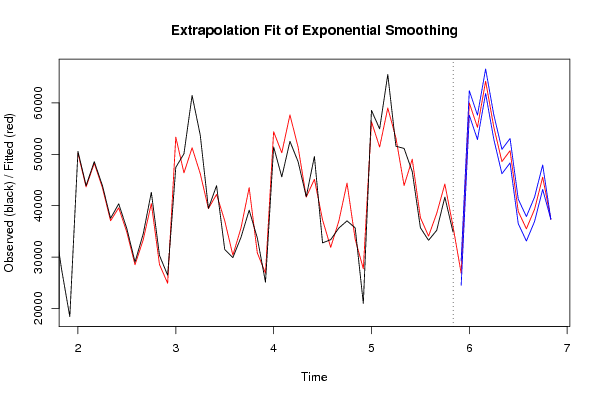
Extrapolation Forecasts of Exponential Smoothing
tForecast95% Lower Bound95% Upper Bound
6026857.601364611724478.276212586829236.9265166367
6159991.883756080257612.558604055262371.2089081051
6255248.898910310952869.57375828657628.2240623359
6364239.714766809361860.389614784366619.0399188342
6455340.297078171152960.971926146257719.6222301961
6548590.06131355246210.73616152750969.3864655769
6650698.573644738648319.248492713753077.8987967636
6738895.388642708236516.063490683241274.7137947331
6835491.930231102233112.605079077337871.2553831272
6939286.096186991736906.771034966741665.4213390166
7045537.510018138743158.184866113747916.8351701636
7137362.296716849337352.300148187137372.2932855114

\begin{tabular}{lllllllll}
\hline
Extrapolation Forecasts of Exponential Smoothing \tabularnewline
t & Forecast & 95% Lower Bound & 95% Upper Bound \tabularnewline
60 & 26857.6013646117 & 24478.2762125868 & 29236.9265166367 \tabularnewline
61 & 59991.8837560802 & 57612.5586040552 & 62371.2089081051 \tabularnewline
62 & 55248.8989103109 & 52869.573758286 & 57628.2240623359 \tabularnewline
63 & 64239.7147668093 & 61860.3896147843 & 66619.0399188342 \tabularnewline
64 & 55340.2970781711 & 52960.9719261462 & 57719.6222301961 \tabularnewline
65 & 48590.061313552 & 46210.736161527 & 50969.3864655769 \tabularnewline
66 & 50698.5736447386 & 48319.2484927137 & 53077.8987967636 \tabularnewline
67 & 38895.3886427082 & 36516.0634906832 & 41274.7137947331 \tabularnewline
68 & 35491.9302311022 & 33112.6050790773 & 37871.2553831272 \tabularnewline
69 & 39286.0961869917 & 36906.7710349667 & 41665.4213390166 \tabularnewline
70 & 45537.5100181387 & 43158.1848661137 & 47916.8351701636 \tabularnewline
71 & 37362.2967168493 & 37352.3001481871 & 37372.2932855114 \tabularnewline
\hline
\end{tabular}
%Source: https://freestatistics.org/blog/index.php?pk=11874&T=3

[TABLE]
[ROW][C]Extrapolation Forecasts of Exponential Smoothing[/C][/ROW]
[ROW][C]t[/C][C]Forecast[/C][C]95% Lower Bound[/C][C]95% Upper Bound[/C][/ROW]
[ROW][C]60[/C][C]26857.6013646117[/C][C]24478.2762125868[/C][C]29236.9265166367[/C][/ROW]
[ROW][C]61[/C][C]59991.8837560802[/C][C]57612.5586040552[/C][C]62371.2089081051[/C][/ROW]
[ROW][C]62[/C][C]55248.8989103109[/C][C]52869.573758286[/C][C]57628.2240623359[/C][/ROW]
[ROW][C]63[/C][C]64239.7147668093[/C][C]61860.3896147843[/C][C]66619.0399188342[/C][/ROW]
[ROW][C]64[/C][C]55340.2970781711[/C][C]52960.9719261462[/C][C]57719.6222301961[/C][/ROW]
[ROW][C]65[/C][C]48590.061313552[/C][C]46210.736161527[/C][C]50969.3864655769[/C][/ROW]
[ROW][C]66[/C][C]50698.5736447386[/C][C]48319.2484927137[/C][C]53077.8987967636[/C][/ROW]
[ROW][C]67[/C][C]38895.3886427082[/C][C]36516.0634906832[/C][C]41274.7137947331[/C][/ROW]
[ROW][C]68[/C][C]35491.9302311022[/C][C]33112.6050790773[/C][C]37871.2553831272[/C][/ROW]
[ROW][C]69[/C][C]39286.0961869917[/C][C]36906.7710349667[/C][C]41665.4213390166[/C][/ROW]
[ROW][C]70[/C][C]45537.5100181387[/C][C]43158.1848661137[/C][C]47916.8351701636[/C][/ROW]
[ROW][C]71[/C][C]37362.2967168493[/C][C]37352.3001481871[/C][C]37372.2932855114[/C][/ROW]
[/TABLE]
Source: https://freestatistics.org/blog/index.php?pk=11874&T=3

Globally Unique Identifier (entire table): ba.freestatistics.org/blog/index.php?pk=11874&T=3

As an alternative you can also use a QR Code:  

The GUIDs for individual cells are displayed in the table below:

Extrapolation Forecasts of Exponential Smoothing
tForecast95% Lower Bound95% Upper Bound
6026857.601364611724478.276212586829236.9265166367
6159991.883756080257612.558604055262371.2089081051
6255248.898910310952869.57375828657628.2240623359
6364239.714766809361860.389614784366619.0399188342
6455340.297078171152960.971926146257719.6222301961
6548590.06131355246210.73616152750969.3864655769
6650698.573644738648319.248492713753077.8987967636
6738895.388642708236516.063490683241274.7137947331
6835491.930231102233112.605079077337871.2553831272
6939286.096186991736906.771034966741665.4213390166
7045537.510018138743158.184866113747916.8351701636
7137362.296716849337352.300148187137372.2932855114


Parameters (Session):
par1 = 12 ; par2 = Triple ; par3 = multiplicative ;
Parameters (R input):
par1 = 12 ; par2 = Triple ; par3 = multiplicative ;
R code (references can be found in the software module):
par1 <- as.numeric(par1)
if (par2 == 'Single') K <- 1
if (par2 == 'Double') K <- 2
if (par2 == 'Triple') K <- par1
nx <- length(x)
nxmK <- nx - K
x <- ts(x, frequency = par1)
if (par2 == 'Single') fit <- HoltWinters(x, gamma=0, beta=0)
if (par2 == 'Double') fit <- HoltWinters(x, gamma=0)
if (par2 == 'Triple') fit <- HoltWinters(x, seasonal=par3)
fit
myresid <- x - fit$fitted[,'xhat']
bitmap(file='test1.png')
op <- par(mfrow=c(2,1))
plot(fit,ylab='Observed (black) / Fitted (red)',main='Interpolation Fit of Exponential Smoothing')
plot(myresid,ylab='Residuals',main='Interpolation Prediction Errors')
par(op)
dev.off()
bitmap(file='test2.png')
p <- predict(fit, par1, prediction.interval=TRUE)
np <- length(p[,1])
plot(fit,p,ylab='Observed (black) / Fitted (red)',main='Extrapolation Fit of Exponential Smoothing')
dev.off()
bitmap(file='test3.png')
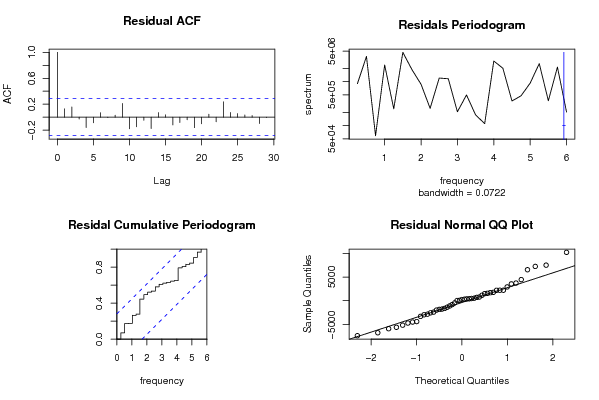
op <- par(mfrow = c(2,2))
acf(as.numeric(myresid),lag.max = nx/2,main='Residual ACF')
spectrum(myresid,main='Residals Periodogram')
cpgram(myresid,main='Residal Cumulative Periodogram')
qqnorm(myresid,main='Residual Normal QQ Plot')
qqline(myresid)
par(op)
dev.off()
load(file='createtable')
a<-table.start()
a<-table.row.start(a)
a<-table.element(a,'Estimated Parameters of Exponential Smoothing',2,TRUE)
a<-table.row.end(a)
a<-table.row.start(a)
a<-table.element(a,'Parameter',header=TRUE)
a<-table.element(a,'Value',header=TRUE)
a<-table.row.end(a)
a<-table.row.start(a)
a<-table.element(a,'alpha',header=TRUE)
a<-table.element(a,fit$alpha)
a<-table.row.end(a)
a<-table.row.start(a)
a<-table.element(a,'beta',header=TRUE)
a<-table.element(a,fit$beta)
a<-table.row.end(a)
a<-table.row.start(a)
a<-table.element(a,'gamma',header=TRUE)
a<-table.element(a,fit$gamma)
a<-table.row.end(a)
a<-table.end(a)
table.save(a,file='mytable.tab')
a<-table.start()
a<-table.row.start(a)
a<-table.element(a,'Interpolation Forecasts of Exponential Smoothing',4,TRUE)
a<-table.row.end(a)
a<-table.row.start(a)
a<-table.element(a,'t',header=TRUE)
a<-table.element(a,'Observed',header=TRUE)
a<-table.element(a,'Fitted',header=TRUE)
a<-table.element(a,'Residuals',header=TRUE)
a<-table.row.end(a)
for (i in 1:nxmK) {
a<-table.row.start(a)
a<-table.element(a,i+K,header=TRUE)
a<-table.element(a,x[i+K])
a<-table.element(a,fit$fitted[i,'xhat'])
a<-table.element(a,myresid[i])
a<-table.row.end(a)
}
a<-table.end(a)
table.save(a,file='mytable1.tab')
a<-table.start()
a<-table.row.start(a)
a<-table.element(a,'Extrapolation Forecasts of Exponential Smoothing',4,TRUE)
a<-table.row.end(a)
a<-table.row.start(a)
a<-table.element(a,'t',header=TRUE)
a<-table.element(a,'Forecast',header=TRUE)
a<-table.element(a,'95% Lower Bound',header=TRUE)
a<-table.element(a,'95% Upper Bound',header=TRUE)
a<-table.row.end(a)
for (i in 1:np) {
a<-table.row.start(a)
a<-table.element(a,nx+i,header=TRUE)
a<-table.element(a,p[i,'fit'])
a<-table.element(a,p[i,'lwr'])
a<-table.element(a,p[i,'upr'])
a<-table.row.end(a)
}
a<-table.end(a)
table.save(a,file='mytable2.tab')