Free Statistics

of Irreproducible Research!

Author's title

Author*Unverified author*
R Software Modulerwasp_smp.wasp
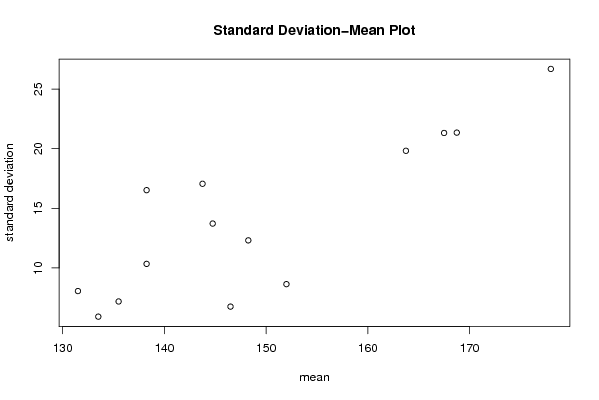
Title produced by softwareStandard Deviation-Mean Plot
Date of computationMon, 12 May 2008 09:15:30 -0600
Cite this page as followsStatistical Computations at FreeStatistics.org, Office for Research Development and Education, URL https://freestatistics.org/blog/index.php?v=date/2008/May/12/t1210605364o61ust20afv3y1u.htm/, Retrieved Mon, 13 May 2024 21:42:17 +0000
Statistical Computations at FreeStatistics.org, Office for Research Development and Education, URL https://freestatistics.org/blog/index.php?pk=12363, Retrieved Mon, 13 May 2024 21:42:17 +0000
QR Codes:

Original text written by user:
IsPrivate?No (this computation is public)
User-defined keywords
Estimated Impact176
Family? (F = Feedback message, R = changed R code, M = changed R Module, P = changed Parameters, D = changed Data)
-       [Standard Deviation-Mean Plot] [Maandelijkse Aust...] [2008-05-12 15:15:30] [678dd736c2ca43f11132dfe6e57daf69] [Current]
Feedback Forum

Post a new message
Dataseries X:
164
148
152
144
155
125
153
146
138
190
192
192
147
133
163
150
129
131
145
137
138
168
176
188
139
143
150
154
137
129
128
140
143
151
177
184
151
134
164
126
131
125
127
143
143
160
190
182
138
136
152
127
151
130
119
153


Summary of computational transaction
Raw Inputview raw input (R code)
Raw Outputview raw output of R engine
Computing time2 seconds
R Server'Sir Ronald Aylmer Fisher' @ 193.190.124.24

\begin{tabular}{lllllllll}
\hline
Summary of computational transaction \tabularnewline
Raw Input & view raw input (R code)  \tabularnewline
Raw Output & view raw output of R engine  \tabularnewline
Computing time & 2 seconds \tabularnewline
R Server & 'Sir Ronald Aylmer Fisher' @ 193.190.124.24 \tabularnewline
\hline
\end{tabular}
%Source: https://freestatistics.org/blog/index.php?pk=12363&T=0

[TABLE]
[ROW][C]Summary of computational transaction[/C][/ROW]
[ROW][C]Raw Input[/C][C]view raw input (R code) [/C][/ROW]
[ROW][C]Raw Output[/C][C]view raw output of R engine [/C][/ROW]
[ROW][C]Computing time[/C][C]2 seconds[/C][/ROW]
[ROW][C]R Server[/C][C]'Sir Ronald Aylmer Fisher' @ 193.190.124.24[/C][/ROW]
[/TABLE]
Source: https://freestatistics.org/blog/index.php?pk=12363&T=0

Globally Unique Identifier (entire table): ba.freestatistics.org/blog/index.php?pk=12363&T=0

As an alternative you can also use a QR Code:  

The GUIDs for individual cells are displayed in the table below:

Summary of computational transaction
Raw Inputview raw input (R code)
Raw Outputview raw output of R engine
Computing time2 seconds
R Server'Sir Ronald Aylmer Fisher' @ 193.190.124.24


Standard Deviation-Mean Plot
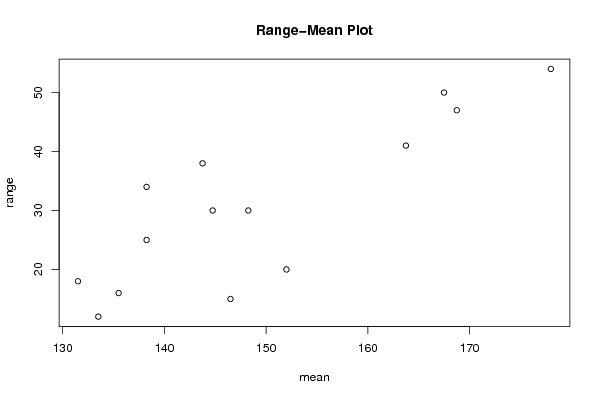
SectionMeanStandard DeviationRange
11528.6409875978771520
2144.7513.720422734012230
317826.683328128252754
4148.2512.311918344975130
5135.57.1879528842826116
6167.521.315096371664250
7146.56.7577116442377615
8133.55.9160797830996212
9163.7519.822125684867141
10143.7517.056279391082538
11131.58.0622577482985518
12168.7521.344398172198147
13138.2510.340051579497425
14138.2516.520189667999234

\begin{tabular}{lllllllll}
\hline
Standard Deviation-Mean Plot \tabularnewline
Section & Mean & Standard Deviation & Range \tabularnewline
1 & 152 & 8.64098759787715 & 20 \tabularnewline
2 & 144.75 & 13.7204227340122 & 30 \tabularnewline
3 & 178 & 26.6833281282527 & 54 \tabularnewline
4 & 148.25 & 12.3119183449751 & 30 \tabularnewline
5 & 135.5 & 7.18795288428261 & 16 \tabularnewline
6 & 167.5 & 21.3150963716642 & 50 \tabularnewline
7 & 146.5 & 6.75771164423776 & 15 \tabularnewline
8 & 133.5 & 5.91607978309962 & 12 \tabularnewline
9 & 163.75 & 19.8221256848671 & 41 \tabularnewline
10 & 143.75 & 17.0562793910825 & 38 \tabularnewline
11 & 131.5 & 8.06225774829855 & 18 \tabularnewline
12 & 168.75 & 21.3443981721981 & 47 \tabularnewline
13 & 138.25 & 10.3400515794974 & 25 \tabularnewline
14 & 138.25 & 16.5201896679992 & 34 \tabularnewline
\hline
\end{tabular}
%Source: https://freestatistics.org/blog/index.php?pk=12363&T=1

[TABLE]
[ROW][C]Standard Deviation-Mean Plot[/C][/ROW]
[ROW][C]Section[/C][C]Mean[/C][C]Standard Deviation[/C][C]Range[/C][/ROW]
[ROW][C]1[/C][C]152[/C][C]8.64098759787715[/C][C]20[/C][/ROW]
[ROW][C]2[/C][C]144.75[/C][C]13.7204227340122[/C][C]30[/C][/ROW]
[ROW][C]3[/C][C]178[/C][C]26.6833281282527[/C][C]54[/C][/ROW]
[ROW][C]4[/C][C]148.25[/C][C]12.3119183449751[/C][C]30[/C][/ROW]
[ROW][C]5[/C][C]135.5[/C][C]7.18795288428261[/C][C]16[/C][/ROW]
[ROW][C]6[/C][C]167.5[/C][C]21.3150963716642[/C][C]50[/C][/ROW]
[ROW][C]7[/C][C]146.5[/C][C]6.75771164423776[/C][C]15[/C][/ROW]
[ROW][C]8[/C][C]133.5[/C][C]5.91607978309962[/C][C]12[/C][/ROW]
[ROW][C]9[/C][C]163.75[/C][C]19.8221256848671[/C][C]41[/C][/ROW]
[ROW][C]10[/C][C]143.75[/C][C]17.0562793910825[/C][C]38[/C][/ROW]
[ROW][C]11[/C][C]131.5[/C][C]8.06225774829855[/C][C]18[/C][/ROW]
[ROW][C]12[/C][C]168.75[/C][C]21.3443981721981[/C][C]47[/C][/ROW]
[ROW][C]13[/C][C]138.25[/C][C]10.3400515794974[/C][C]25[/C][/ROW]
[ROW][C]14[/C][C]138.25[/C][C]16.5201896679992[/C][C]34[/C][/ROW]
[/TABLE]
Source: https://freestatistics.org/blog/index.php?pk=12363&T=1

Globally Unique Identifier (entire table): ba.freestatistics.org/blog/index.php?pk=12363&T=1

As an alternative you can also use a QR Code:  

The GUIDs for individual cells are displayed in the table below:

Standard Deviation-Mean Plot
SectionMeanStandard DeviationRange
11528.6409875978771520
2144.7513.720422734012230
317826.683328128252754
4148.2512.311918344975130
5135.57.1879528842826116
6167.521.315096371664250
7146.56.7577116442377615
8133.55.9160797830996212
9163.7519.822125684867141
10143.7517.056279391082538
11131.58.0622577482985518
12168.7521.344398172198147
13138.2510.340051579497425
14138.2516.520189667999234


Regression: S.E.(k) = alpha + beta * Mean(k)
alpha-42.1152948508762
beta0.375693303501787
S.D.0.0700797358691667
T-STAT5.36094063201346
p-value0.00017054927329111

\begin{tabular}{lllllllll}
\hline
Regression: S.E.(k) = alpha + beta * Mean(k) \tabularnewline
alpha & -42.1152948508762 \tabularnewline
beta & 0.375693303501787 \tabularnewline
S.D. & 0.0700797358691667 \tabularnewline
T-STAT & 5.36094063201346 \tabularnewline
p-value & 0.00017054927329111 \tabularnewline
\hline
\end{tabular}
%Source: https://freestatistics.org/blog/index.php?pk=12363&T=2

[TABLE]
[ROW][C]Regression: S.E.(k) = alpha + beta * Mean(k)[/C][/ROW]
[ROW][C]alpha[/C][C]-42.1152948508762[/C][/ROW]
[ROW][C]beta[/C][C]0.375693303501787[/C][/ROW]
[ROW][C]S.D.[/C][C]0.0700797358691667[/C][/ROW]
[ROW][C]T-STAT[/C][C]5.36094063201346[/C][/ROW]
[ROW][C]p-value[/C][C]0.00017054927329111[/C][/ROW]
[/TABLE]
Source: https://freestatistics.org/blog/index.php?pk=12363&T=2

Globally Unique Identifier (entire table): ba.freestatistics.org/blog/index.php?pk=12363&T=2

As an alternative you can also use a QR Code:  

The GUIDs for individual cells are displayed in the table below:

Regression: S.E.(k) = alpha + beta * Mean(k)
alpha-42.1152948508762
beta0.375693303501787
S.D.0.0700797358691667
T-STAT5.36094063201346
p-value0.00017054927329111


Regression: ln S.E.(k) = alpha + beta * ln Mean(k)
alpha-17.3976169228647
beta3.98398006314028
S.D.0.926281027174341
T-STAT4.30104897570188
p-value0.00102998413118919
Lambda-2.98398006314028

\begin{tabular}{lllllllll}
\hline
Regression: ln S.E.(k) = alpha + beta * ln Mean(k) \tabularnewline
alpha & -17.3976169228647 \tabularnewline
beta & 3.98398006314028 \tabularnewline
S.D. & 0.926281027174341 \tabularnewline
T-STAT & 4.30104897570188 \tabularnewline
p-value & 0.00102998413118919 \tabularnewline
Lambda & -2.98398006314028 \tabularnewline
\hline
\end{tabular}
%Source: https://freestatistics.org/blog/index.php?pk=12363&T=3

[TABLE]
[ROW][C]Regression: ln S.E.(k) = alpha + beta * ln Mean(k)[/C][/ROW]
[ROW][C]alpha[/C][C]-17.3976169228647[/C][/ROW]
[ROW][C]beta[/C][C]3.98398006314028[/C][/ROW]
[ROW][C]S.D.[/C][C]0.926281027174341[/C][/ROW]
[ROW][C]T-STAT[/C][C]4.30104897570188[/C][/ROW]
[ROW][C]p-value[/C][C]0.00102998413118919[/C][/ROW]
[ROW][C]Lambda[/C][C]-2.98398006314028[/C][/ROW]
[/TABLE]
Source: https://freestatistics.org/blog/index.php?pk=12363&T=3

Globally Unique Identifier (entire table): ba.freestatistics.org/blog/index.php?pk=12363&T=3

As an alternative you can also use a QR Code:  

The GUIDs for individual cells are displayed in the table below:

Regression: ln S.E.(k) = alpha + beta * ln Mean(k)
alpha-17.3976169228647
beta3.98398006314028
S.D.0.926281027174341
T-STAT4.30104897570188
p-value0.00102998413118919
Lambda-2.98398006314028


Parameters (Session):
par1 = 4 ;
Parameters (R input):
par1 = 4 ;
R code (references can be found in the software module):
par1 <- as.numeric(par1)
(n <- length(x))
(np <- floor(n / par1))
arr <- array(NA,dim=c(par1,np))
j <- 0
k <- 1
for (i in 1:(np*par1))
{
j = j + 1
arr[j,k] <- x[i]
if (j == par1) {
j = 0
k=k+1
}
}
arr
arr.mean <- array(NA,dim=np)
arr.sd <- array(NA,dim=np)
arr.range <- array(NA,dim=np)
for (j in 1:np)
{
arr.mean[j] <- mean(arr[,j],na.rm=TRUE)
arr.sd[j] <- sd(arr[,j],na.rm=TRUE)
arr.range[j] <- max(arr[,j],na.rm=TRUE) - min(arr[,j],na.rm=TRUE)
}
arr.mean
arr.sd
arr.range
(lm1 <- lm(arr.sd~arr.mean))
(lnlm1 <- lm(log(arr.sd)~log(arr.mean)))
(lm2 <- lm(arr.range~arr.mean))
bitmap(file='test1.png')
plot(arr.mean,arr.sd,main='Standard Deviation-Mean Plot',xlab='mean',ylab='standard deviation')
dev.off()
bitmap(file='test2.png')
plot(arr.mean,arr.range,main='Range-Mean Plot',xlab='mean',ylab='range')
dev.off()
load(file='createtable')
a<-table.start()
a<-table.row.start(a)
a<-table.element(a,'Standard Deviation-Mean Plot',4,TRUE)
a<-table.row.end(a)
a<-table.row.start(a)
a<-table.element(a,'Section',header=TRUE)
a<-table.element(a,'Mean',header=TRUE)
a<-table.element(a,'Standard Deviation',header=TRUE)
a<-table.element(a,'Range',header=TRUE)
a<-table.row.end(a)
for (j in 1:np) {
a<-table.row.start(a)
a<-table.element(a,j,header=TRUE)
a<-table.element(a,arr.mean[j])
a<-table.element(a,arr.sd[j] )
a<-table.element(a,arr.range[j] )
a<-table.row.end(a)
}
a<-table.end(a)
table.save(a,file='mytable.tab')
a<-table.start()
a<-table.row.start(a)
a<-table.element(a,'Regression: S.E.(k) = alpha + beta * Mean(k)',2,TRUE)
a<-table.row.end(a)
a<-table.row.start(a)
a<-table.element(a,'alpha',header=TRUE)
a<-table.element(a,lm1$coefficients[[1]])
a<-table.row.end(a)
a<-table.row.start(a)
a<-table.element(a,'beta',header=TRUE)
a<-table.element(a,lm1$coefficients[[2]])
a<-table.row.end(a)
a<-table.row.start(a)
a<-table.element(a,'S.D.',header=TRUE)
a<-table.element(a,summary(lm1)$coefficients[2,2])
a<-table.row.end(a)
a<-table.row.start(a)
a<-table.element(a,'T-STAT',header=TRUE)
a<-table.element(a,summary(lm1)$coefficients[2,3])
a<-table.row.end(a)
a<-table.row.start(a)
a<-table.element(a,'p-value',header=TRUE)
a<-table.element(a,summary(lm1)$coefficients[2,4])
a<-table.row.end(a)
a<-table.end(a)
table.save(a,file='mytable1.tab')
a<-table.start()
a<-table.row.start(a)
a<-table.element(a,'Regression: ln S.E.(k) = alpha + beta * ln Mean(k)',2,TRUE)
a<-table.row.end(a)
a<-table.row.start(a)
a<-table.element(a,'alpha',header=TRUE)
a<-table.element(a,lnlm1$coefficients[[1]])
a<-table.row.end(a)
a<-table.row.start(a)
a<-table.element(a,'beta',header=TRUE)
a<-table.element(a,lnlm1$coefficients[[2]])
a<-table.row.end(a)
a<-table.row.start(a)
a<-table.element(a,'S.D.',header=TRUE)
a<-table.element(a,summary(lnlm1)$coefficients[2,2])
a<-table.row.end(a)
a<-table.row.start(a)
a<-table.element(a,'T-STAT',header=TRUE)
a<-table.element(a,summary(lnlm1)$coefficients[2,3])
a<-table.row.end(a)
a<-table.row.start(a)
a<-table.element(a,'p-value',header=TRUE)
a<-table.element(a,summary(lnlm1)$coefficients[2,4])
a<-table.row.end(a)
a<-table.row.start(a)
a<-table.element(a,'Lambda',header=TRUE)
a<-table.element(a,1-lnlm1$coefficients[[2]])
a<-table.row.end(a)
a<-table.end(a)
table.save(a,file='mytable2.tab')