Free Statistics

of Irreproducible Research!

Author's title

Author*Unverified author*
R Software Modulerwasp_smp.wasp
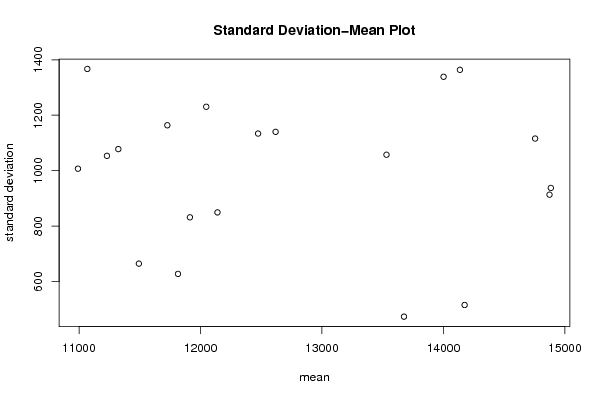
Title produced by softwareStandard Deviation-Mean Plot
Date of computationMon, 12 May 2008 13:53:30 -0600
Cite this page as followsStatistical Computations at FreeStatistics.org, Office for Research Development and Education, URL https://freestatistics.org/blog/index.php?v=date/2008/May/12/t1210622083u4zludtq1b38zto.htm/, Retrieved Tue, 14 May 2024 00:44:59 +0000
Statistical Computations at FreeStatistics.org, Office for Research Development and Education, URL https://freestatistics.org/blog/index.php?pk=12432, Retrieved Tue, 14 May 2024 00:44:59 +0000
QR Codes:

Original text written by user:
IsPrivate?No (this computation is public)
User-defined keywords
Estimated Impact198
Family? (F = Feedback message, R = changed R code, M = changed R Module, P = changed Parameters, D = changed Data)
-       [Standard Deviation-Mean Plot] [Van Passen Glenn ...] [2008-05-12 19:53:30] [7568f24034461b5d7b2d183bbb217711] [Current]
-   PD    [Standard Deviation-Mean Plot] [Van Passen Glenn ...] [2008-06-01 11:46:49] [74be16979710d4c4e7c6647856088456]
Feedback Forum

Post a new message
Dataseries X:
11835.70
11542.20
13093.70
11180.20
12035.70
12112.00
10875.20
9897.30
11672.10
12385.70
11405.60
9830.90
11025.10
10853.80
12252.60
11839.40
11669.10
11601.40
11178.40
9516.40
12102.80
12989.00
11610.20
10205.50
11356.20
11307.10
12648.60
11947.20
11714.10
12192.50
11268.80
9097.40
12639.80
13040.10
11687.30
11191.70
11391.90
11793.10
13933.20
12778.10
11810.30
13698.40
11956.60
10723.80
13938.90
13979.80
13807.40
12973.90
12509.80
12934.10
14908.30
13772.10
13012.60
14049.90
11816.50
11593.20
14466.20
13615.90
14733.90
13880.70
13527.50
13584.00
16170.20
13260.60
14741.90
15486.50
13154.50
12621.20
15031.60
15452.40
15428.00
13105.90
14716.80
14180.00
16202.20
14392.40
15140.60
15960.10
14729.90
13705.20
15728.50
17315.60
16152.80


Summary of computational transaction
Raw Inputview raw input (R code)
Raw Outputview raw output of R engine
Computing time3 seconds
R Server'Sir Ronald Aylmer Fisher' @ 193.190.124.24

\begin{tabular}{lllllllll}
\hline
Summary of computational transaction \tabularnewline
Raw Input & view raw input (R code)  \tabularnewline
Raw Output & view raw output of R engine  \tabularnewline
Computing time & 3 seconds \tabularnewline
R Server & 'Sir Ronald Aylmer Fisher' @ 193.190.124.24 \tabularnewline
\hline
\end{tabular}
%Source: https://freestatistics.org/blog/index.php?pk=12432&T=0

[TABLE]
[ROW][C]Summary of computational transaction[/C][/ROW]
[ROW][C]Raw Input[/C][C]view raw input (R code) [/C][/ROW]
[ROW][C]Raw Output[/C][C]view raw output of R engine [/C][/ROW]
[ROW][C]Computing time[/C][C]3 seconds[/C][/ROW]
[ROW][C]R Server[/C][C]'Sir Ronald Aylmer Fisher' @ 193.190.124.24[/C][/ROW]
[/TABLE]
Source: https://freestatistics.org/blog/index.php?pk=12432&T=0

Globally Unique Identifier (entire table): ba.freestatistics.org/blog/index.php?pk=12432&T=0

As an alternative you can also use a QR Code:  

The GUIDs for individual cells are displayed in the table below:

Summary of computational transaction
Raw Inputview raw input (R code)
Raw Outputview raw output of R engine
Computing time3 seconds
R Server'Sir Ronald Aylmer Fisher' @ 193.190.124.24


Standard Deviation-Mean Plot
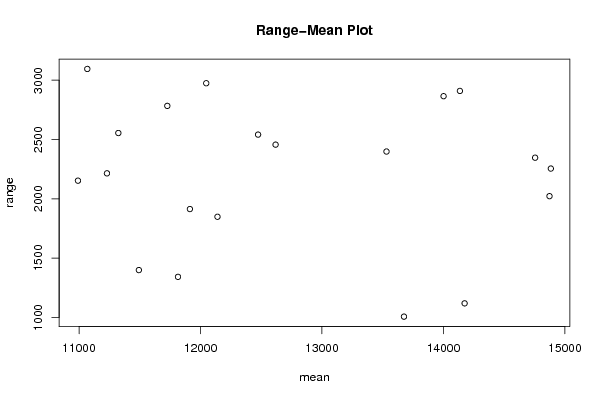
SectionMeanStandard DeviationRange
111912.95831.5680469250051913.5
211230.051053.414892939472214.7
311323.5751077.711456049352554.8
411492.725664.4526237187021398.8
510991.3251006.970914426032152.7
611726.8751163.682956178362783.5
711814.775627.3822459234881341.5
811068.21366.934563174113095.1
912139.725849.3507181959641848.4
1012474.0751133.770501100942541.3
1112047.2751230.471311801572974.6
1213675473.1515683865651005.9
1313531.0751057.390424189032398.5
1412618.051139.980124095742456.7
1514174.175515.2246201091971118
1614135.5751363.728996477432909.6
1714001.0251338.662684360782865.3
1814754.4751115.845423509312346.5
1914872.85913.3083360326172022.2
2014883.95937.5768430729652254.9

\begin{tabular}{lllllllll}
\hline
Standard Deviation-Mean Plot \tabularnewline
Section & Mean & Standard Deviation & Range \tabularnewline
1 & 11912.95 & 831.568046925005 & 1913.5 \tabularnewline
2 & 11230.05 & 1053.41489293947 & 2214.7 \tabularnewline
3 & 11323.575 & 1077.71145604935 & 2554.8 \tabularnewline
4 & 11492.725 & 664.452623718702 & 1398.8 \tabularnewline
5 & 10991.325 & 1006.97091442603 & 2152.7 \tabularnewline
6 & 11726.875 & 1163.68295617836 & 2783.5 \tabularnewline
7 & 11814.775 & 627.382245923488 & 1341.5 \tabularnewline
8 & 11068.2 & 1366.93456317411 & 3095.1 \tabularnewline
9 & 12139.725 & 849.350718195964 & 1848.4 \tabularnewline
10 & 12474.075 & 1133.77050110094 & 2541.3 \tabularnewline
11 & 12047.275 & 1230.47131180157 & 2974.6 \tabularnewline
12 & 13675 & 473.151568386565 & 1005.9 \tabularnewline
13 & 13531.075 & 1057.39042418903 & 2398.5 \tabularnewline
14 & 12618.05 & 1139.98012409574 & 2456.7 \tabularnewline
15 & 14174.175 & 515.224620109197 & 1118 \tabularnewline
16 & 14135.575 & 1363.72899647743 & 2909.6 \tabularnewline
17 & 14001.025 & 1338.66268436078 & 2865.3 \tabularnewline
18 & 14754.475 & 1115.84542350931 & 2346.5 \tabularnewline
19 & 14872.85 & 913.308336032617 & 2022.2 \tabularnewline
20 & 14883.95 & 937.576843072965 & 2254.9 \tabularnewline
\hline
\end{tabular}
%Source: https://freestatistics.org/blog/index.php?pk=12432&T=1

[TABLE]
[ROW][C]Standard Deviation-Mean Plot[/C][/ROW]
[ROW][C]Section[/C][C]Mean[/C][C]Standard Deviation[/C][C]Range[/C][/ROW]
[ROW][C]1[/C][C]11912.95[/C][C]831.568046925005[/C][C]1913.5[/C][/ROW]
[ROW][C]2[/C][C]11230.05[/C][C]1053.41489293947[/C][C]2214.7[/C][/ROW]
[ROW][C]3[/C][C]11323.575[/C][C]1077.71145604935[/C][C]2554.8[/C][/ROW]
[ROW][C]4[/C][C]11492.725[/C][C]664.452623718702[/C][C]1398.8[/C][/ROW]
[ROW][C]5[/C][C]10991.325[/C][C]1006.97091442603[/C][C]2152.7[/C][/ROW]
[ROW][C]6[/C][C]11726.875[/C][C]1163.68295617836[/C][C]2783.5[/C][/ROW]
[ROW][C]7[/C][C]11814.775[/C][C]627.382245923488[/C][C]1341.5[/C][/ROW]
[ROW][C]8[/C][C]11068.2[/C][C]1366.93456317411[/C][C]3095.1[/C][/ROW]
[ROW][C]9[/C][C]12139.725[/C][C]849.350718195964[/C][C]1848.4[/C][/ROW]
[ROW][C]10[/C][C]12474.075[/C][C]1133.77050110094[/C][C]2541.3[/C][/ROW]
[ROW][C]11[/C][C]12047.275[/C][C]1230.47131180157[/C][C]2974.6[/C][/ROW]
[ROW][C]12[/C][C]13675[/C][C]473.151568386565[/C][C]1005.9[/C][/ROW]
[ROW][C]13[/C][C]13531.075[/C][C]1057.39042418903[/C][C]2398.5[/C][/ROW]
[ROW][C]14[/C][C]12618.05[/C][C]1139.98012409574[/C][C]2456.7[/C][/ROW]
[ROW][C]15[/C][C]14174.175[/C][C]515.224620109197[/C][C]1118[/C][/ROW]
[ROW][C]16[/C][C]14135.575[/C][C]1363.72899647743[/C][C]2909.6[/C][/ROW]
[ROW][C]17[/C][C]14001.025[/C][C]1338.66268436078[/C][C]2865.3[/C][/ROW]
[ROW][C]18[/C][C]14754.475[/C][C]1115.84542350931[/C][C]2346.5[/C][/ROW]
[ROW][C]19[/C][C]14872.85[/C][C]913.308336032617[/C][C]2022.2[/C][/ROW]
[ROW][C]20[/C][C]14883.95[/C][C]937.576843072965[/C][C]2254.9[/C][/ROW]
[/TABLE]
Source: https://freestatistics.org/blog/index.php?pk=12432&T=1

Globally Unique Identifier (entire table): ba.freestatistics.org/blog/index.php?pk=12432&T=1

As an alternative you can also use a QR Code:  

The GUIDs for individual cells are displayed in the table below:

Standard Deviation-Mean Plot
SectionMeanStandard DeviationRange
111912.95831.5680469250051913.5
211230.051053.414892939472214.7
311323.5751077.711456049352554.8
411492.725664.4526237187021398.8
510991.3251006.970914426032152.7
611726.8751163.682956178362783.5
711814.775627.3822459234881341.5
811068.21366.934563174113095.1
912139.725849.3507181959641848.4
1012474.0751133.770501100942541.3
1112047.2751230.471311801572974.6
1213675473.1515683865651005.9
1313531.0751057.390424189032398.5
1412618.051139.980124095742456.7
1514174.175515.2246201091971118
1614135.5751363.728996477432909.6
1714001.0251338.662684360782865.3
1814754.4751115.845423509312346.5
1914872.85913.3083360326172022.2
2014883.95937.5768430729652254.9


Regression: S.E.(k) = alpha + beta * Mean(k)
alpha1170.4888770294
beta-0.0139256482550758
S.D.0.0458596397183553
T-STAT-0.303658038759124
p-value0.764870458517583

\begin{tabular}{lllllllll}
\hline
Regression: S.E.(k) = alpha + beta * Mean(k) \tabularnewline
alpha & 1170.4888770294 \tabularnewline
beta & -0.0139256482550758 \tabularnewline
S.D. & 0.0458596397183553 \tabularnewline
T-STAT & -0.303658038759124 \tabularnewline
p-value & 0.764870458517583 \tabularnewline
\hline
\end{tabular}
%Source: https://freestatistics.org/blog/index.php?pk=12432&T=2

[TABLE]
[ROW][C]Regression: S.E.(k) = alpha + beta * Mean(k)[/C][/ROW]
[ROW][C]alpha[/C][C]1170.4888770294[/C][/ROW]
[ROW][C]beta[/C][C]-0.0139256482550758[/C][/ROW]
[ROW][C]S.D.[/C][C]0.0458596397183553[/C][/ROW]
[ROW][C]T-STAT[/C][C]-0.303658038759124[/C][/ROW]
[ROW][C]p-value[/C][C]0.764870458517583[/C][/ROW]
[/TABLE]
Source: https://freestatistics.org/blog/index.php?pk=12432&T=2

Globally Unique Identifier (entire table): ba.freestatistics.org/blog/index.php?pk=12432&T=2

As an alternative you can also use a QR Code:  

The GUIDs for individual cells are displayed in the table below:

Regression: S.E.(k) = alpha + beta * Mean(k)
alpha1170.4888770294
beta-0.0139256482550758
S.D.0.0458596397183553
T-STAT-0.303658038759124
p-value0.764870458517583


Regression: ln S.E.(k) = alpha + beta * ln Mean(k)
alpha9.70350865082888
beta-0.30101021148003
S.D.0.682345480499451
T-STAT-0.441140478075273
p-value0.664364357437092
Lambda1.30101021148003

\begin{tabular}{lllllllll}
\hline
Regression: ln S.E.(k) = alpha + beta * ln Mean(k) \tabularnewline
alpha & 9.70350865082888 \tabularnewline
beta & -0.30101021148003 \tabularnewline
S.D. & 0.682345480499451 \tabularnewline
T-STAT & -0.441140478075273 \tabularnewline
p-value & 0.664364357437092 \tabularnewline
Lambda & 1.30101021148003 \tabularnewline
\hline
\end{tabular}
%Source: https://freestatistics.org/blog/index.php?pk=12432&T=3

[TABLE]
[ROW][C]Regression: ln S.E.(k) = alpha + beta * ln Mean(k)[/C][/ROW]
[ROW][C]alpha[/C][C]9.70350865082888[/C][/ROW]
[ROW][C]beta[/C][C]-0.30101021148003[/C][/ROW]
[ROW][C]S.D.[/C][C]0.682345480499451[/C][/ROW]
[ROW][C]T-STAT[/C][C]-0.441140478075273[/C][/ROW]
[ROW][C]p-value[/C][C]0.664364357437092[/C][/ROW]
[ROW][C]Lambda[/C][C]1.30101021148003[/C][/ROW]
[/TABLE]
Source: https://freestatistics.org/blog/index.php?pk=12432&T=3

Globally Unique Identifier (entire table): ba.freestatistics.org/blog/index.php?pk=12432&T=3

As an alternative you can also use a QR Code:  

The GUIDs for individual cells are displayed in the table below:

Regression: ln S.E.(k) = alpha + beta * ln Mean(k)
alpha9.70350865082888
beta-0.30101021148003
S.D.0.682345480499451
T-STAT-0.441140478075273
p-value0.664364357437092
Lambda1.30101021148003


Parameters (Session):
par1 = 4 ;
Parameters (R input):
par1 = 4 ;
R code (references can be found in the software module):
par1 <- as.numeric(par1)
(n <- length(x))
(np <- floor(n / par1))
arr <- array(NA,dim=c(par1,np))
j <- 0
k <- 1
for (i in 1:(np*par1))
{
j = j + 1
arr[j,k] <- x[i]
if (j == par1) {
j = 0
k=k+1
}
}
arr
arr.mean <- array(NA,dim=np)
arr.sd <- array(NA,dim=np)
arr.range <- array(NA,dim=np)
for (j in 1:np)
{
arr.mean[j] <- mean(arr[,j],na.rm=TRUE)
arr.sd[j] <- sd(arr[,j],na.rm=TRUE)
arr.range[j] <- max(arr[,j],na.rm=TRUE) - min(arr[,j],na.rm=TRUE)
}
arr.mean
arr.sd
arr.range
(lm1 <- lm(arr.sd~arr.mean))
(lnlm1 <- lm(log(arr.sd)~log(arr.mean)))
(lm2 <- lm(arr.range~arr.mean))
bitmap(file='test1.png')
plot(arr.mean,arr.sd,main='Standard Deviation-Mean Plot',xlab='mean',ylab='standard deviation')
dev.off()
bitmap(file='test2.png')
plot(arr.mean,arr.range,main='Range-Mean Plot',xlab='mean',ylab='range')
dev.off()
load(file='createtable')
a<-table.start()
a<-table.row.start(a)
a<-table.element(a,'Standard Deviation-Mean Plot',4,TRUE)
a<-table.row.end(a)
a<-table.row.start(a)
a<-table.element(a,'Section',header=TRUE)
a<-table.element(a,'Mean',header=TRUE)
a<-table.element(a,'Standard Deviation',header=TRUE)
a<-table.element(a,'Range',header=TRUE)
a<-table.row.end(a)
for (j in 1:np) {
a<-table.row.start(a)
a<-table.element(a,j,header=TRUE)
a<-table.element(a,arr.mean[j])
a<-table.element(a,arr.sd[j] )
a<-table.element(a,arr.range[j] )
a<-table.row.end(a)
}
a<-table.end(a)
table.save(a,file='mytable.tab')
a<-table.start()
a<-table.row.start(a)
a<-table.element(a,'Regression: S.E.(k) = alpha + beta * Mean(k)',2,TRUE)
a<-table.row.end(a)
a<-table.row.start(a)
a<-table.element(a,'alpha',header=TRUE)
a<-table.element(a,lm1$coefficients[[1]])
a<-table.row.end(a)
a<-table.row.start(a)
a<-table.element(a,'beta',header=TRUE)
a<-table.element(a,lm1$coefficients[[2]])
a<-table.row.end(a)
a<-table.row.start(a)
a<-table.element(a,'S.D.',header=TRUE)
a<-table.element(a,summary(lm1)$coefficients[2,2])
a<-table.row.end(a)
a<-table.row.start(a)
a<-table.element(a,'T-STAT',header=TRUE)
a<-table.element(a,summary(lm1)$coefficients[2,3])
a<-table.row.end(a)
a<-table.row.start(a)
a<-table.element(a,'p-value',header=TRUE)
a<-table.element(a,summary(lm1)$coefficients[2,4])
a<-table.row.end(a)
a<-table.end(a)
table.save(a,file='mytable1.tab')
a<-table.start()
a<-table.row.start(a)
a<-table.element(a,'Regression: ln S.E.(k) = alpha + beta * ln Mean(k)',2,TRUE)
a<-table.row.end(a)
a<-table.row.start(a)
a<-table.element(a,'alpha',header=TRUE)
a<-table.element(a,lnlm1$coefficients[[1]])
a<-table.row.end(a)
a<-table.row.start(a)
a<-table.element(a,'beta',header=TRUE)
a<-table.element(a,lnlm1$coefficients[[2]])
a<-table.row.end(a)
a<-table.row.start(a)
a<-table.element(a,'S.D.',header=TRUE)
a<-table.element(a,summary(lnlm1)$coefficients[2,2])
a<-table.row.end(a)
a<-table.row.start(a)
a<-table.element(a,'T-STAT',header=TRUE)
a<-table.element(a,summary(lnlm1)$coefficients[2,3])
a<-table.row.end(a)
a<-table.row.start(a)
a<-table.element(a,'p-value',header=TRUE)
a<-table.element(a,summary(lnlm1)$coefficients[2,4])
a<-table.row.end(a)
a<-table.row.start(a)
a<-table.element(a,'Lambda',header=TRUE)
a<-table.element(a,1-lnlm1$coefficients[[2]])
a<-table.row.end(a)
a<-table.end(a)
table.save(a,file='mytable2.tab')