Free Statistics

of Irreproducible Research!

Author's title

Author*Unverified author*
R Software Modulerwasp_smp.wasp
Title produced by softwareStandard Deviation-Mean Plot
Date of computationMon, 12 May 2008 15:51:09 -0600
Cite this page as followsStatistical Computations at FreeStatistics.org, Office for Research Development and Education, URL https://freestatistics.org/blog/index.php?v=date/2008/May/12/t1210629094mib7kqv1rb79koq.htm/, Retrieved Tue, 14 May 2024 10:32:04 +0000
Statistical Computations at FreeStatistics.org, Office for Research Development and Education, URL https://freestatistics.org/blog/index.php?pk=12454, Retrieved Tue, 14 May 2024 10:32:04 +0000
QR Codes:

Original text written by user:
IsPrivate?No (this computation is public)
User-defined keywords
Estimated Impact170
Family? (F = Feedback message, R = changed R code, M = changed R Module, P = changed Parameters, D = changed Data)
-     [Mean Plot] [Bouwvergunningen] [2008-04-28 20:31:41] [70836ebc47039e6a5440e0357610e663]
- RMPD    [Standard Deviation-Mean Plot] [Bouwvergunningen] [2008-05-12 21:51:09] [8e49e33bff217c9d761ee51a4d4e5949] [Current]
-   PD      [Standard Deviation-Mean Plot] [Bouwvergunningen] [2008-05-28 10:17:42] [74be16979710d4c4e7c6647856088456]
Feedback Forum

Post a new message
Dataseries X:
2434
2637
1831
1851
1839
2609
2417
2394
2372
2717
2998
2538
3007
2475
2175
2465
2279
2323
2746
2601
2486
2718
2646
2551
2712
2606
2365
3533
3509
2912
3599
2719
2869
4085
2686
2545
3071
3388
2652
3190
2884
3295
3818
3226
3953
3810
2877
3515
3708
3450
3360
4098
4374
3703
4257
3487
3659
3904
2957
3320
3420
3500
2791
2919
3179
3016
3492
3034
2612
3525
2846
3212
2591


Summary of computational transaction
Raw Inputview raw input (R code)
Raw Outputview raw output of R engine
Computing time1 seconds
R Server'Gwilym Jenkins' @ 72.249.127.135

\begin{tabular}{lllllllll}
\hline
Summary of computational transaction \tabularnewline
Raw Input & view raw input (R code)  \tabularnewline
Raw Output & view raw output of R engine  \tabularnewline
Computing time & 1 seconds \tabularnewline
R Server & 'Gwilym Jenkins' @ 72.249.127.135 \tabularnewline
\hline
\end{tabular}
%Source: https://freestatistics.org/blog/index.php?pk=12454&T=0

[TABLE]
[ROW][C]Summary of computational transaction[/C][/ROW]
[ROW][C]Raw Input[/C][C]view raw input (R code) [/C][/ROW]
[ROW][C]Raw Output[/C][C]view raw output of R engine [/C][/ROW]
[ROW][C]Computing time[/C][C]1 seconds[/C][/ROW]
[ROW][C]R Server[/C][C]'Gwilym Jenkins' @ 72.249.127.135[/C][/ROW]
[/TABLE]
Source: https://freestatistics.org/blog/index.php?pk=12454&T=0

Globally Unique Identifier (entire table): ba.freestatistics.org/blog/index.php?pk=12454&T=0

As an alternative you can also use a QR Code:  

The GUIDs for individual cells are displayed in the table below:

Summary of computational transaction
Raw Inputview raw input (R code)
Raw Outputview raw output of R engine
Computing time1 seconds
R Server'Gwilym Jenkins' @ 72.249.127.135


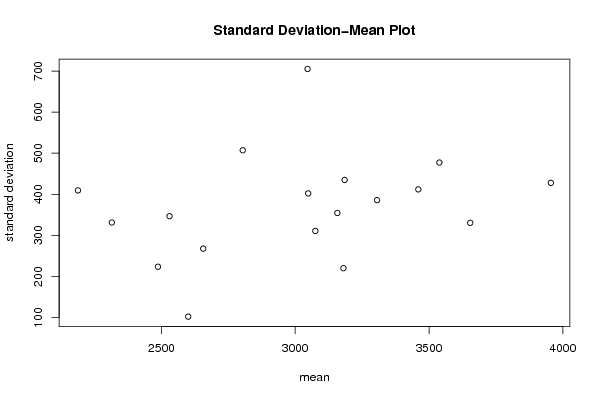
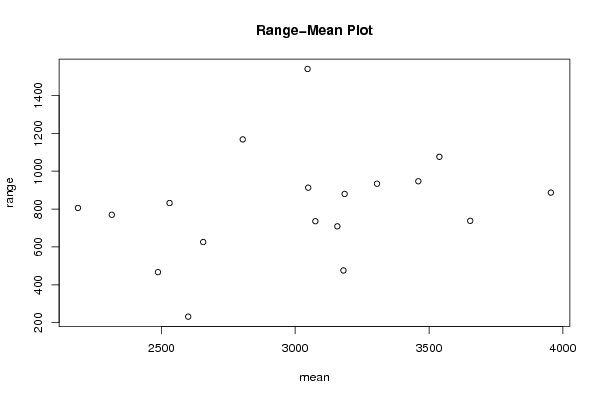
Standard Deviation-Mean Plot
SectionMeanStandard DeviationRange
12188.25409.526047197652806
22314.75331.48994454332770
32656.25267.871082176981626
42530.5346.796289868659832
52487.25223.783191206727467
62600.25102.366579832808232
72804507.2244736471881168
83184.75435.146239786121880
93046.25705.0888241916761540
103075.25310.987004015709736
113305.75385.896683064263934
123538.75477.3736307477961076
133654330.708330708496738
143955.25427.899034041131887
153460412.046113924158947
163157.5354.690945284295709
173180.25220.270099347748476
183048.75402.211697990001913

\begin{tabular}{lllllllll}
\hline
Standard Deviation-Mean Plot \tabularnewline
Section & Mean & Standard Deviation & Range \tabularnewline
1 & 2188.25 & 409.526047197652 & 806 \tabularnewline
2 & 2314.75 & 331.48994454332 & 770 \tabularnewline
3 & 2656.25 & 267.871082176981 & 626 \tabularnewline
4 & 2530.5 & 346.796289868659 & 832 \tabularnewline
5 & 2487.25 & 223.783191206727 & 467 \tabularnewline
6 & 2600.25 & 102.366579832808 & 232 \tabularnewline
7 & 2804 & 507.224473647188 & 1168 \tabularnewline
8 & 3184.75 & 435.146239786121 & 880 \tabularnewline
9 & 3046.25 & 705.088824191676 & 1540 \tabularnewline
10 & 3075.25 & 310.987004015709 & 736 \tabularnewline
11 & 3305.75 & 385.896683064263 & 934 \tabularnewline
12 & 3538.75 & 477.373630747796 & 1076 \tabularnewline
13 & 3654 & 330.708330708496 & 738 \tabularnewline
14 & 3955.25 & 427.899034041131 & 887 \tabularnewline
15 & 3460 & 412.046113924158 & 947 \tabularnewline
16 & 3157.5 & 354.690945284295 & 709 \tabularnewline
17 & 3180.25 & 220.270099347748 & 476 \tabularnewline
18 & 3048.75 & 402.211697990001 & 913 \tabularnewline
\hline
\end{tabular}
%Source: https://freestatistics.org/blog/index.php?pk=12454&T=1

[TABLE]
[ROW][C]Standard Deviation-Mean Plot[/C][/ROW]
[ROW][C]Section[/C][C]Mean[/C][C]Standard Deviation[/C][C]Range[/C][/ROW]
[ROW][C]1[/C][C]2188.25[/C][C]409.526047197652[/C][C]806[/C][/ROW]
[ROW][C]2[/C][C]2314.75[/C][C]331.48994454332[/C][C]770[/C][/ROW]
[ROW][C]3[/C][C]2656.25[/C][C]267.871082176981[/C][C]626[/C][/ROW]
[ROW][C]4[/C][C]2530.5[/C][C]346.796289868659[/C][C]832[/C][/ROW]
[ROW][C]5[/C][C]2487.25[/C][C]223.783191206727[/C][C]467[/C][/ROW]
[ROW][C]6[/C][C]2600.25[/C][C]102.366579832808[/C][C]232[/C][/ROW]
[ROW][C]7[/C][C]2804[/C][C]507.224473647188[/C][C]1168[/C][/ROW]
[ROW][C]8[/C][C]3184.75[/C][C]435.146239786121[/C][C]880[/C][/ROW]
[ROW][C]9[/C][C]3046.25[/C][C]705.088824191676[/C][C]1540[/C][/ROW]
[ROW][C]10[/C][C]3075.25[/C][C]310.987004015709[/C][C]736[/C][/ROW]
[ROW][C]11[/C][C]3305.75[/C][C]385.896683064263[/C][C]934[/C][/ROW]
[ROW][C]12[/C][C]3538.75[/C][C]477.373630747796[/C][C]1076[/C][/ROW]
[ROW][C]13[/C][C]3654[/C][C]330.708330708496[/C][C]738[/C][/ROW]
[ROW][C]14[/C][C]3955.25[/C][C]427.899034041131[/C][C]887[/C][/ROW]
[ROW][C]15[/C][C]3460[/C][C]412.046113924158[/C][C]947[/C][/ROW]
[ROW][C]16[/C][C]3157.5[/C][C]354.690945284295[/C][C]709[/C][/ROW]
[ROW][C]17[/C][C]3180.25[/C][C]220.270099347748[/C][C]476[/C][/ROW]
[ROW][C]18[/C][C]3048.75[/C][C]402.211697990001[/C][C]913[/C][/ROW]
[/TABLE]
Source: https://freestatistics.org/blog/index.php?pk=12454&T=1

Globally Unique Identifier (entire table): ba.freestatistics.org/blog/index.php?pk=12454&T=1

As an alternative you can also use a QR Code:  

The GUIDs for individual cells are displayed in the table below:

Standard Deviation-Mean Plot
SectionMeanStandard DeviationRange
12188.25409.526047197652806
22314.75331.48994454332770
32656.25267.871082176981626
42530.5346.796289868659832
52487.25223.783191206727467
62600.25102.366579832808232
72804507.2244736471881168
83184.75435.146239786121880
93046.25705.0888241916761540
103075.25310.987004015709736
113305.75385.896683064263934
123538.75477.3736307477961076
133654330.708330708496738
143955.25427.899034041131887
153460412.046113924158947
163157.5354.690945284295709
173180.25220.270099347748476
183048.75402.211697990001913


Regression: S.E.(k) = alpha + beta * Mean(k)
alpha139.846517073956
beta0.0762928688540033
S.D.0.0646348201370848
T-STAT1.18036793004441
p-value0.255105261185320

\begin{tabular}{lllllllll}
\hline
Regression: S.E.(k) = alpha + beta * Mean(k) \tabularnewline
alpha & 139.846517073956 \tabularnewline
beta & 0.0762928688540033 \tabularnewline
S.D. & 0.0646348201370848 \tabularnewline
T-STAT & 1.18036793004441 \tabularnewline
p-value & 0.255105261185320 \tabularnewline
\hline
\end{tabular}
%Source: https://freestatistics.org/blog/index.php?pk=12454&T=2

[TABLE]
[ROW][C]Regression: S.E.(k) = alpha + beta * Mean(k)[/C][/ROW]
[ROW][C]alpha[/C][C]139.846517073956[/C][/ROW]
[ROW][C]beta[/C][C]0.0762928688540033[/C][/ROW]
[ROW][C]S.D.[/C][C]0.0646348201370848[/C][/ROW]
[ROW][C]T-STAT[/C][C]1.18036793004441[/C][/ROW]
[ROW][C]p-value[/C][C]0.255105261185320[/C][/ROW]
[/TABLE]
Source: https://freestatistics.org/blog/index.php?pk=12454&T=2

Globally Unique Identifier (entire table): ba.freestatistics.org/blog/index.php?pk=12454&T=2

As an alternative you can also use a QR Code:  

The GUIDs for individual cells are displayed in the table below:

Regression: S.E.(k) = alpha + beta * Mean(k)
alpha139.846517073956
beta0.0762928688540033
S.D.0.0646348201370848
T-STAT1.18036793004441
p-value0.255105261185320


Regression: ln S.E.(k) = alpha + beta * ln Mean(k)
alpha-0.448900495506571
beta0.7866978545393
S.D.0.60237534972509
T-STAT1.30599277493399
p-value0.210020292313246
Lambda0.2133021454607

\begin{tabular}{lllllllll}
\hline
Regression: ln S.E.(k) = alpha + beta * ln Mean(k) \tabularnewline
alpha & -0.448900495506571 \tabularnewline
beta & 0.7866978545393 \tabularnewline
S.D. & 0.60237534972509 \tabularnewline
T-STAT & 1.30599277493399 \tabularnewline
p-value & 0.210020292313246 \tabularnewline
Lambda & 0.2133021454607 \tabularnewline
\hline
\end{tabular}
%Source: https://freestatistics.org/blog/index.php?pk=12454&T=3

[TABLE]
[ROW][C]Regression: ln S.E.(k) = alpha + beta * ln Mean(k)[/C][/ROW]
[ROW][C]alpha[/C][C]-0.448900495506571[/C][/ROW]
[ROW][C]beta[/C][C]0.7866978545393[/C][/ROW]
[ROW][C]S.D.[/C][C]0.60237534972509[/C][/ROW]
[ROW][C]T-STAT[/C][C]1.30599277493399[/C][/ROW]
[ROW][C]p-value[/C][C]0.210020292313246[/C][/ROW]
[ROW][C]Lambda[/C][C]0.2133021454607[/C][/ROW]
[/TABLE]
Source: https://freestatistics.org/blog/index.php?pk=12454&T=3

Globally Unique Identifier (entire table): ba.freestatistics.org/blog/index.php?pk=12454&T=3

As an alternative you can also use a QR Code:  

The GUIDs for individual cells are displayed in the table below:

Regression: ln S.E.(k) = alpha + beta * ln Mean(k)
alpha-0.448900495506571
beta0.7866978545393
S.D.0.60237534972509
T-STAT1.30599277493399
p-value0.210020292313246
Lambda0.2133021454607


Parameters (Session):
par1 = 4 ;
Parameters (R input):
par1 = 4 ;
R code (references can be found in the software module):
par1 <- as.numeric(par1)
(n <- length(x))
(np <- floor(n / par1))
arr <- array(NA,dim=c(par1,np))
j <- 0
k <- 1
for (i in 1:(np*par1))
{
j = j + 1
arr[j,k] <- x[i]
if (j == par1) {
j = 0
k=k+1
}
}
arr
arr.mean <- array(NA,dim=np)
arr.sd <- array(NA,dim=np)
arr.range <- array(NA,dim=np)
for (j in 1:np)
{
arr.mean[j] <- mean(arr[,j],na.rm=TRUE)
arr.sd[j] <- sd(arr[,j],na.rm=TRUE)
arr.range[j] <- max(arr[,j],na.rm=TRUE) - min(arr[,j],na.rm=TRUE)
}
arr.mean
arr.sd
arr.range
(lm1 <- lm(arr.sd~arr.mean))
(lnlm1 <- lm(log(arr.sd)~log(arr.mean)))
(lm2 <- lm(arr.range~arr.mean))
bitmap(file='test1.png')
plot(arr.mean,arr.sd,main='Standard Deviation-Mean Plot',xlab='mean',ylab='standard deviation')
dev.off()
bitmap(file='test2.png')
plot(arr.mean,arr.range,main='Range-Mean Plot',xlab='mean',ylab='range')
dev.off()
load(file='createtable')
a<-table.start()
a<-table.row.start(a)
a<-table.element(a,'Standard Deviation-Mean Plot',4,TRUE)
a<-table.row.end(a)
a<-table.row.start(a)
a<-table.element(a,'Section',header=TRUE)
a<-table.element(a,'Mean',header=TRUE)
a<-table.element(a,'Standard Deviation',header=TRUE)
a<-table.element(a,'Range',header=TRUE)
a<-table.row.end(a)
for (j in 1:np) {
a<-table.row.start(a)
a<-table.element(a,j,header=TRUE)
a<-table.element(a,arr.mean[j])
a<-table.element(a,arr.sd[j] )
a<-table.element(a,arr.range[j] )
a<-table.row.end(a)
}
a<-table.end(a)
table.save(a,file='mytable.tab')
a<-table.start()
a<-table.row.start(a)
a<-table.element(a,'Regression: S.E.(k) = alpha + beta * Mean(k)',2,TRUE)
a<-table.row.end(a)
a<-table.row.start(a)
a<-table.element(a,'alpha',header=TRUE)
a<-table.element(a,lm1$coefficients[[1]])
a<-table.row.end(a)
a<-table.row.start(a)
a<-table.element(a,'beta',header=TRUE)
a<-table.element(a,lm1$coefficients[[2]])
a<-table.row.end(a)
a<-table.row.start(a)
a<-table.element(a,'S.D.',header=TRUE)
a<-table.element(a,summary(lm1)$coefficients[2,2])
a<-table.row.end(a)
a<-table.row.start(a)
a<-table.element(a,'T-STAT',header=TRUE)
a<-table.element(a,summary(lm1)$coefficients[2,3])
a<-table.row.end(a)
a<-table.row.start(a)
a<-table.element(a,'p-value',header=TRUE)
a<-table.element(a,summary(lm1)$coefficients[2,4])
a<-table.row.end(a)
a<-table.end(a)
table.save(a,file='mytable1.tab')
a<-table.start()
a<-table.row.start(a)
a<-table.element(a,'Regression: ln S.E.(k) = alpha + beta * ln Mean(k)',2,TRUE)
a<-table.row.end(a)
a<-table.row.start(a)
a<-table.element(a,'alpha',header=TRUE)
a<-table.element(a,lnlm1$coefficients[[1]])
a<-table.row.end(a)
a<-table.row.start(a)
a<-table.element(a,'beta',header=TRUE)
a<-table.element(a,lnlm1$coefficients[[2]])
a<-table.row.end(a)
a<-table.row.start(a)
a<-table.element(a,'S.D.',header=TRUE)
a<-table.element(a,summary(lnlm1)$coefficients[2,2])
a<-table.row.end(a)
a<-table.row.start(a)
a<-table.element(a,'T-STAT',header=TRUE)
a<-table.element(a,summary(lnlm1)$coefficients[2,3])
a<-table.row.end(a)
a<-table.row.start(a)
a<-table.element(a,'p-value',header=TRUE)
a<-table.element(a,summary(lnlm1)$coefficients[2,4])
a<-table.row.end(a)
a<-table.row.start(a)
a<-table.element(a,'Lambda',header=TRUE)
a<-table.element(a,1-lnlm1$coefficients[[2]])
a<-table.row.end(a)
a<-table.end(a)
table.save(a,file='mytable2.tab')