Free Statistics

of Irreproducible Research!

Author's title

Author*Unverified author*
R Software Modulerwasp_smp.wasp
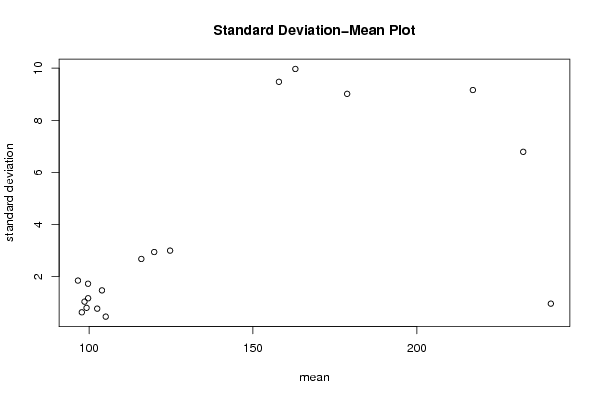
Title produced by softwareStandard Deviation-Mean Plot
Date of computationSat, 17 May 2008 06:03:37 -0600
Cite this page as followsStatistical Computations at FreeStatistics.org, Office for Research Development and Education, URL https://freestatistics.org/blog/index.php?v=date/2008/May/17/t1211025859ybtzf9hl683tee8.htm/, Retrieved Tue, 14 May 2024 19:12:45 +0000
Statistical Computations at FreeStatistics.org, Office for Research Development and Education, URL https://freestatistics.org/blog/index.php?pk=12641, Retrieved Tue, 14 May 2024 19:12:45 +0000
QR Codes:

Original text written by user:
IsPrivate?No (this computation is public)
User-defined keywords
Estimated Impact216
Family? (F = Feedback message, R = changed R code, M = changed R Module, P = changed Parameters, D = changed Data)
-     [Variability] [spreidingsmaten -...] [2008-05-13 12:38:50] [ae8cb49fb5e8aeb2fdfa69938caf5918]
- RMPD    [Standard Deviation-Mean Plot] [standaarddeviatie...] [2008-05-17 12:03:37] [d41d8cd98f00b204e9800998ecf8427e] [Current]
Feedback Forum

Post a new message
Dataseries X:
229.7
231.5
226.4
242.1
228.3
209.9
209.3
220.8
239.6
241.1
241.9
240.8
179.9
190.8
174.2
170
170.3
159.3
147.9
154.2
164.5
173.9
163.6
149.7
128.2
124.7
125.1
120.9
117.5
114
113.4
118.9
121.7
121.9
120.3
115.6
105.7
105.1
104.6
105
104.9
105.1
103.9
101.9
99
97
95.8
94.7
97.6
97.9
99.3
99.7
99.7
100
99.1
98.2
98.1
98.6
100.2
101.9
97.5
97.1
98.1
98.5
98.3
99.3
100.9
100.4
101.7
102
103.2
103.1


Summary of computational transaction
Raw Inputview raw input (R code)
Raw Outputview raw output of R engine
Computing time2 seconds
R Server'Herman Ole Andreas Wold' @ 193.190.124.10:1001

\begin{tabular}{lllllllll}
\hline
Summary of computational transaction \tabularnewline
Raw Input & view raw input (R code)  \tabularnewline
Raw Output & view raw output of R engine  \tabularnewline
Computing time & 2 seconds \tabularnewline
R Server & 'Herman Ole Andreas Wold' @ 193.190.124.10:1001 \tabularnewline
\hline
\end{tabular}
%Source: https://freestatistics.org/blog/index.php?pk=12641&T=0

[TABLE]
[ROW][C]Summary of computational transaction[/C][/ROW]
[ROW][C]Raw Input[/C][C]view raw input (R code) [/C][/ROW]
[ROW][C]Raw Output[/C][C]view raw output of R engine [/C][/ROW]
[ROW][C]Computing time[/C][C]2 seconds[/C][/ROW]
[ROW][C]R Server[/C][C]'Herman Ole Andreas Wold' @ 193.190.124.10:1001[/C][/ROW]
[/TABLE]
Source: https://freestatistics.org/blog/index.php?pk=12641&T=0

Globally Unique Identifier (entire table): ba.freestatistics.org/blog/index.php?pk=12641&T=0

As an alternative you can also use a QR Code:  

The GUIDs for individual cells are displayed in the table below:

Summary of computational transaction
Raw Inputview raw input (R code)
Raw Outputview raw output of R engine
Computing time2 seconds
R Server'Herman Ole Andreas Wold' @ 193.190.124.10:1001


Standard Deviation-Mean Plot
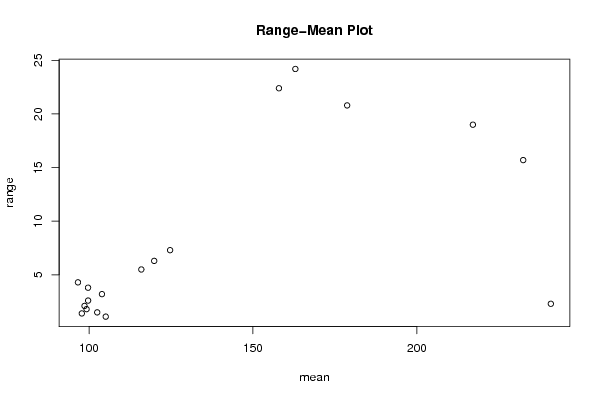
SectionMeanStandard DeviationRange
1232.4256.7869359802491115.7
2217.0759.1616501424870719
3240.850.953939201416952.30000000000001
4178.7259.0145715372390320.8
5157.9259.4764180996830322.4
6162.9259.9714174853260924.2
7124.7252.991515780781817.29999999999998
8115.952.671454036038555.5
9119.8752.937544325906716.30000000000001
10105.10.4546060565661991.10000000000001
11103.951.464012750399853.19999999999999
1296.6251.840968947773614.3
1398.6251.030776406404422.10000000000001
1499.250.7937253933193771.80000000000000
1599.71.718526500620043.80000000000001
1697.80.6218252702059221.40000000000001
1799.7251.161536338935072.60000000000001
18102.50.7615773105863891.5

\begin{tabular}{lllllllll}
\hline
Standard Deviation-Mean Plot \tabularnewline
Section & Mean & Standard Deviation & Range \tabularnewline
1 & 232.425 & 6.78693598024911 & 15.7 \tabularnewline
2 & 217.075 & 9.16165014248707 & 19 \tabularnewline
3 & 240.85 & 0.95393920141695 & 2.30000000000001 \tabularnewline
4 & 178.725 & 9.01457153723903 & 20.8 \tabularnewline
5 & 157.925 & 9.47641809968303 & 22.4 \tabularnewline
6 & 162.925 & 9.97141748532609 & 24.2 \tabularnewline
7 & 124.725 & 2.99151578078181 & 7.29999999999998 \tabularnewline
8 & 115.95 & 2.67145403603855 & 5.5 \tabularnewline
9 & 119.875 & 2.93754432590671 & 6.30000000000001 \tabularnewline
10 & 105.1 & 0.454606056566199 & 1.10000000000001 \tabularnewline
11 & 103.95 & 1.46401275039985 & 3.19999999999999 \tabularnewline
12 & 96.625 & 1.84096894777361 & 4.3 \tabularnewline
13 & 98.625 & 1.03077640640442 & 2.10000000000001 \tabularnewline
14 & 99.25 & 0.793725393319377 & 1.80000000000000 \tabularnewline
15 & 99.7 & 1.71852650062004 & 3.80000000000001 \tabularnewline
16 & 97.8 & 0.621825270205922 & 1.40000000000001 \tabularnewline
17 & 99.725 & 1.16153633893507 & 2.60000000000001 \tabularnewline
18 & 102.5 & 0.761577310586389 & 1.5 \tabularnewline
\hline
\end{tabular}
%Source: https://freestatistics.org/blog/index.php?pk=12641&T=1

[TABLE]
[ROW][C]Standard Deviation-Mean Plot[/C][/ROW]
[ROW][C]Section[/C][C]Mean[/C][C]Standard Deviation[/C][C]Range[/C][/ROW]
[ROW][C]1[/C][C]232.425[/C][C]6.78693598024911[/C][C]15.7[/C][/ROW]
[ROW][C]2[/C][C]217.075[/C][C]9.16165014248707[/C][C]19[/C][/ROW]
[ROW][C]3[/C][C]240.85[/C][C]0.95393920141695[/C][C]2.30000000000001[/C][/ROW]
[ROW][C]4[/C][C]178.725[/C][C]9.01457153723903[/C][C]20.8[/C][/ROW]
[ROW][C]5[/C][C]157.925[/C][C]9.47641809968303[/C][C]22.4[/C][/ROW]
[ROW][C]6[/C][C]162.925[/C][C]9.97141748532609[/C][C]24.2[/C][/ROW]
[ROW][C]7[/C][C]124.725[/C][C]2.99151578078181[/C][C]7.29999999999998[/C][/ROW]
[ROW][C]8[/C][C]115.95[/C][C]2.67145403603855[/C][C]5.5[/C][/ROW]
[ROW][C]9[/C][C]119.875[/C][C]2.93754432590671[/C][C]6.30000000000001[/C][/ROW]
[ROW][C]10[/C][C]105.1[/C][C]0.454606056566199[/C][C]1.10000000000001[/C][/ROW]
[ROW][C]11[/C][C]103.95[/C][C]1.46401275039985[/C][C]3.19999999999999[/C][/ROW]
[ROW][C]12[/C][C]96.625[/C][C]1.84096894777361[/C][C]4.3[/C][/ROW]
[ROW][C]13[/C][C]98.625[/C][C]1.03077640640442[/C][C]2.10000000000001[/C][/ROW]
[ROW][C]14[/C][C]99.25[/C][C]0.793725393319377[/C][C]1.80000000000000[/C][/ROW]
[ROW][C]15[/C][C]99.7[/C][C]1.71852650062004[/C][C]3.80000000000001[/C][/ROW]
[ROW][C]16[/C][C]97.8[/C][C]0.621825270205922[/C][C]1.40000000000001[/C][/ROW]
[ROW][C]17[/C][C]99.725[/C][C]1.16153633893507[/C][C]2.60000000000001[/C][/ROW]
[ROW][C]18[/C][C]102.5[/C][C]0.761577310586389[/C][C]1.5[/C][/ROW]
[/TABLE]
Source: https://freestatistics.org/blog/index.php?pk=12641&T=1

Globally Unique Identifier (entire table): ba.freestatistics.org/blog/index.php?pk=12641&T=1

As an alternative you can also use a QR Code:  

The GUIDs for individual cells are displayed in the table below:

Standard Deviation-Mean Plot
SectionMeanStandard DeviationRange
1232.4256.7869359802491115.7
2217.0759.1616501424870719
3240.850.953939201416952.30000000000001
4178.7259.0145715372390320.8
5157.9259.4764180996830322.4
6162.9259.9714174853260924.2
7124.7252.991515780781817.29999999999998
8115.952.671454036038555.5
9119.8752.937544325906716.30000000000001
10105.10.4546060565661991.10000000000001
11103.951.464012750399853.19999999999999
1296.6251.840968947773614.3
1398.6251.030776406404422.10000000000001
1499.250.7937253933193771.80000000000000
1599.71.718526500620043.80000000000001
1697.80.6218252702059221.40000000000001
1799.7251.161536338935072.60000000000001
18102.50.7615773105863891.5


Regression: S.E.(k) = alpha + beta * Mean(k)
alpha-2.42970955494258
beta0.0438299637505474
S.D.0.0139626333167272
T-STAT3.13909008109803
p-value0.00633863276782342

\begin{tabular}{lllllllll}
\hline
Regression: S.E.(k) = alpha + beta * Mean(k) \tabularnewline
alpha & -2.42970955494258 \tabularnewline
beta & 0.0438299637505474 \tabularnewline
S.D. & 0.0139626333167272 \tabularnewline
T-STAT & 3.13909008109803 \tabularnewline
p-value & 0.00633863276782342 \tabularnewline
\hline
\end{tabular}
%Source: https://freestatistics.org/blog/index.php?pk=12641&T=2

[TABLE]
[ROW][C]Regression: S.E.(k) = alpha + beta * Mean(k)[/C][/ROW]
[ROW][C]alpha[/C][C]-2.42970955494258[/C][/ROW]
[ROW][C]beta[/C][C]0.0438299637505474[/C][/ROW]
[ROW][C]S.D.[/C][C]0.0139626333167272[/C][/ROW]
[ROW][C]T-STAT[/C][C]3.13909008109803[/C][/ROW]
[ROW][C]p-value[/C][C]0.00633863276782342[/C][/ROW]
[/TABLE]
Source: https://freestatistics.org/blog/index.php?pk=12641&T=2

Globally Unique Identifier (entire table): ba.freestatistics.org/blog/index.php?pk=12641&T=2

As an alternative you can also use a QR Code:  

The GUIDs for individual cells are displayed in the table below:

Regression: S.E.(k) = alpha + beta * Mean(k)
alpha-2.42970955494258
beta0.0438299637505474
S.D.0.0139626333167272
T-STAT3.13909008109803
p-value0.00633863276782342


Regression: ln S.E.(k) = alpha + beta * ln Mean(k)
alpha-9.19378764964323
beta2.05061574475111
S.D.0.60437166709894
T-STAT3.39297133929908
p-value0.00371485315335150
Lambda-1.05061574475111

\begin{tabular}{lllllllll}
\hline
Regression: ln S.E.(k) = alpha + beta * ln Mean(k) \tabularnewline
alpha & -9.19378764964323 \tabularnewline
beta & 2.05061574475111 \tabularnewline
S.D. & 0.60437166709894 \tabularnewline
T-STAT & 3.39297133929908 \tabularnewline
p-value & 0.00371485315335150 \tabularnewline
Lambda & -1.05061574475111 \tabularnewline
\hline
\end{tabular}
%Source: https://freestatistics.org/blog/index.php?pk=12641&T=3

[TABLE]
[ROW][C]Regression: ln S.E.(k) = alpha + beta * ln Mean(k)[/C][/ROW]
[ROW][C]alpha[/C][C]-9.19378764964323[/C][/ROW]
[ROW][C]beta[/C][C]2.05061574475111[/C][/ROW]
[ROW][C]S.D.[/C][C]0.60437166709894[/C][/ROW]
[ROW][C]T-STAT[/C][C]3.39297133929908[/C][/ROW]
[ROW][C]p-value[/C][C]0.00371485315335150[/C][/ROW]
[ROW][C]Lambda[/C][C]-1.05061574475111[/C][/ROW]
[/TABLE]
Source: https://freestatistics.org/blog/index.php?pk=12641&T=3

Globally Unique Identifier (entire table): ba.freestatistics.org/blog/index.php?pk=12641&T=3

As an alternative you can also use a QR Code:  

The GUIDs for individual cells are displayed in the table below:

Regression: ln S.E.(k) = alpha + beta * ln Mean(k)
alpha-9.19378764964323
beta2.05061574475111
S.D.0.60437166709894
T-STAT3.39297133929908
p-value0.00371485315335150
Lambda-1.05061574475111


Parameters (Session):
par1 = 4 ;
Parameters (R input):
par1 = 4 ;
R code (references can be found in the software module):
par1 <- as.numeric(par1)
(n <- length(x))
(np <- floor(n / par1))
arr <- array(NA,dim=c(par1,np))
j <- 0
k <- 1
for (i in 1:(np*par1))
{
j = j + 1
arr[j,k] <- x[i]
if (j == par1) {
j = 0
k=k+1
}
}
arr
arr.mean <- array(NA,dim=np)
arr.sd <- array(NA,dim=np)
arr.range <- array(NA,dim=np)
for (j in 1:np)
{
arr.mean[j] <- mean(arr[,j],na.rm=TRUE)
arr.sd[j] <- sd(arr[,j],na.rm=TRUE)
arr.range[j] <- max(arr[,j],na.rm=TRUE) - min(arr[,j],na.rm=TRUE)
}
arr.mean
arr.sd
arr.range
(lm1 <- lm(arr.sd~arr.mean))
(lnlm1 <- lm(log(arr.sd)~log(arr.mean)))
(lm2 <- lm(arr.range~arr.mean))
bitmap(file='test1.png')
plot(arr.mean,arr.sd,main='Standard Deviation-Mean Plot',xlab='mean',ylab='standard deviation')
dev.off()
bitmap(file='test2.png')
plot(arr.mean,arr.range,main='Range-Mean Plot',xlab='mean',ylab='range')
dev.off()
load(file='createtable')
a<-table.start()
a<-table.row.start(a)
a<-table.element(a,'Standard Deviation-Mean Plot',4,TRUE)
a<-table.row.end(a)
a<-table.row.start(a)
a<-table.element(a,'Section',header=TRUE)
a<-table.element(a,'Mean',header=TRUE)
a<-table.element(a,'Standard Deviation',header=TRUE)
a<-table.element(a,'Range',header=TRUE)
a<-table.row.end(a)
for (j in 1:np) {
a<-table.row.start(a)
a<-table.element(a,j,header=TRUE)
a<-table.element(a,arr.mean[j])
a<-table.element(a,arr.sd[j] )
a<-table.element(a,arr.range[j] )
a<-table.row.end(a)
}
a<-table.end(a)
table.save(a,file='mytable.tab')
a<-table.start()
a<-table.row.start(a)
a<-table.element(a,'Regression: S.E.(k) = alpha + beta * Mean(k)',2,TRUE)
a<-table.row.end(a)
a<-table.row.start(a)
a<-table.element(a,'alpha',header=TRUE)
a<-table.element(a,lm1$coefficients[[1]])
a<-table.row.end(a)
a<-table.row.start(a)
a<-table.element(a,'beta',header=TRUE)
a<-table.element(a,lm1$coefficients[[2]])
a<-table.row.end(a)
a<-table.row.start(a)
a<-table.element(a,'S.D.',header=TRUE)
a<-table.element(a,summary(lm1)$coefficients[2,2])
a<-table.row.end(a)
a<-table.row.start(a)
a<-table.element(a,'T-STAT',header=TRUE)
a<-table.element(a,summary(lm1)$coefficients[2,3])
a<-table.row.end(a)
a<-table.row.start(a)
a<-table.element(a,'p-value',header=TRUE)
a<-table.element(a,summary(lm1)$coefficients[2,4])
a<-table.row.end(a)
a<-table.end(a)
table.save(a,file='mytable1.tab')
a<-table.start()
a<-table.row.start(a)
a<-table.element(a,'Regression: ln S.E.(k) = alpha + beta * ln Mean(k)',2,TRUE)
a<-table.row.end(a)
a<-table.row.start(a)
a<-table.element(a,'alpha',header=TRUE)
a<-table.element(a,lnlm1$coefficients[[1]])
a<-table.row.end(a)
a<-table.row.start(a)
a<-table.element(a,'beta',header=TRUE)
a<-table.element(a,lnlm1$coefficients[[2]])
a<-table.row.end(a)
a<-table.row.start(a)
a<-table.element(a,'S.D.',header=TRUE)
a<-table.element(a,summary(lnlm1)$coefficients[2,2])
a<-table.row.end(a)
a<-table.row.start(a)
a<-table.element(a,'T-STAT',header=TRUE)
a<-table.element(a,summary(lnlm1)$coefficients[2,3])
a<-table.row.end(a)
a<-table.row.start(a)
a<-table.element(a,'p-value',header=TRUE)
a<-table.element(a,summary(lnlm1)$coefficients[2,4])
a<-table.row.end(a)
a<-table.row.start(a)
a<-table.element(a,'Lambda',header=TRUE)
a<-table.element(a,1-lnlm1$coefficients[[2]])
a<-table.row.end(a)
a<-table.end(a)
table.save(a,file='mytable2.tab')