Free Statistics

of Irreproducible Research!

Author's title

Author*Unverified author*
R Software Modulerwasp_smp.wasp
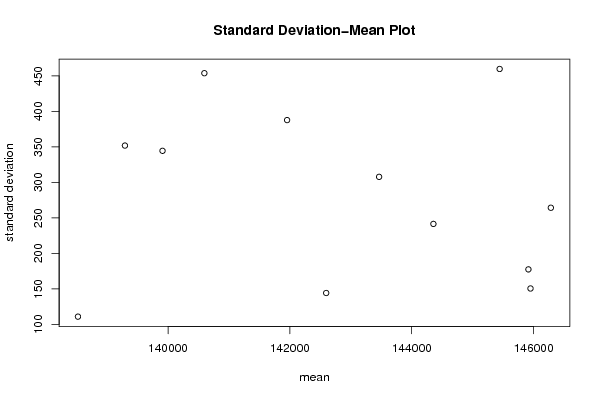
Title produced by softwareStandard Deviation-Mean Plot
Date of computationSat, 17 May 2008 07:28:19 -0600
Cite this page as followsStatistical Computations at FreeStatistics.org, Office for Research Development and Education, URL https://freestatistics.org/blog/index.php?v=date/2008/May/17/t1211030921yu43uvfku9yluer.htm/, Retrieved Tue, 14 May 2024 00:19:30 +0000
Statistical Computations at FreeStatistics.org, Office for Research Development and Education, URL https://freestatistics.org/blog/index.php?pk=12658, Retrieved Tue, 14 May 2024 00:19:30 +0000
QR Codes:

Original text written by user:
IsPrivate?No (this computation is public)
User-defined keywords
Estimated Impact217
Family? (F = Feedback message, R = changed R code, M = changed R Module, P = changed Parameters, D = changed Data)
-       [Standard Deviation-Mean Plot] [] [2008-05-17 13:28:19] [15ccabfe3b960eee2f000db554701399] [Current]
Feedback Forum

Post a new message
Dataseries X:
138463
138529
138421
138674
138848
139174
139565
139585
139500
139756
140245
140138
140224
140354
140563
141244
141597
141708
142055
142457
142429
142613
142564
142778
143086
143362
143619
143791
144088
144369
144295
144671
144846
145395
145583
145949
145915
145888
146145
145713
145913
146087
146045
145753
146260
146016
146647
146211
146248


Summary of computational transaction
Raw Inputview raw input (R code)
Raw Outputview raw output of R engine
Computing time2 seconds
R Server'Gwilym Jenkins' @ 72.249.127.135

\begin{tabular}{lllllllll}
\hline
Summary of computational transaction \tabularnewline
Raw Input & view raw input (R code)  \tabularnewline
Raw Output & view raw output of R engine  \tabularnewline
Computing time & 2 seconds \tabularnewline
R Server & 'Gwilym Jenkins' @ 72.249.127.135 \tabularnewline
\hline
\end{tabular}
%Source: https://freestatistics.org/blog/index.php?pk=12658&T=0

[TABLE]
[ROW][C]Summary of computational transaction[/C][/ROW]
[ROW][C]Raw Input[/C][C]view raw input (R code) [/C][/ROW]
[ROW][C]Raw Output[/C][C]view raw output of R engine [/C][/ROW]
[ROW][C]Computing time[/C][C]2 seconds[/C][/ROW]
[ROW][C]R Server[/C][C]'Gwilym Jenkins' @ 72.249.127.135[/C][/ROW]
[/TABLE]
Source: https://freestatistics.org/blog/index.php?pk=12658&T=0

Globally Unique Identifier (entire table): ba.freestatistics.org/blog/index.php?pk=12658&T=0

As an alternative you can also use a QR Code:  

The GUIDs for individual cells are displayed in the table below:

Summary of computational transaction
Raw Inputview raw input (R code)
Raw Outputview raw output of R engine
Computing time2 seconds
R Server'Gwilym Jenkins' @ 72.249.127.135


Standard Deviation-Mean Plot
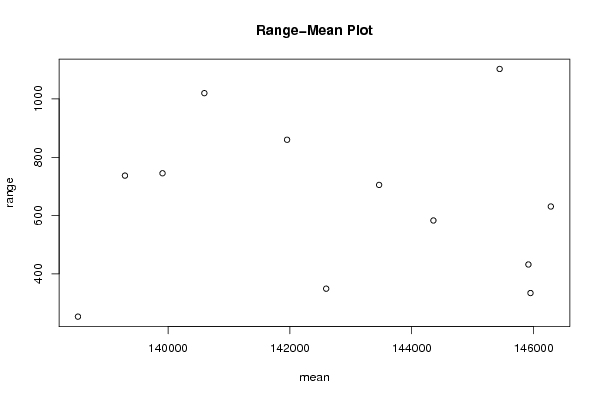
SectionMeanStandard DeviationRange
1138521.75110.807265104776253
2139293351.868346591923737
3139909.75344.492259226048745
4140596.25453.8504709703411020
5141954.25387.803537030457860
6142596144.136509369879349
7143464.5307.810006335077705
8144355.75241.480675555347583
9145443.25459.8364745573511103
10145915.25177.419230449614432
11145949.5150.522423578681334
12146283.5264.258080923429631

\begin{tabular}{lllllllll}
\hline
Standard Deviation-Mean Plot \tabularnewline
Section & Mean & Standard Deviation & Range \tabularnewline
1 & 138521.75 & 110.807265104776 & 253 \tabularnewline
2 & 139293 & 351.868346591923 & 737 \tabularnewline
3 & 139909.75 & 344.492259226048 & 745 \tabularnewline
4 & 140596.25 & 453.850470970341 & 1020 \tabularnewline
5 & 141954.25 & 387.803537030457 & 860 \tabularnewline
6 & 142596 & 144.136509369879 & 349 \tabularnewline
7 & 143464.5 & 307.810006335077 & 705 \tabularnewline
8 & 144355.75 & 241.480675555347 & 583 \tabularnewline
9 & 145443.25 & 459.836474557351 & 1103 \tabularnewline
10 & 145915.25 & 177.419230449614 & 432 \tabularnewline
11 & 145949.5 & 150.522423578681 & 334 \tabularnewline
12 & 146283.5 & 264.258080923429 & 631 \tabularnewline
\hline
\end{tabular}
%Source: https://freestatistics.org/blog/index.php?pk=12658&T=1

[TABLE]
[ROW][C]Standard Deviation-Mean Plot[/C][/ROW]
[ROW][C]Section[/C][C]Mean[/C][C]Standard Deviation[/C][C]Range[/C][/ROW]
[ROW][C]1[/C][C]138521.75[/C][C]110.807265104776[/C][C]253[/C][/ROW]
[ROW][C]2[/C][C]139293[/C][C]351.868346591923[/C][C]737[/C][/ROW]
[ROW][C]3[/C][C]139909.75[/C][C]344.492259226048[/C][C]745[/C][/ROW]
[ROW][C]4[/C][C]140596.25[/C][C]453.850470970341[/C][C]1020[/C][/ROW]
[ROW][C]5[/C][C]141954.25[/C][C]387.803537030457[/C][C]860[/C][/ROW]
[ROW][C]6[/C][C]142596[/C][C]144.136509369879[/C][C]349[/C][/ROW]
[ROW][C]7[/C][C]143464.5[/C][C]307.810006335077[/C][C]705[/C][/ROW]
[ROW][C]8[/C][C]144355.75[/C][C]241.480675555347[/C][C]583[/C][/ROW]
[ROW][C]9[/C][C]145443.25[/C][C]459.836474557351[/C][C]1103[/C][/ROW]
[ROW][C]10[/C][C]145915.25[/C][C]177.419230449614[/C][C]432[/C][/ROW]
[ROW][C]11[/C][C]145949.5[/C][C]150.522423578681[/C][C]334[/C][/ROW]
[ROW][C]12[/C][C]146283.5[/C][C]264.258080923429[/C][C]631[/C][/ROW]
[/TABLE]
Source: https://freestatistics.org/blog/index.php?pk=12658&T=1

Globally Unique Identifier (entire table): ba.freestatistics.org/blog/index.php?pk=12658&T=1

As an alternative you can also use a QR Code:  

The GUIDs for individual cells are displayed in the table below:

Standard Deviation-Mean Plot
SectionMeanStandard DeviationRange
1138521.75110.807265104776253
2139293351.868346591923737
3139909.75344.492259226048745
4140596.25453.8504709703411020
5141954.25387.803537030457860
6142596144.136509369879349
7143464.5307.810006335077705
8144355.75241.480675555347583
9145443.25459.8364745573511103
10145915.25177.419230449614432
11145949.5150.522423578681334
12146283.5264.258080923429631


Regression: S.E.(k) = alpha + beta * Mean(k)
alpha1131.01081512398
beta-0.00593708622559191
S.D.0.0135114855640813
T-STAT-0.439410322235398
p-value0.66970766012659

\begin{tabular}{lllllllll}
\hline
Regression: S.E.(k) = alpha + beta * Mean(k) \tabularnewline
alpha & 1131.01081512398 \tabularnewline
beta & -0.00593708622559191 \tabularnewline
S.D. & 0.0135114855640813 \tabularnewline
T-STAT & -0.439410322235398 \tabularnewline
p-value & 0.66970766012659 \tabularnewline
\hline
\end{tabular}
%Source: https://freestatistics.org/blog/index.php?pk=12658&T=2

[TABLE]
[ROW][C]Regression: S.E.(k) = alpha + beta * Mean(k)[/C][/ROW]
[ROW][C]alpha[/C][C]1131.01081512398[/C][/ROW]
[ROW][C]beta[/C][C]-0.00593708622559191[/C][/ROW]
[ROW][C]S.D.[/C][C]0.0135114855640813[/C][/ROW]
[ROW][C]T-STAT[/C][C]-0.439410322235398[/C][/ROW]
[ROW][C]p-value[/C][C]0.66970766012659[/C][/ROW]
[/TABLE]
Source: https://freestatistics.org/blog/index.php?pk=12658&T=2

Globally Unique Identifier (entire table): ba.freestatistics.org/blog/index.php?pk=12658&T=2

As an alternative you can also use a QR Code:  

The GUIDs for individual cells are displayed in the table below:

Regression: S.E.(k) = alpha + beta * Mean(k)
alpha1131.01081512398
beta-0.00593708622559191
S.D.0.0135114855640813
T-STAT-0.439410322235398
p-value0.66970766012659


Regression: ln S.E.(k) = alpha + beta * ln Mean(k)
alpha24.6935803849586
beta-1.61299705524479
S.D.7.69202783425089
T-STAT-0.209697246292125
p-value0.838114482779634
Lambda2.61299705524479

\begin{tabular}{lllllllll}
\hline
Regression: ln S.E.(k) = alpha + beta * ln Mean(k) \tabularnewline
alpha & 24.6935803849586 \tabularnewline
beta & -1.61299705524479 \tabularnewline
S.D. & 7.69202783425089 \tabularnewline
T-STAT & -0.209697246292125 \tabularnewline
p-value & 0.838114482779634 \tabularnewline
Lambda & 2.61299705524479 \tabularnewline
\hline
\end{tabular}
%Source: https://freestatistics.org/blog/index.php?pk=12658&T=3

[TABLE]
[ROW][C]Regression: ln S.E.(k) = alpha + beta * ln Mean(k)[/C][/ROW]
[ROW][C]alpha[/C][C]24.6935803849586[/C][/ROW]
[ROW][C]beta[/C][C]-1.61299705524479[/C][/ROW]
[ROW][C]S.D.[/C][C]7.69202783425089[/C][/ROW]
[ROW][C]T-STAT[/C][C]-0.209697246292125[/C][/ROW]
[ROW][C]p-value[/C][C]0.838114482779634[/C][/ROW]
[ROW][C]Lambda[/C][C]2.61299705524479[/C][/ROW]
[/TABLE]
Source: https://freestatistics.org/blog/index.php?pk=12658&T=3

Globally Unique Identifier (entire table): ba.freestatistics.org/blog/index.php?pk=12658&T=3

As an alternative you can also use a QR Code:  

The GUIDs for individual cells are displayed in the table below:

Regression: ln S.E.(k) = alpha + beta * ln Mean(k)
alpha24.6935803849586
beta-1.61299705524479
S.D.7.69202783425089
T-STAT-0.209697246292125
p-value0.838114482779634
Lambda2.61299705524479


Parameters (Session):
par1 = 4 ;
Parameters (R input):
par1 = 4 ;
R code (references can be found in the software module):
par1 <- as.numeric(par1)
(n <- length(x))
(np <- floor(n / par1))
arr <- array(NA,dim=c(par1,np))
j <- 0
k <- 1
for (i in 1:(np*par1))
{
j = j + 1
arr[j,k] <- x[i]
if (j == par1) {
j = 0
k=k+1
}
}
arr
arr.mean <- array(NA,dim=np)
arr.sd <- array(NA,dim=np)
arr.range <- array(NA,dim=np)
for (j in 1:np)
{
arr.mean[j] <- mean(arr[,j],na.rm=TRUE)
arr.sd[j] <- sd(arr[,j],na.rm=TRUE)
arr.range[j] <- max(arr[,j],na.rm=TRUE) - min(arr[,j],na.rm=TRUE)
}
arr.mean
arr.sd
arr.range
(lm1 <- lm(arr.sd~arr.mean))
(lnlm1 <- lm(log(arr.sd)~log(arr.mean)))
(lm2 <- lm(arr.range~arr.mean))
bitmap(file='test1.png')
plot(arr.mean,arr.sd,main='Standard Deviation-Mean Plot',xlab='mean',ylab='standard deviation')
dev.off()
bitmap(file='test2.png')
plot(arr.mean,arr.range,main='Range-Mean Plot',xlab='mean',ylab='range')
dev.off()
load(file='createtable')
a<-table.start()
a<-table.row.start(a)
a<-table.element(a,'Standard Deviation-Mean Plot',4,TRUE)
a<-table.row.end(a)
a<-table.row.start(a)
a<-table.element(a,'Section',header=TRUE)
a<-table.element(a,'Mean',header=TRUE)
a<-table.element(a,'Standard Deviation',header=TRUE)
a<-table.element(a,'Range',header=TRUE)
a<-table.row.end(a)
for (j in 1:np) {
a<-table.row.start(a)
a<-table.element(a,j,header=TRUE)
a<-table.element(a,arr.mean[j])
a<-table.element(a,arr.sd[j] )
a<-table.element(a,arr.range[j] )
a<-table.row.end(a)
}
a<-table.end(a)
table.save(a,file='mytable.tab')
a<-table.start()
a<-table.row.start(a)
a<-table.element(a,'Regression: S.E.(k) = alpha + beta * Mean(k)',2,TRUE)
a<-table.row.end(a)
a<-table.row.start(a)
a<-table.element(a,'alpha',header=TRUE)
a<-table.element(a,lm1$coefficients[[1]])
a<-table.row.end(a)
a<-table.row.start(a)
a<-table.element(a,'beta',header=TRUE)
a<-table.element(a,lm1$coefficients[[2]])
a<-table.row.end(a)
a<-table.row.start(a)
a<-table.element(a,'S.D.',header=TRUE)
a<-table.element(a,summary(lm1)$coefficients[2,2])
a<-table.row.end(a)
a<-table.row.start(a)
a<-table.element(a,'T-STAT',header=TRUE)
a<-table.element(a,summary(lm1)$coefficients[2,3])
a<-table.row.end(a)
a<-table.row.start(a)
a<-table.element(a,'p-value',header=TRUE)
a<-table.element(a,summary(lm1)$coefficients[2,4])
a<-table.row.end(a)
a<-table.end(a)
table.save(a,file='mytable1.tab')
a<-table.start()
a<-table.row.start(a)
a<-table.element(a,'Regression: ln S.E.(k) = alpha + beta * ln Mean(k)',2,TRUE)
a<-table.row.end(a)
a<-table.row.start(a)
a<-table.element(a,'alpha',header=TRUE)
a<-table.element(a,lnlm1$coefficients[[1]])
a<-table.row.end(a)
a<-table.row.start(a)
a<-table.element(a,'beta',header=TRUE)
a<-table.element(a,lnlm1$coefficients[[2]])
a<-table.row.end(a)
a<-table.row.start(a)
a<-table.element(a,'S.D.',header=TRUE)
a<-table.element(a,summary(lnlm1)$coefficients[2,2])
a<-table.row.end(a)
a<-table.row.start(a)
a<-table.element(a,'T-STAT',header=TRUE)
a<-table.element(a,summary(lnlm1)$coefficients[2,3])
a<-table.row.end(a)
a<-table.row.start(a)
a<-table.element(a,'p-value',header=TRUE)
a<-table.element(a,summary(lnlm1)$coefficients[2,4])
a<-table.row.end(a)
a<-table.row.start(a)
a<-table.element(a,'Lambda',header=TRUE)
a<-table.element(a,1-lnlm1$coefficients[[2]])
a<-table.row.end(a)
a<-table.end(a)
table.save(a,file='mytable2.tab')