Free Statistics

of Irreproducible Research!

Author's title

Standard Deviation-Mean Plot - Olieprijzen in constante dollar - Bram Op de...

Author*Unverified author*
R Software Modulerwasp_smp.wasp
Title produced by softwareStandard Deviation-Mean Plot
Date of computationSun, 18 May 2008 04:40:48 -0600
Cite this page as followsStatistical Computations at FreeStatistics.org, Office for Research Development and Education, URL https://freestatistics.org/blog/index.php?v=date/2008/May/18/t1211107310y56zx4r5iy351ax.htm/, Retrieved Tue, 14 May 2024 00:30:16 +0000
Statistical Computations at FreeStatistics.org, Office for Research Development and Education, URL https://freestatistics.org/blog/index.php?pk=12716, Retrieved Tue, 14 May 2024 00:30:16 +0000
QR Codes:

Original text written by user:
IsPrivate?No (this computation is public)
User-defined keywords
Estimated Impact191
Family? (F = Feedback message, R = changed R code, M = changed R Module, P = changed Parameters, D = changed Data)
-       [Standard Deviation-Mean Plot] [Standard Deviatio...] [2008-05-18 10:40:48] [f1ad3272590ff3a9e1233970549442f0] [Current]
Feedback Forum

Post a new message
Dataseries X:
23.11
18.64
14.94
16.90
15.46
11.15
13.13
12.48
12.95
12.59
10.58
10.58
12.39
15.53
13.06
10.22
16.33
19.72
21.31
18.84
24.84
15.67
15.57
12.73
13.56
15.54
17.22
12.14
11.07
12.02
11.55
6.92
10.33
8.38
12.11
11.46
12.75
13.32
13.00
11.90
11.79
12.55
11.84
11.25
11.15
10.99
11.70
14.01
17.51
17.27
16.90
15.79
15.45
16.24
16.71
16.77
16.64
17.80
16.87
16.13
15.76
15.66
15.54
15.30
15.05
14.69
14.39
14.18
13.70
13.66
13.27
13.56
13.14
14.19
22.57
23.09
23.31
22.91
22.36
43.06
64.67
64.68
56.90
48.79
45.21
41.40
22.17
25.52
20.28
22.87
27.63
22.95
21.35
18.38
17.15
18.27
19.40
20.52


Summary of computational transaction
Raw Inputview raw input (R code)
Raw Outputview raw output of R engine
Computing time2 seconds
R Server'Herman Ole Andreas Wold' @ 193.190.124.10:1001

\begin{tabular}{lllllllll}
\hline
Summary of computational transaction \tabularnewline
Raw Input & view raw input (R code)  \tabularnewline
Raw Output & view raw output of R engine  \tabularnewline
Computing time & 2 seconds \tabularnewline
R Server & 'Herman Ole Andreas Wold' @ 193.190.124.10:1001 \tabularnewline
\hline
\end{tabular}
%Source: https://freestatistics.org/blog/index.php?pk=12716&T=0

[TABLE]
[ROW][C]Summary of computational transaction[/C][/ROW]
[ROW][C]Raw Input[/C][C]view raw input (R code) [/C][/ROW]
[ROW][C]Raw Output[/C][C]view raw output of R engine [/C][/ROW]
[ROW][C]Computing time[/C][C]2 seconds[/C][/ROW]
[ROW][C]R Server[/C][C]'Herman Ole Andreas Wold' @ 193.190.124.10:1001[/C][/ROW]
[/TABLE]
Source: https://freestatistics.org/blog/index.php?pk=12716&T=0

Globally Unique Identifier (entire table): ba.freestatistics.org/blog/index.php?pk=12716&T=0

As an alternative you can also use a QR Code:  

The GUIDs for individual cells are displayed in the table below:

Summary of computational transaction
Raw Inputview raw input (R code)
Raw Outputview raw output of R engine
Computing time2 seconds
R Server'Herman Ole Andreas Wold' @ 193.190.124.10:1001


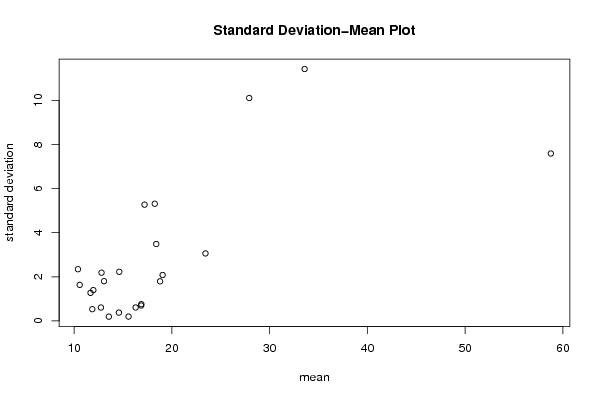
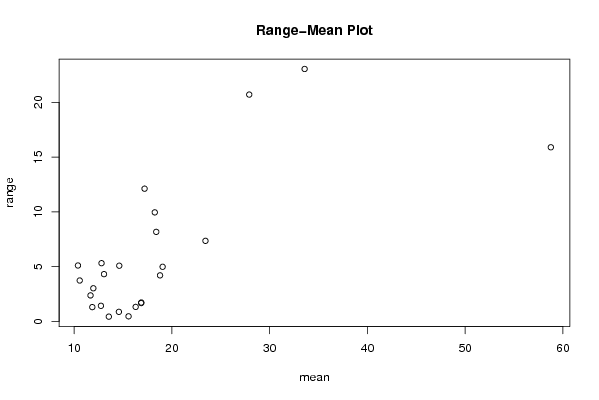
Standard Deviation-Mean Plot
SectionMeanStandard DeviationRange
118.39753.486319692741908.17
213.0551.802710921547514.31
311.6751.272910051810422.37
412.82.186702235483075.31
519.052.081585933849484.98
617.20255.2709352427565812.11
714.6152.227128195681605.08
810.392.345620031747115.1
910.571.634768077332893.73
1012.74250.6081871970591511.42
1111.85750.5333776023294071.3
1211.96251.398460463033073.02
1316.86750.7608931155775661.72000000000000
1416.29250.6096105314050941.32
1516.860.6988085097745551.67000000000000
1615.5650.1982422760159900.459999999999999
1714.57750.3781864619470140.870000000000001
1813.54750.194143417778370.43
1918.24755.312992722248619.95
2027.9110.107505462114120.7
2158.767.5902349546418315.89
2233.57511.424548131107923.04
2323.43253.060853639101357.35
2418.78751.796447884020024.2

\begin{tabular}{lllllllll}
\hline
Standard Deviation-Mean Plot \tabularnewline
Section & Mean & Standard Deviation & Range \tabularnewline
1 & 18.3975 & 3.48631969274190 & 8.17 \tabularnewline
2 & 13.055 & 1.80271092154751 & 4.31 \tabularnewline
3 & 11.675 & 1.27291005181042 & 2.37 \tabularnewline
4 & 12.8 & 2.18670223548307 & 5.31 \tabularnewline
5 & 19.05 & 2.08158593384948 & 4.98 \tabularnewline
6 & 17.2025 & 5.27093524275658 & 12.11 \tabularnewline
7 & 14.615 & 2.22712819568160 & 5.08 \tabularnewline
8 & 10.39 & 2.34562003174711 & 5.1 \tabularnewline
9 & 10.57 & 1.63476807733289 & 3.73 \tabularnewline
10 & 12.7425 & 0.608187197059151 & 1.42 \tabularnewline
11 & 11.8575 & 0.533377602329407 & 1.3 \tabularnewline
12 & 11.9625 & 1.39846046303307 & 3.02 \tabularnewline
13 & 16.8675 & 0.760893115577566 & 1.72000000000000 \tabularnewline
14 & 16.2925 & 0.609610531405094 & 1.32 \tabularnewline
15 & 16.86 & 0.698808509774555 & 1.67000000000000 \tabularnewline
16 & 15.565 & 0.198242276015990 & 0.459999999999999 \tabularnewline
17 & 14.5775 & 0.378186461947014 & 0.870000000000001 \tabularnewline
18 & 13.5475 & 0.19414341777837 & 0.43 \tabularnewline
19 & 18.2475 & 5.31299272224861 & 9.95 \tabularnewline
20 & 27.91 & 10.1075054621141 & 20.7 \tabularnewline
21 & 58.76 & 7.59023495464183 & 15.89 \tabularnewline
22 & 33.575 & 11.4245481311079 & 23.04 \tabularnewline
23 & 23.4325 & 3.06085363910135 & 7.35 \tabularnewline
24 & 18.7875 & 1.79644788402002 & 4.2 \tabularnewline
\hline
\end{tabular}
%Source: https://freestatistics.org/blog/index.php?pk=12716&T=1

[TABLE]
[ROW][C]Standard Deviation-Mean Plot[/C][/ROW]
[ROW][C]Section[/C][C]Mean[/C][C]Standard Deviation[/C][C]Range[/C][/ROW]
[ROW][C]1[/C][C]18.3975[/C][C]3.48631969274190[/C][C]8.17[/C][/ROW]
[ROW][C]2[/C][C]13.055[/C][C]1.80271092154751[/C][C]4.31[/C][/ROW]
[ROW][C]3[/C][C]11.675[/C][C]1.27291005181042[/C][C]2.37[/C][/ROW]
[ROW][C]4[/C][C]12.8[/C][C]2.18670223548307[/C][C]5.31[/C][/ROW]
[ROW][C]5[/C][C]19.05[/C][C]2.08158593384948[/C][C]4.98[/C][/ROW]
[ROW][C]6[/C][C]17.2025[/C][C]5.27093524275658[/C][C]12.11[/C][/ROW]
[ROW][C]7[/C][C]14.615[/C][C]2.22712819568160[/C][C]5.08[/C][/ROW]
[ROW][C]8[/C][C]10.39[/C][C]2.34562003174711[/C][C]5.1[/C][/ROW]
[ROW][C]9[/C][C]10.57[/C][C]1.63476807733289[/C][C]3.73[/C][/ROW]
[ROW][C]10[/C][C]12.7425[/C][C]0.608187197059151[/C][C]1.42[/C][/ROW]
[ROW][C]11[/C][C]11.8575[/C][C]0.533377602329407[/C][C]1.3[/C][/ROW]
[ROW][C]12[/C][C]11.9625[/C][C]1.39846046303307[/C][C]3.02[/C][/ROW]
[ROW][C]13[/C][C]16.8675[/C][C]0.760893115577566[/C][C]1.72000000000000[/C][/ROW]
[ROW][C]14[/C][C]16.2925[/C][C]0.609610531405094[/C][C]1.32[/C][/ROW]
[ROW][C]15[/C][C]16.86[/C][C]0.698808509774555[/C][C]1.67000000000000[/C][/ROW]
[ROW][C]16[/C][C]15.565[/C][C]0.198242276015990[/C][C]0.459999999999999[/C][/ROW]
[ROW][C]17[/C][C]14.5775[/C][C]0.378186461947014[/C][C]0.870000000000001[/C][/ROW]
[ROW][C]18[/C][C]13.5475[/C][C]0.19414341777837[/C][C]0.43[/C][/ROW]
[ROW][C]19[/C][C]18.2475[/C][C]5.31299272224861[/C][C]9.95[/C][/ROW]
[ROW][C]20[/C][C]27.91[/C][C]10.1075054621141[/C][C]20.7[/C][/ROW]
[ROW][C]21[/C][C]58.76[/C][C]7.59023495464183[/C][C]15.89[/C][/ROW]
[ROW][C]22[/C][C]33.575[/C][C]11.4245481311079[/C][C]23.04[/C][/ROW]
[ROW][C]23[/C][C]23.4325[/C][C]3.06085363910135[/C][C]7.35[/C][/ROW]
[ROW][C]24[/C][C]18.7875[/C][C]1.79644788402002[/C][C]4.2[/C][/ROW]
[/TABLE]
Source: https://freestatistics.org/blog/index.php?pk=12716&T=1

Globally Unique Identifier (entire table): ba.freestatistics.org/blog/index.php?pk=12716&T=1

As an alternative you can also use a QR Code:  

The GUIDs for individual cells are displayed in the table below:

Standard Deviation-Mean Plot
SectionMeanStandard DeviationRange
118.39753.486319692741908.17
213.0551.802710921547514.31
311.6751.272910051810422.37
412.82.186702235483075.31
519.052.081585933849484.98
617.20255.2709352427565812.11
714.6152.227128195681605.08
810.392.345620031747115.1
910.571.634768077332893.73
1012.74250.6081871970591511.42
1111.85750.5333776023294071.3
1211.96251.398460463033073.02
1316.86750.7608931155775661.72000000000000
1416.29250.6096105314050941.32
1516.860.6988085097745551.67000000000000
1615.5650.1982422760159900.459999999999999
1714.57750.3781864619470140.870000000000001
1813.54750.194143417778370.43
1918.24755.312992722248619.95
2027.9110.107505462114120.7
2158.767.5902349546418315.89
2233.57511.424548131107923.04
2323.43253.060853639101357.35
2418.78751.796447884020024.2


Regression: S.E.(k) = alpha + beta * Mean(k)
alpha-1.03807808305904
beta0.209452173826233
S.D.0.0458150002149106
T-STAT4.57169426702451
p-value0.000149311582365608

\begin{tabular}{lllllllll}
\hline
Regression: S.E.(k) = alpha + beta * Mean(k) \tabularnewline
alpha & -1.03807808305904 \tabularnewline
beta & 0.209452173826233 \tabularnewline
S.D. & 0.0458150002149106 \tabularnewline
T-STAT & 4.57169426702451 \tabularnewline
p-value & 0.000149311582365608 \tabularnewline
\hline
\end{tabular}
%Source: https://freestatistics.org/blog/index.php?pk=12716&T=2

[TABLE]
[ROW][C]Regression: S.E.(k) = alpha + beta * Mean(k)[/C][/ROW]
[ROW][C]alpha[/C][C]-1.03807808305904[/C][/ROW]
[ROW][C]beta[/C][C]0.209452173826233[/C][/ROW]
[ROW][C]S.D.[/C][C]0.0458150002149106[/C][/ROW]
[ROW][C]T-STAT[/C][C]4.57169426702451[/C][/ROW]
[ROW][C]p-value[/C][C]0.000149311582365608[/C][/ROW]
[/TABLE]
Source: https://freestatistics.org/blog/index.php?pk=12716&T=2

Globally Unique Identifier (entire table): ba.freestatistics.org/blog/index.php?pk=12716&T=2

As an alternative you can also use a QR Code:  

The GUIDs for individual cells are displayed in the table below:

Regression: S.E.(k) = alpha + beta * Mean(k)
alpha-1.03807808305904
beta0.209452173826233
S.D.0.0458150002149106
T-STAT4.57169426702451
p-value0.000149311582365608


Regression: ln S.E.(k) = alpha + beta * ln Mean(k)
alpha-4.22039941591226
beta1.66856351726294
S.D.0.495449501373472
T-STAT3.36777716525577
p-value0.00277665027818061
Lambda-0.66856351726294

\begin{tabular}{lllllllll}
\hline
Regression: ln S.E.(k) = alpha + beta * ln Mean(k) \tabularnewline
alpha & -4.22039941591226 \tabularnewline
beta & 1.66856351726294 \tabularnewline
S.D. & 0.495449501373472 \tabularnewline
T-STAT & 3.36777716525577 \tabularnewline
p-value & 0.00277665027818061 \tabularnewline
Lambda & -0.66856351726294 \tabularnewline
\hline
\end{tabular}
%Source: https://freestatistics.org/blog/index.php?pk=12716&T=3

[TABLE]
[ROW][C]Regression: ln S.E.(k) = alpha + beta * ln Mean(k)[/C][/ROW]
[ROW][C]alpha[/C][C]-4.22039941591226[/C][/ROW]
[ROW][C]beta[/C][C]1.66856351726294[/C][/ROW]
[ROW][C]S.D.[/C][C]0.495449501373472[/C][/ROW]
[ROW][C]T-STAT[/C][C]3.36777716525577[/C][/ROW]
[ROW][C]p-value[/C][C]0.00277665027818061[/C][/ROW]
[ROW][C]Lambda[/C][C]-0.66856351726294[/C][/ROW]
[/TABLE]
Source: https://freestatistics.org/blog/index.php?pk=12716&T=3

Globally Unique Identifier (entire table): ba.freestatistics.org/blog/index.php?pk=12716&T=3

As an alternative you can also use a QR Code:  

The GUIDs for individual cells are displayed in the table below:

Regression: ln S.E.(k) = alpha + beta * ln Mean(k)
alpha-4.22039941591226
beta1.66856351726294
S.D.0.495449501373472
T-STAT3.36777716525577
p-value0.00277665027818061
Lambda-0.66856351726294


Parameters (Session):
par1 = 4 ;
Parameters (R input):
par1 = 4 ;
R code (references can be found in the software module):
par1 <- as.numeric(par1)
(n <- length(x))
(np <- floor(n / par1))
arr <- array(NA,dim=c(par1,np))
j <- 0
k <- 1
for (i in 1:(np*par1))
{
j = j + 1
arr[j,k] <- x[i]
if (j == par1) {
j = 0
k=k+1
}
}
arr
arr.mean <- array(NA,dim=np)
arr.sd <- array(NA,dim=np)
arr.range <- array(NA,dim=np)
for (j in 1:np)
{
arr.mean[j] <- mean(arr[,j],na.rm=TRUE)
arr.sd[j] <- sd(arr[,j],na.rm=TRUE)
arr.range[j] <- max(arr[,j],na.rm=TRUE) - min(arr[,j],na.rm=TRUE)
}
arr.mean
arr.sd
arr.range
(lm1 <- lm(arr.sd~arr.mean))
(lnlm1 <- lm(log(arr.sd)~log(arr.mean)))
(lm2 <- lm(arr.range~arr.mean))
bitmap(file='test1.png')
plot(arr.mean,arr.sd,main='Standard Deviation-Mean Plot',xlab='mean',ylab='standard deviation')
dev.off()
bitmap(file='test2.png')
plot(arr.mean,arr.range,main='Range-Mean Plot',xlab='mean',ylab='range')
dev.off()
load(file='createtable')
a<-table.start()
a<-table.row.start(a)
a<-table.element(a,'Standard Deviation-Mean Plot',4,TRUE)
a<-table.row.end(a)
a<-table.row.start(a)
a<-table.element(a,'Section',header=TRUE)
a<-table.element(a,'Mean',header=TRUE)
a<-table.element(a,'Standard Deviation',header=TRUE)
a<-table.element(a,'Range',header=TRUE)
a<-table.row.end(a)
for (j in 1:np) {
a<-table.row.start(a)
a<-table.element(a,j,header=TRUE)
a<-table.element(a,arr.mean[j])
a<-table.element(a,arr.sd[j] )
a<-table.element(a,arr.range[j] )
a<-table.row.end(a)
}
a<-table.end(a)
table.save(a,file='mytable.tab')
a<-table.start()
a<-table.row.start(a)
a<-table.element(a,'Regression: S.E.(k) = alpha + beta * Mean(k)',2,TRUE)
a<-table.row.end(a)
a<-table.row.start(a)
a<-table.element(a,'alpha',header=TRUE)
a<-table.element(a,lm1$coefficients[[1]])
a<-table.row.end(a)
a<-table.row.start(a)
a<-table.element(a,'beta',header=TRUE)
a<-table.element(a,lm1$coefficients[[2]])
a<-table.row.end(a)
a<-table.row.start(a)
a<-table.element(a,'S.D.',header=TRUE)
a<-table.element(a,summary(lm1)$coefficients[2,2])
a<-table.row.end(a)
a<-table.row.start(a)
a<-table.element(a,'T-STAT',header=TRUE)
a<-table.element(a,summary(lm1)$coefficients[2,3])
a<-table.row.end(a)
a<-table.row.start(a)
a<-table.element(a,'p-value',header=TRUE)
a<-table.element(a,summary(lm1)$coefficients[2,4])
a<-table.row.end(a)
a<-table.end(a)
table.save(a,file='mytable1.tab')
a<-table.start()
a<-table.row.start(a)
a<-table.element(a,'Regression: ln S.E.(k) = alpha + beta * ln Mean(k)',2,TRUE)
a<-table.row.end(a)
a<-table.row.start(a)
a<-table.element(a,'alpha',header=TRUE)
a<-table.element(a,lnlm1$coefficients[[1]])
a<-table.row.end(a)
a<-table.row.start(a)
a<-table.element(a,'beta',header=TRUE)
a<-table.element(a,lnlm1$coefficients[[2]])
a<-table.row.end(a)
a<-table.row.start(a)
a<-table.element(a,'S.D.',header=TRUE)
a<-table.element(a,summary(lnlm1)$coefficients[2,2])
a<-table.row.end(a)
a<-table.row.start(a)
a<-table.element(a,'T-STAT',header=TRUE)
a<-table.element(a,summary(lnlm1)$coefficients[2,3])
a<-table.row.end(a)
a<-table.row.start(a)
a<-table.element(a,'p-value',header=TRUE)
a<-table.element(a,summary(lnlm1)$coefficients[2,4])
a<-table.row.end(a)
a<-table.row.start(a)
a<-table.element(a,'Lambda',header=TRUE)
a<-table.element(a,1-lnlm1$coefficients[[2]])
a<-table.row.end(a)
a<-table.end(a)
table.save(a,file='mytable2.tab')